Sign up for Free Kaiko Research


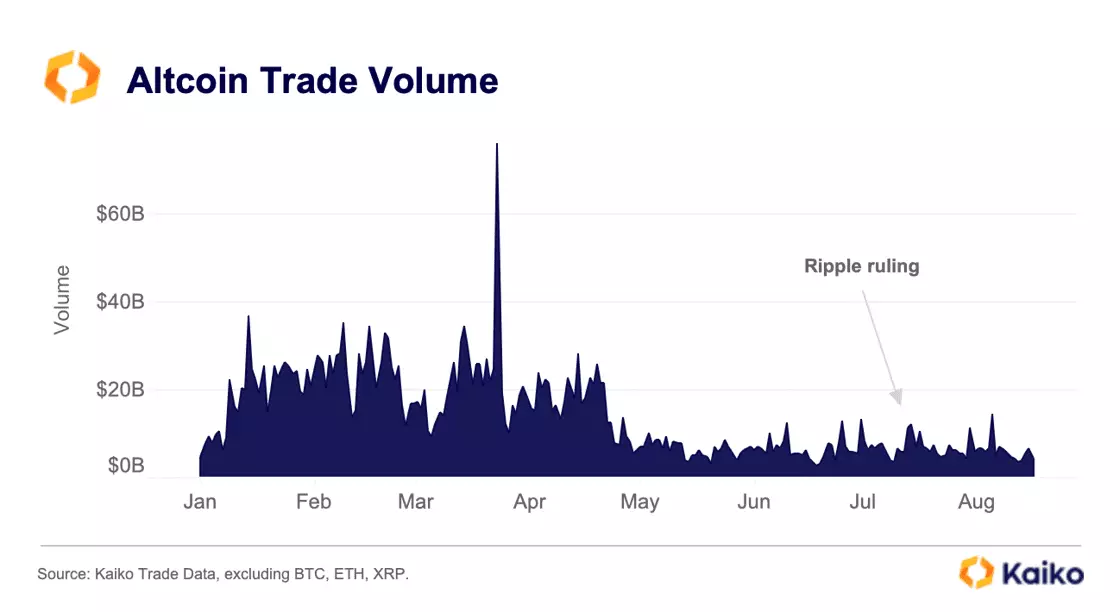
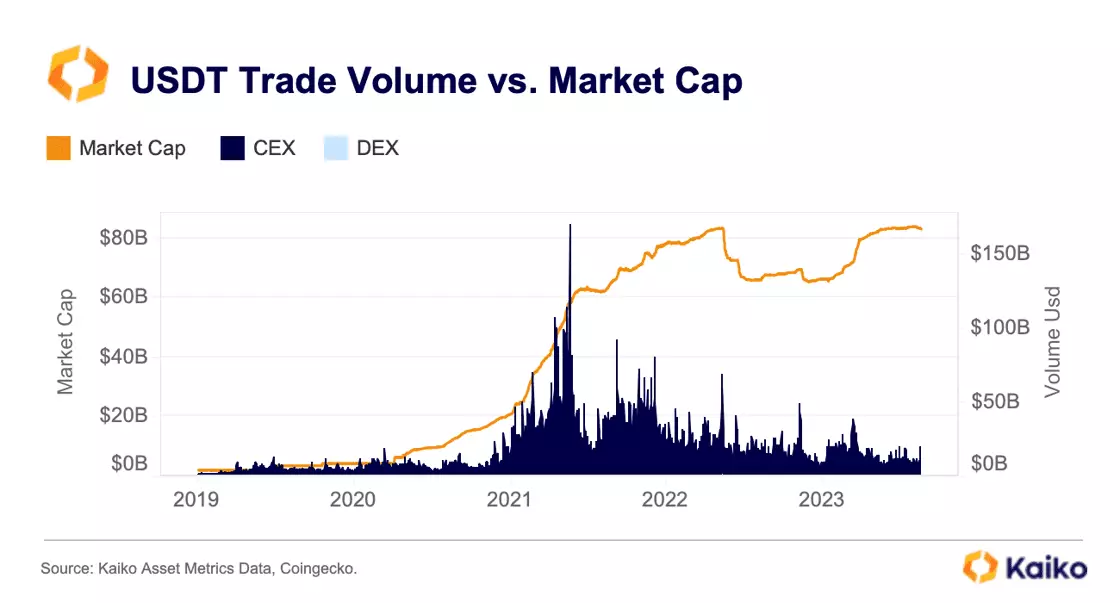
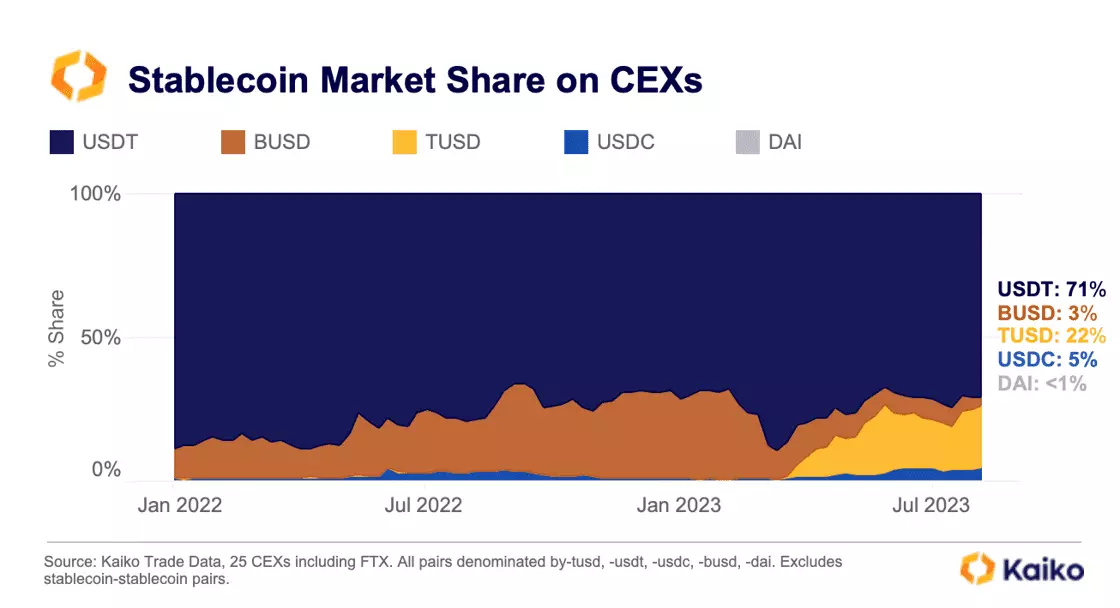
Top Trends of the Summer
Written by The Kaiko Research Team
21/08/2023

Welcome to the Data Debrief!


More From Kaiko Research
![]()
Derivatives
09/02/2026 Data Debrief
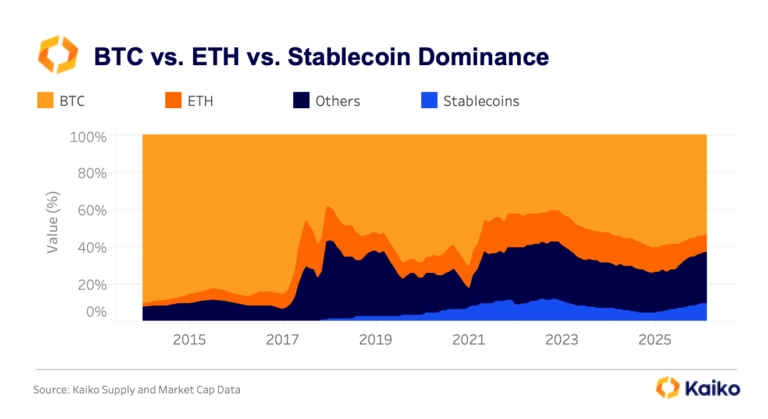
Bitcoin's Latest Drop Signals Halfway Point of Bear MarketLast week’s correction triggered approximately $9 billion in liquidations and pushed stablecoin dominance above 10%, exceeding levels last seen during the FTX collapse.
Written by Laurens Fraussen![]()
Binance
02/02/2026 Data Debrief
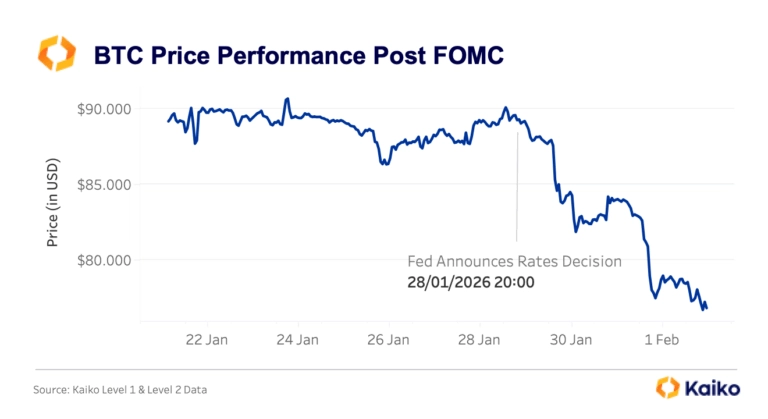
Fed Reforms Spark Cross-Asset Volatility SpikeThe final week of January 2026 delivered a stress test across multiple markets simultaneously. As the Federal Reserve held rates steady at 3.5-3.75% amid leadership transition uncertainty, Bitcoin declined 15% from $88,000 to $74,500, triggering ~$7 billion in liquidations.
Written by Laurens Fraussen![]()
Macro
26/01/2026 Data Debrief
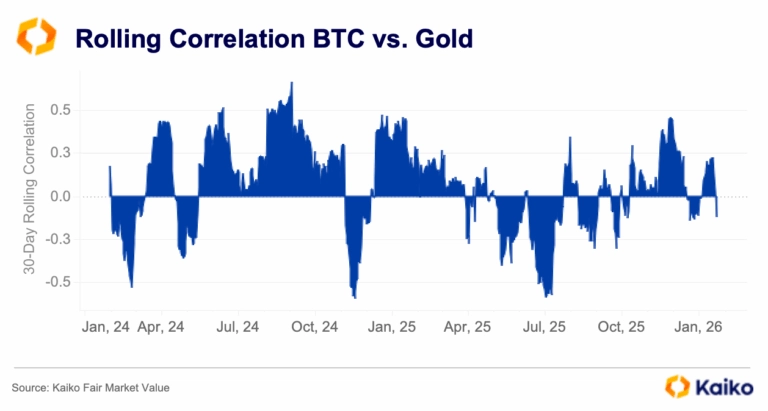
Tariff Uncertainty Exposes Bitcoin's Identity CrisisTariff volatility exposed Bitcoin’s ongoing identity crisis. Trump’s Greenland tariff threats triggered a violent round-trip in crypto markets, with Bitcoin plunging below $88,000 while gold surged over 5%, highlighting their inverse correlation. Behind the headlines, orderbook depth remained surprisingly stable even as the CME basis collapsed into negative territory for the first time in years, signaling the unwind of institutional carry trades that had anchored demand since ETF launches.
Written by Laurens Fraussen![]()
Macro
20/01/2026 Data Debrief
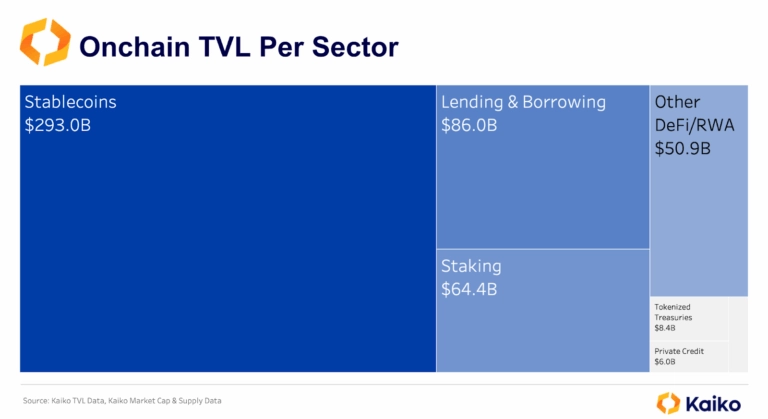
Infrastructure Is Holding Back TokenizationReal-world asset tokenization has evolved from a theoretical exercise into a measurable market, but the data reveals a split reality. Stablecoins have achieved massive scale, while tokenized securities, commodities, and infrastructure tokens remain concentrated, illiquid, and far from self-sustaining.
Written by Laurens Fraussen