Data Points
OP liquidity nears all-time high as Base attracts activity.
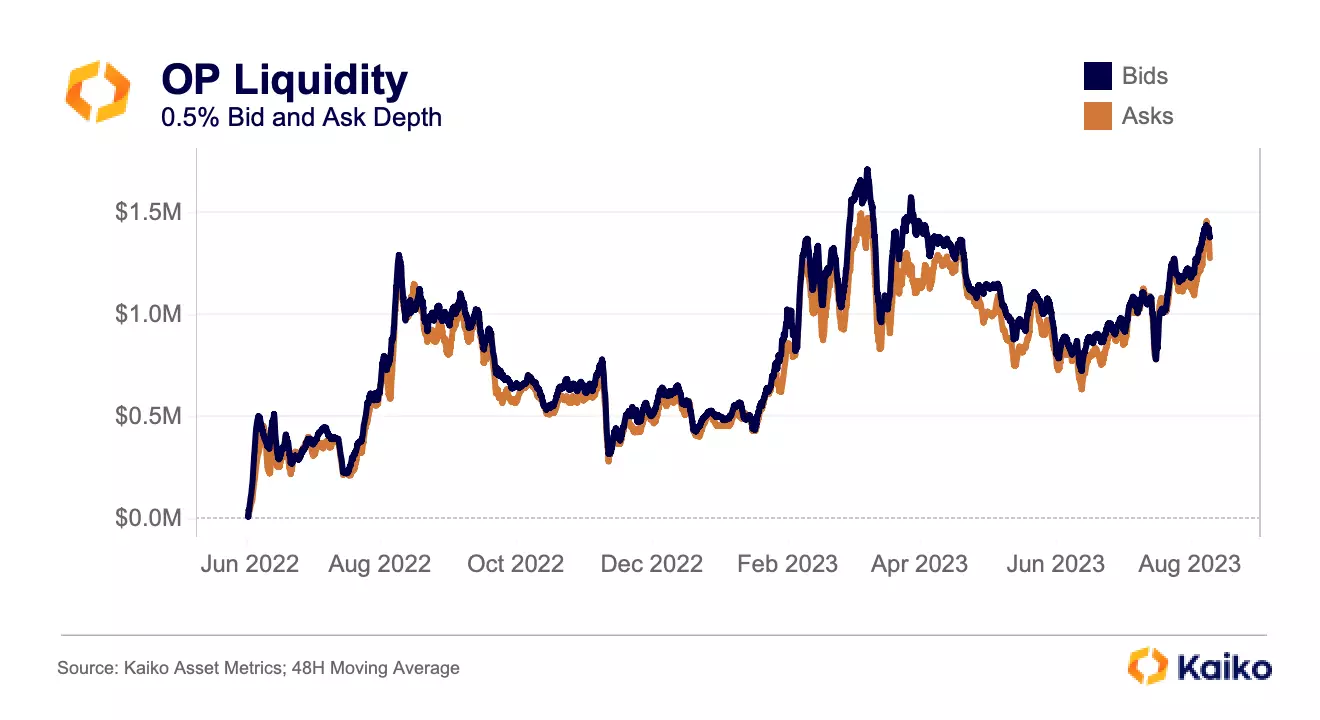
Liquidity for Optimism (OP) has surged since June, with both bids and asks within 0.5% of the mid price doubling from $750k to $1.5mn. This remains a bit below the high water marks hit in March 2023, just weeks after OP hit its ATH price of about $3.20; OP’s price is about 50% below this level as of this writing. Optimism – an Ethereum layer 2 network – has been boosted by the recent popularity of Base, Coinbase’s Ethereum L2 built on Optimism’s technology. In a blog post, Base stated that it will provide a percentage of transaction fees to the Optimism Collective – the DAO that governs Optimism.
The “ Alameda gap” persist amid low volatility.
Despite BTC prices rallying by more than 70% this year, the “Alameda gap” — the sharp decline in liquidity we observed after the collapse of FTX and its sister company Alameda Research — has persisted.
Bitcoin 2% market depth on top centralized exchanges has continued to deteriorate in 2023, stabilizing at around 5k BTC, more than 60% below its Oct 2022 level.
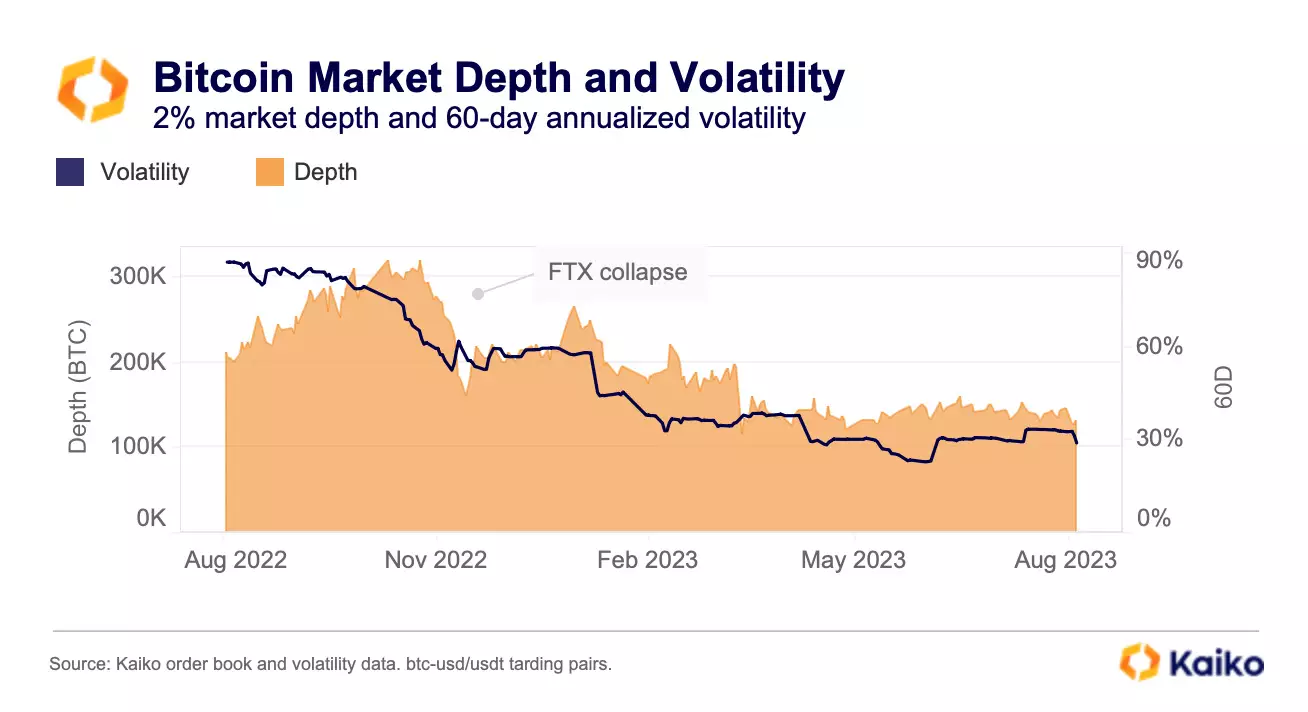
While this is partly due to structural reasons — i.e. market makers leaving the space after sustaining losses or permanently revising their risk management strategies after FTX — the low volatility environment is also playing a role in keeping liquidity providers out of the market.
Advanced traders who benefit from price swings have left the market en masse over the past months due to the decline in volatility. With trade volumes at multi-year lows, market makers who earn their revenue through the bid-ask spread on large number of trades, are less incentivized to provide liquidity even though volatility is low.
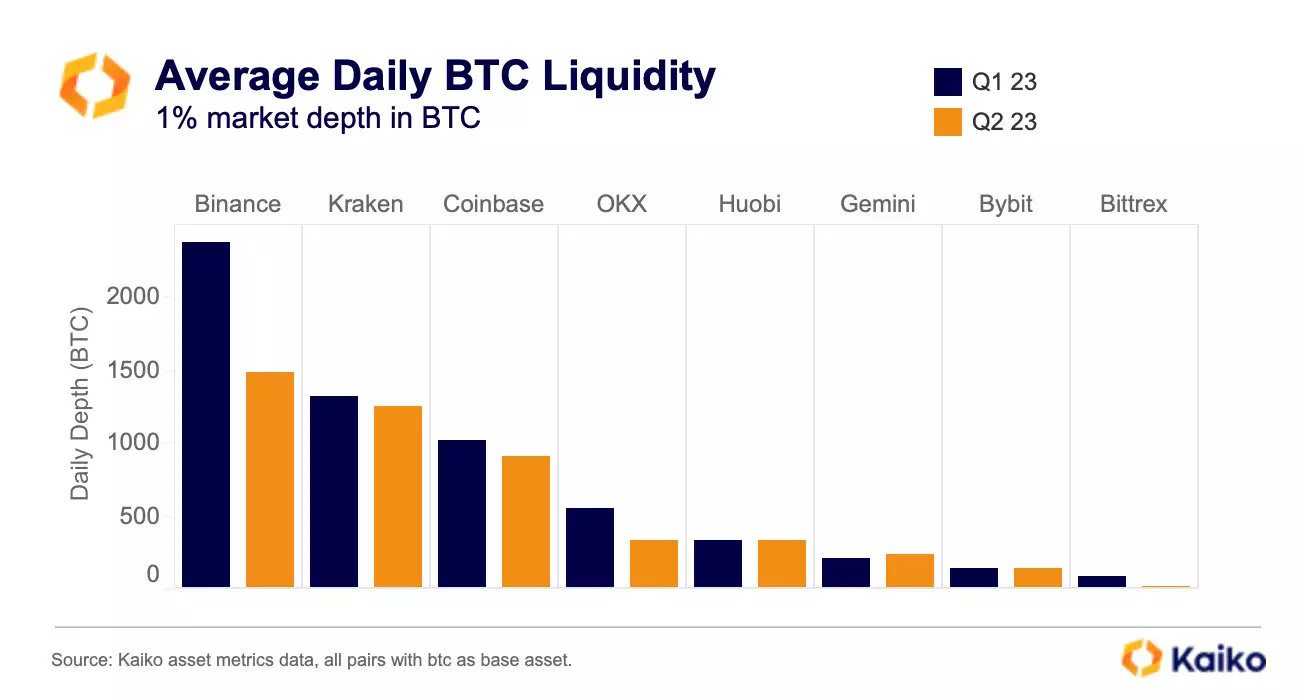
Looking at the average daily BTC liquidity on top exchanges in native units, Binance has seen the strongest drop in Q2 relative to the previous quarter. This is likely due to heightened regulatory uncertainty and the exchange removing its zero fee BTC promotion. OKX, Coinbase, and Kraken also registered a decline while, interestingly, smaller exchanges performed better, with BTC liquidity remaining flat on Bybit and increasing slightly on Gemini.
Overall, the low volume and liquidity environment is likely to exacerbate competition between exchanges and projects which often need agreements with liquidity providers for their tokens.
XRP price spikes to $50 post-listing on Gemini.
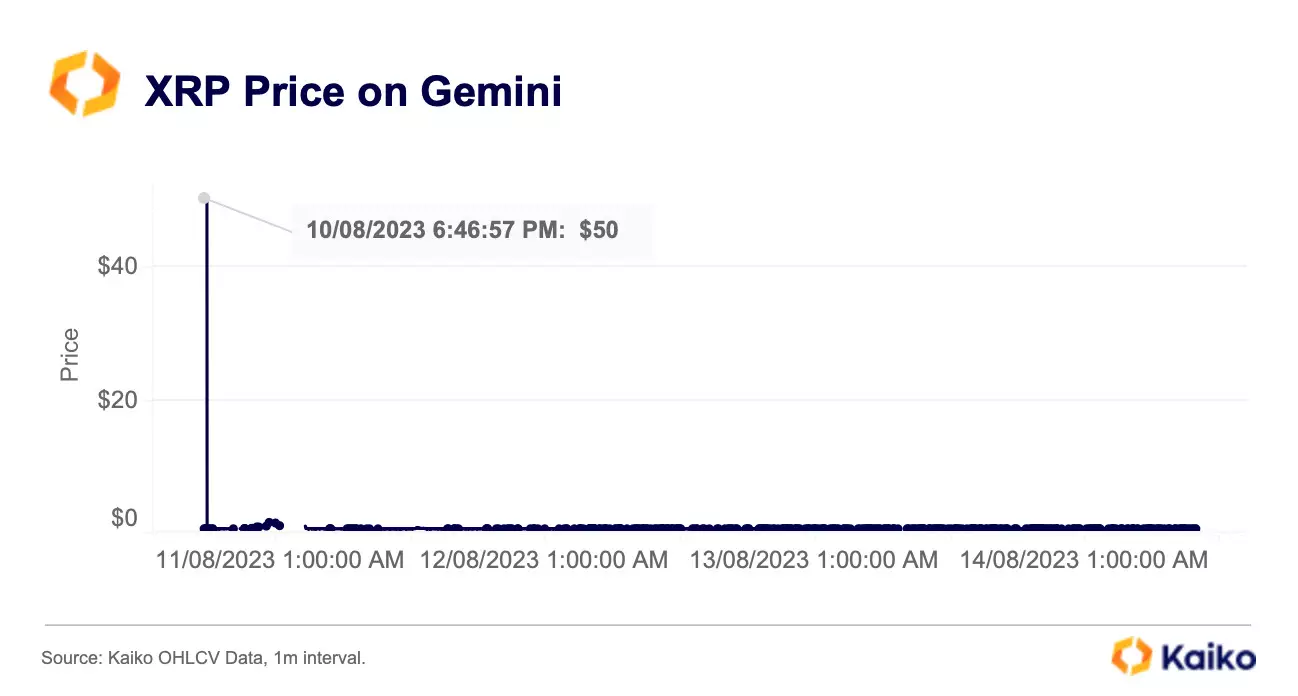
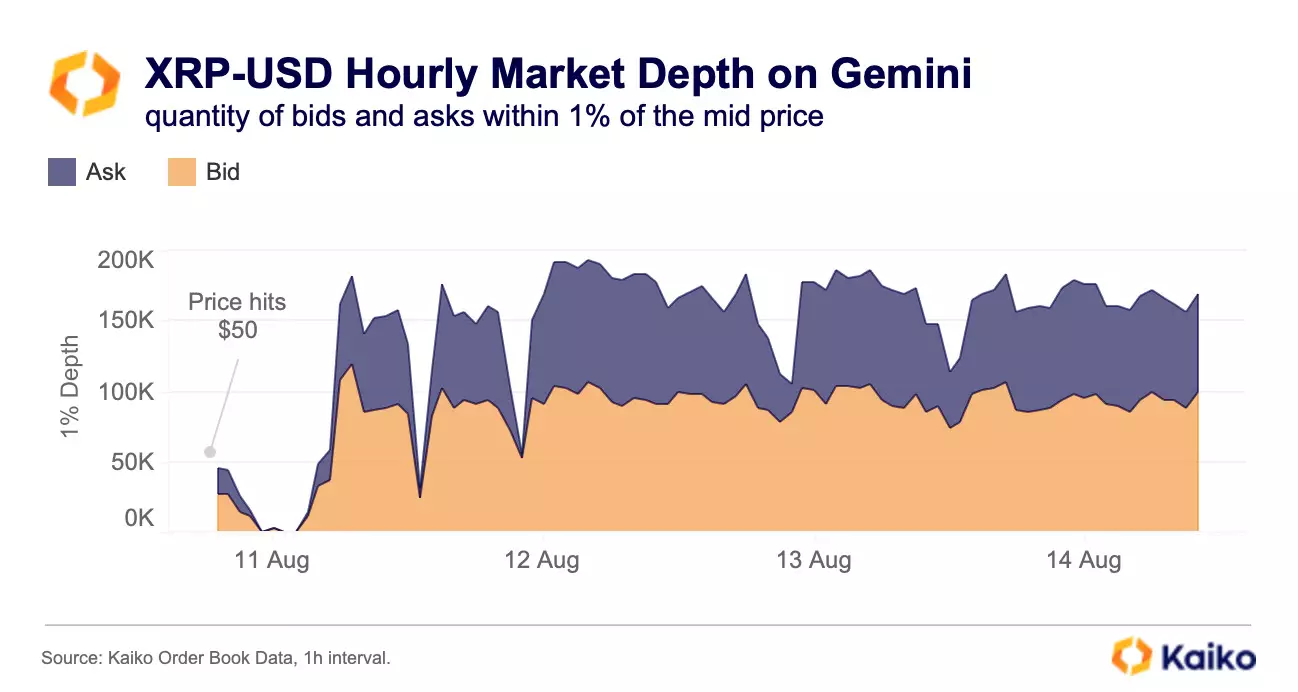
XRP prices on Gemini briefly rose to $50 last week after the exchange re-listed the token due to thin liquidity. The 1% XRP market depth on the exchange declined from 45k XRP to nearly zero as its price flew well beyond its normal range and market makers reduced activity. Liquidity has since recovered and currently hovers around 150k XRP.
Most U.S. platforms removed XRP from their offerings following the SEC’s lawsuit against XRP’s issuer Ripple in late 2020. However, after last month’s court ruling which stated that XRP is not considered a security in secondary markets transactions, several exchanges began to re-list the token. Despite the SEC’s announcement of plans to appeal the ruling, the share of XRP trading on U.S. exchanges has surged from 1% to 9% in the past few weeks.
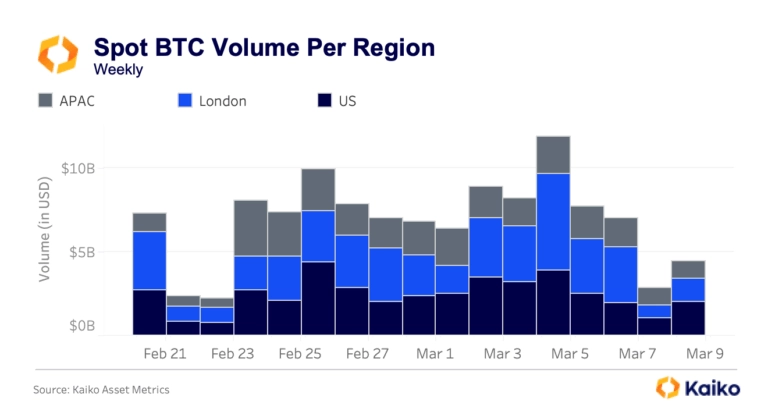
Trade volume increasingly skewed towards U.S. hours.
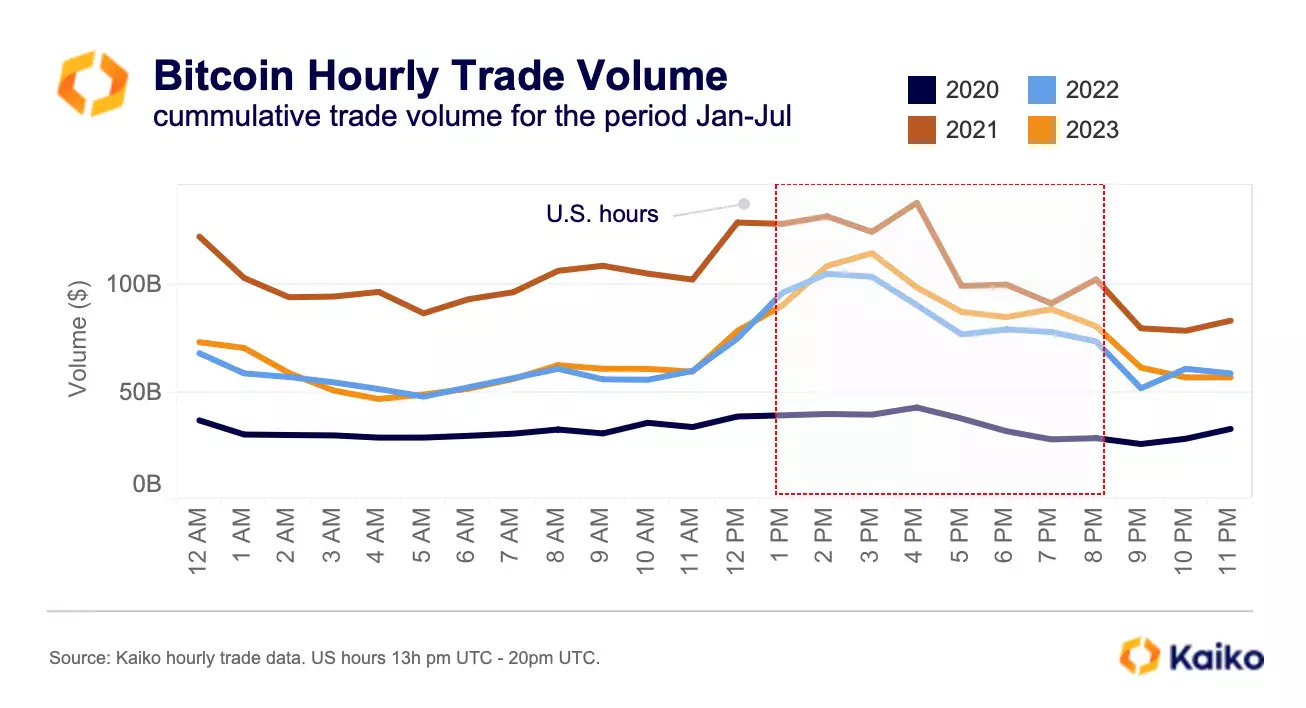
Over the past three years, BTC and ETH trade volumes have been increasingly skewed towards U.S. opening hours as both institutional and retail participation from U.S.-based traders increased. The share of BTC traded during U.S. opening hours continued to grow in 2023 even though trade volumes remained well below their 2021 bull run highs. The share of BTC traded during U.S. hours stood at 44% in Jan-Jul 2023, up from 43% in 2022 and 36% in 2021.
Cumulative ETH trade volume for the same period shows a slightly different trend. While the share of ETH traded during U.S. hours has also risen in 2023, ETH trade volumes in USD remain historically low, hovering around their levels from 2020.
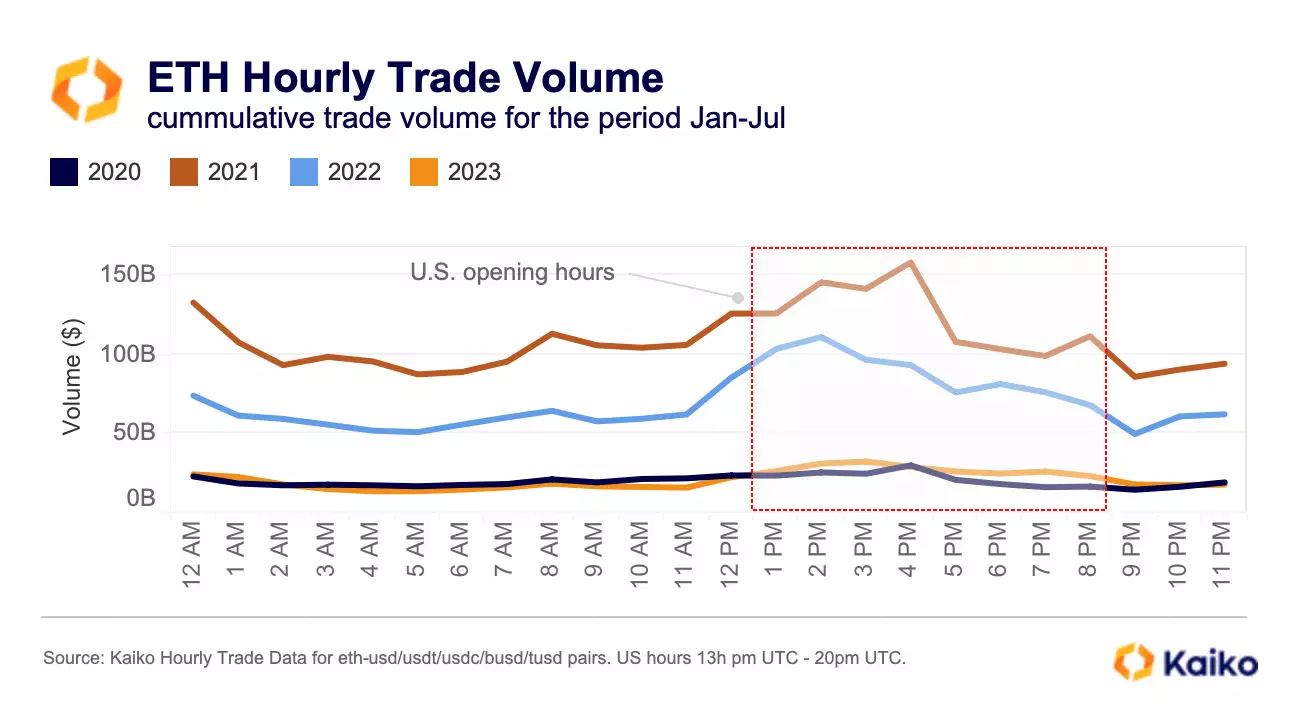
This suggests that while participation from U.S.-based traders has remained relatively robust, ETH trade volumes have suffered more than BTC’s, perhaps caused by the tightening regulatory environment in the U.S.
Binance sees strong decline in altcoin market share.
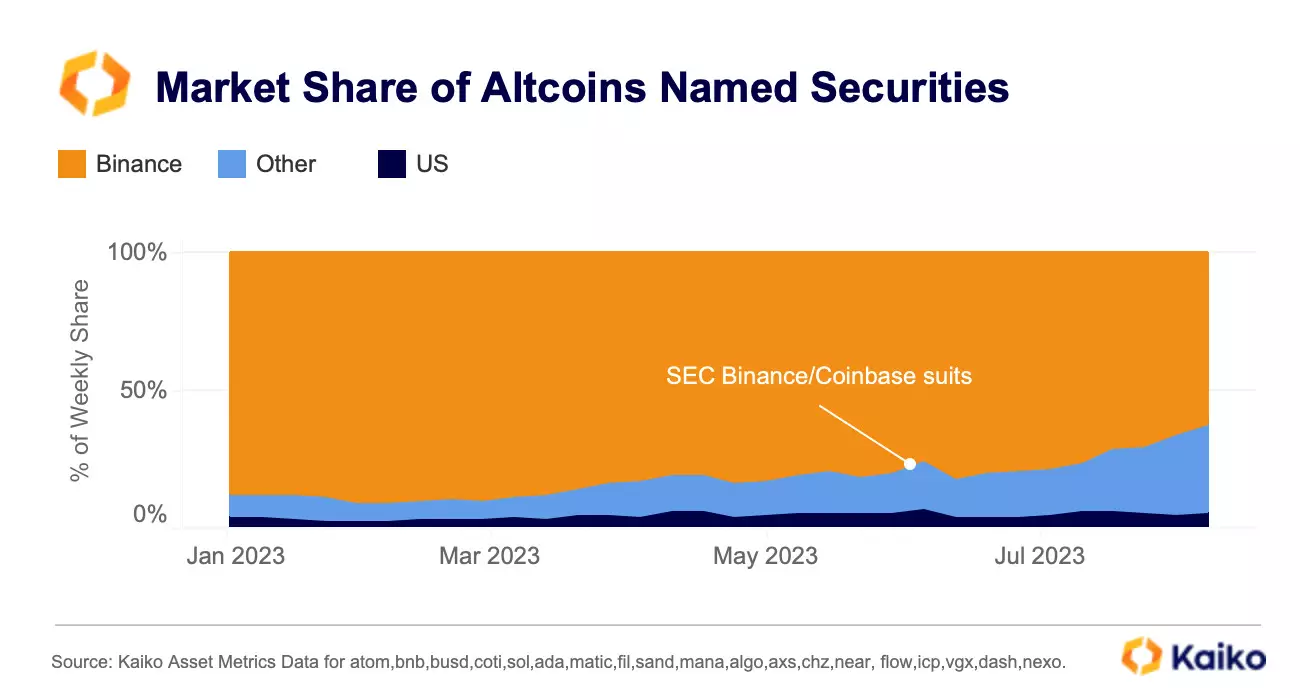
Last week Bitstamp announced it will halt trading for some altcoins named securities by the U.S. SEC in its suits against Binance and Coinbase. The move follows other platforms such as Robinhood, Bakkt, and eToro.
Interestingly, looking at the market share of trade volume of these altcoins, the share of U.S. exchanges has remained relatively flat at around 6% this year.
In contrast, Binance has seen a continued decline with its market share falling to its lowest level since January 2022. This has benefited other offshore exchanges, with Poloniex and Huobi registering the largest increases.