Trend of the Week
Summer of uncertainty ahead or testing new highs?
Summer has traditionally been a quieter period for both crypto and equity markets, with the old adage “sell in May and go away” often proving true. Historical data backs this up.
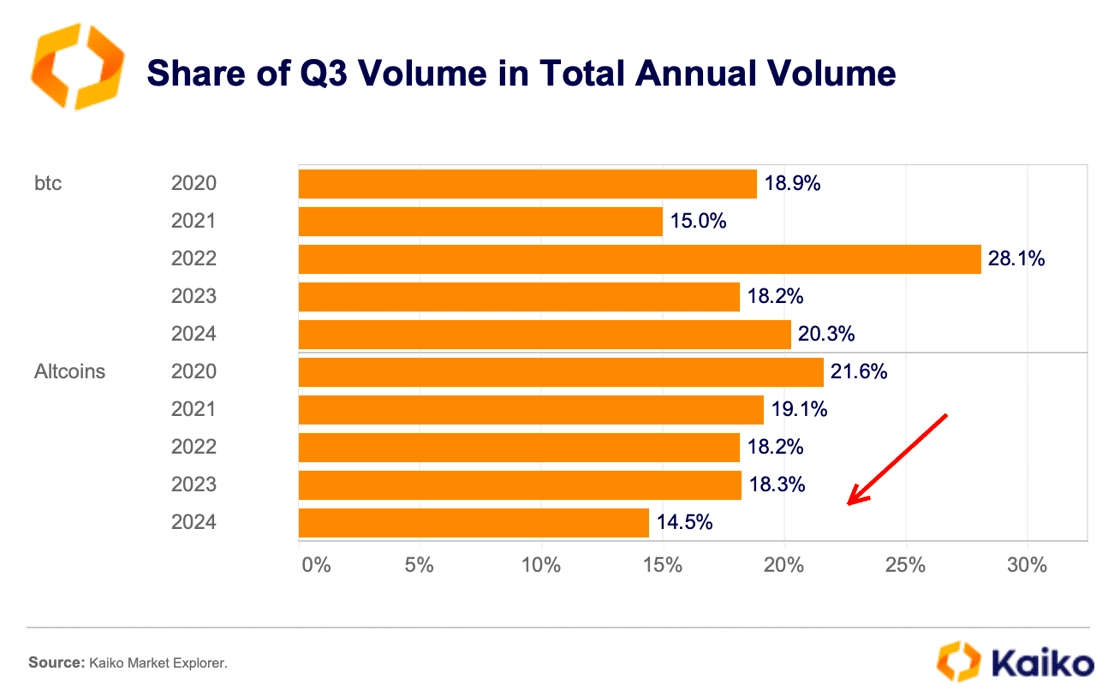
Since 2020, Q3 has consistently recorded the lowest trading volumes for Bitcoin, except in 2022, when cascading sell-offs triggered by the collapse of Celsius and Three Arrows Capital led to an unusual spike in summer activity.
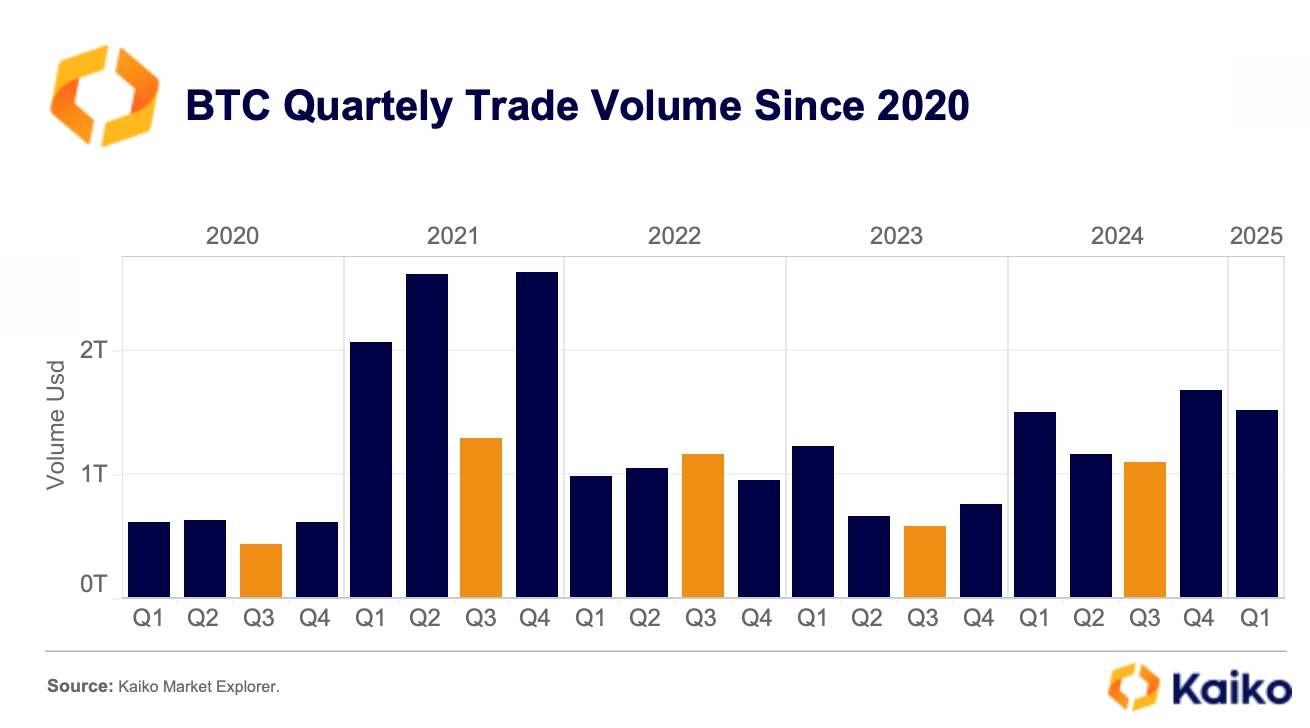
However, the trend becomes more nuanced when looking at Q3’s share of annual trading volume. For Bitcoin, Q3’s contribution has actually been increasing since 2021, reaching 20% of total annual volume in 2024.
In contrast, altcoins are showing a clear decline. Their Q3 share dropped below 15% in 2024, down significantly from 21.6% in 2020. This declining participation during the summer months does not bode well for altcoins, which have yet to mount a meaningful rally this cycle.
So, are we in for another sleepy summer?
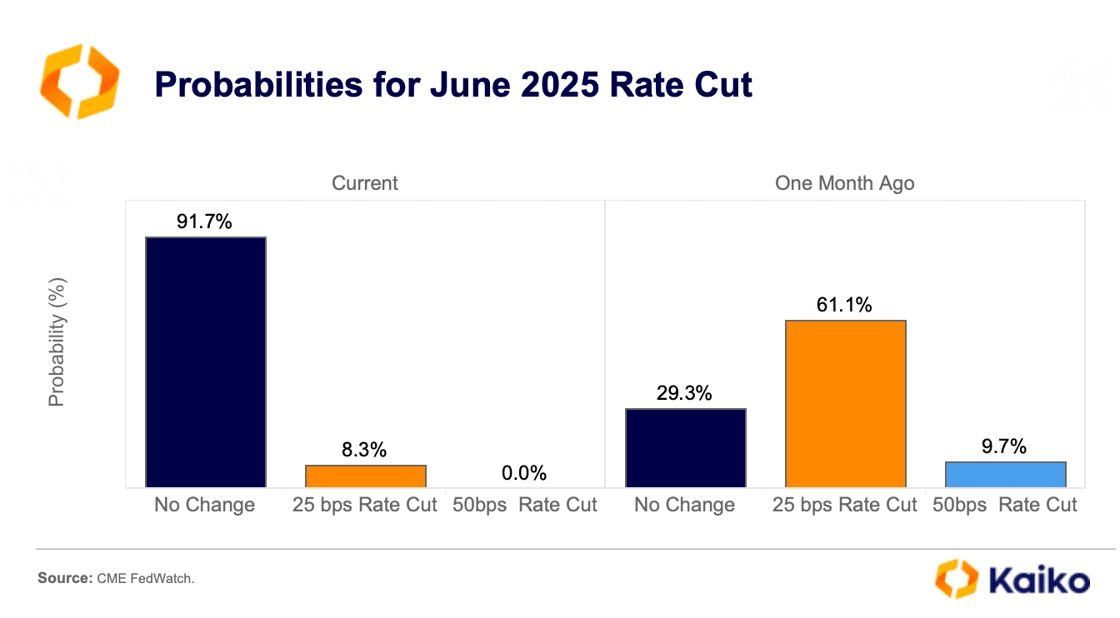
Probably not. Macro tailwinds have faded, with expectations for rate cuts pushed to September, and markets are now pricing in a return of transitory, tariff-driven inflation. In just a few weeks, the probability of a June rate cut has plunged from over 60% to just 8%, with the first move now not expected until September 2025.
Still, volatility may run higher than in past summers, especially with two major macro events converging. The Fed’s next meeting falls just a couple of weeks before President Trump’s tariff deadline. On April 10, the administration announced a 90-day pause for most countries in order to negotiate trade deals. That
ends on July 9.
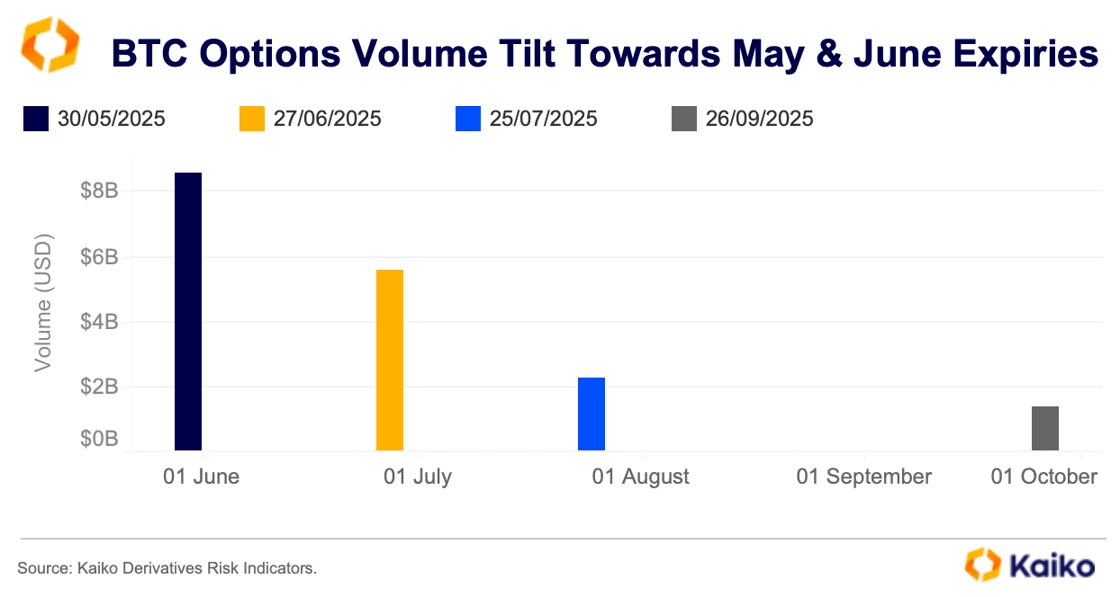
This window is already drawing attention in crypto derivatives markets. The June 27 options expiry on Deribit, which falls between both events, has seen a notable spike in volume, despite a dominant front-month expiration on May 30.
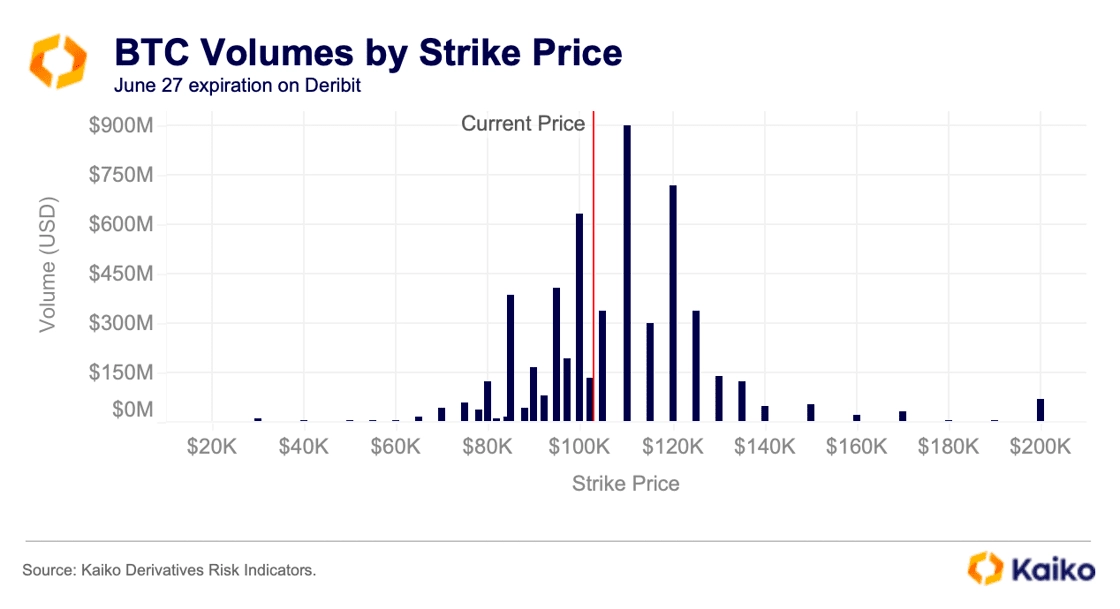
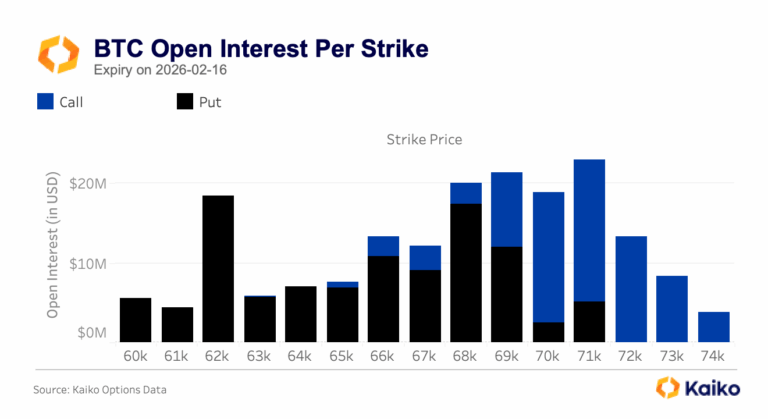
On the crypto side, the long-awaited U.S. crypto legislation, expected before Congress breaks for summer recess in August, could further shake up markets, particularly benefiting altcoins and U.S.-based exchanges. Despite the abundance of potential market-moving events around this expiration, traders are positioning accordingly. Volumes for the June 27 expiration since May 1 have been dominated by call options, with the most popular strike prices being $110K and $120K. In fact, there has been nearly $900 million in call option volume on the $110K strike so far this month, suggesting that some traders see BTC pushing to new record highs over the summer.
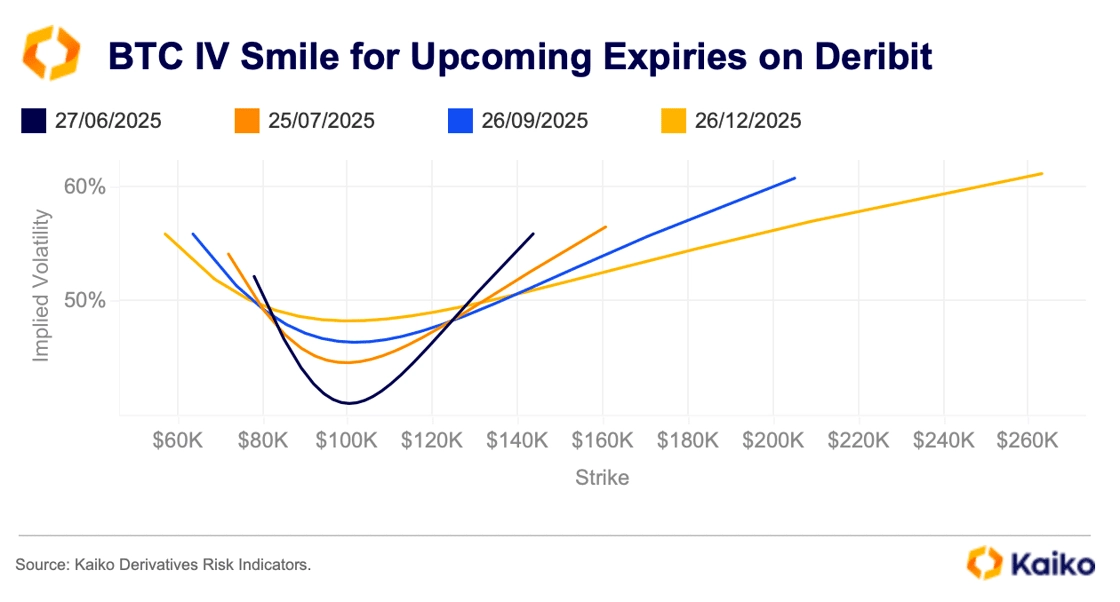
BTC implied volatility shows that demand remains bullish for this strike, with a slight tilt to the right. The following expiration, July 27, shows an even more pronounced tilt to the right. Although it is further away and therefore has higher time value, this is likely contributing to its bullish tilt as much as the current positive sentiment in the markets.
While the summer months tend to see less volume, positioning in options markets, coupled with macro factors, suggests we could see an uptick in activity in the coming months. In particular, it’s hard to discount the potential for market volatility related to the new U.S. administration’s tariff policy, which wreaked havoc on markets in the first quarter of the year.
Data Points
Don’t fear the ETH IV inversion.
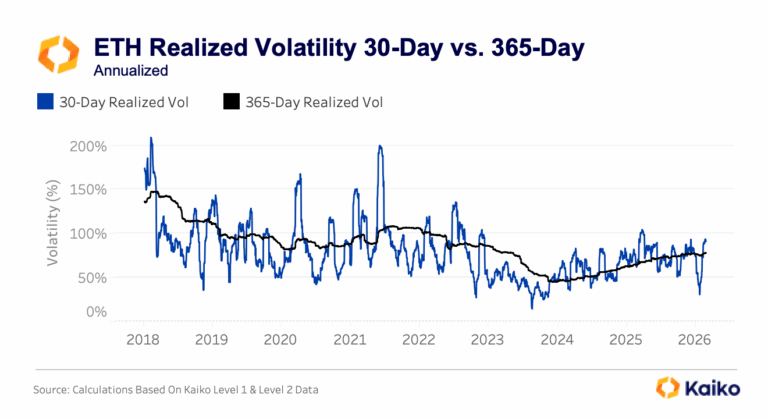
The recent ETH rally had some interesting implications for implied volatility. Notably, ETH at-the-money IV spiked, leading its term structure to invert. An IV term structure inversion occurs when short-dated expiries have IVs above longer-dated expiries, and typically it indicates a potential risk event in markets. However, this inversion is a little different.
Rather than indicating heightened risk, the move in IV reflects the rapid price rise in the spot market, as ETH soared over 60% in the past month.
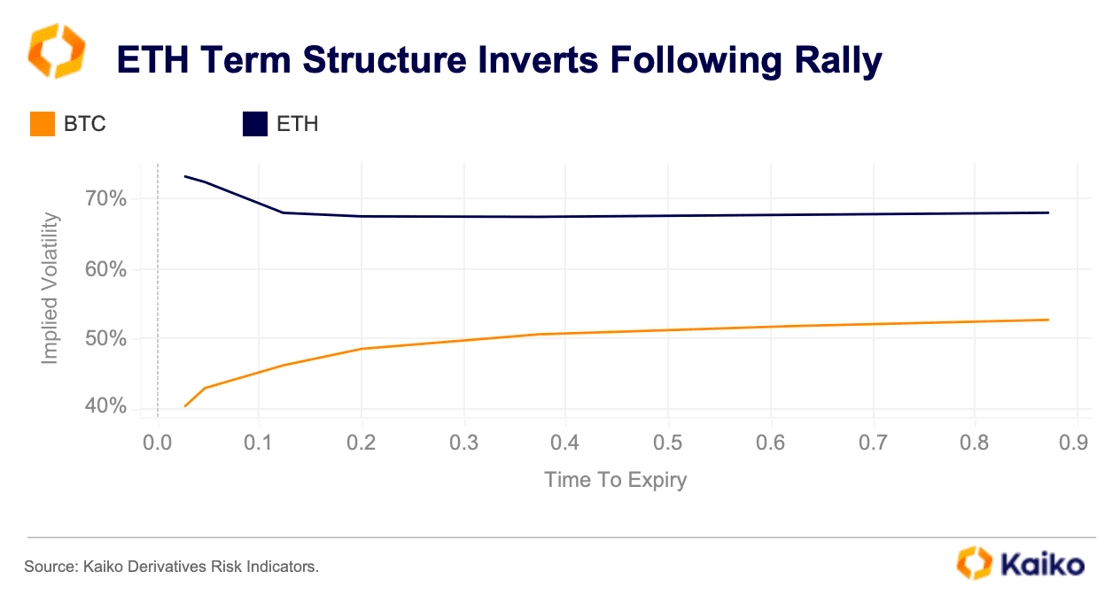
The rapid move higher was limited to ETH, as BTC had already climbed back above $100K throughout April; hence, its IV term structure is unchanged.
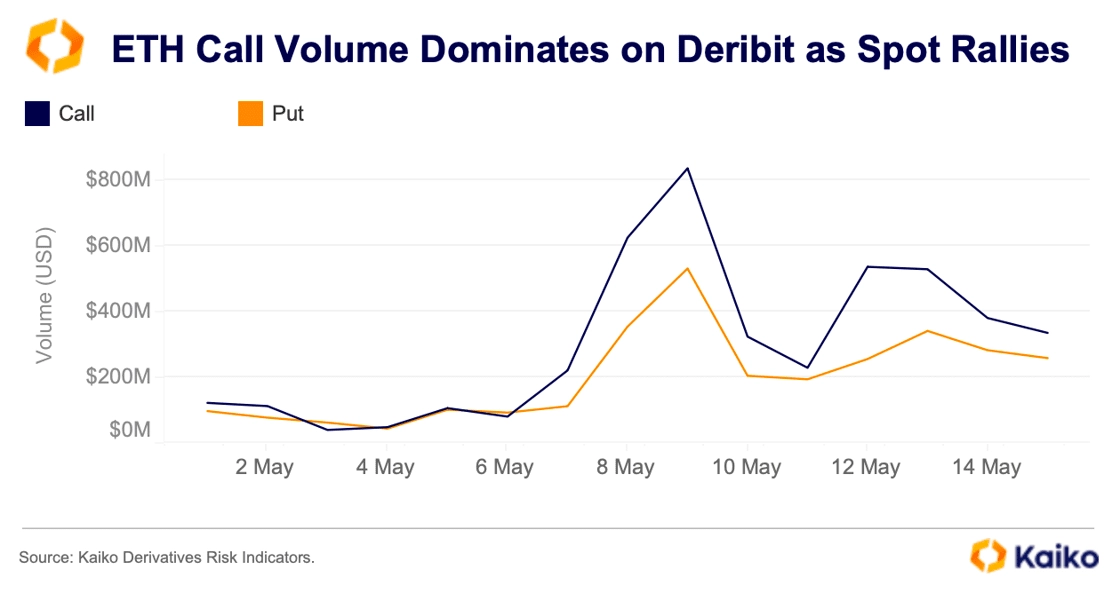
Why does this impact IV? Market participants have to adjust their positioning and hedges due to ETH’s rapid price move back above $2.5K. This increased demand pushes the price of options higher, directly impacting IV and leading to the inversion we see above. Options trade volume data reinforces this, as calls have dominated puts for ETH options on Deribit for near-term expiries.
BTC Liquidity on US exchanges hits record highs.
Bitcoin liquidity on U.S.-based exchanges reached a new all-time high of $290 million in early May, reflecting a steady rise in 1% market depth, both in BTC terms and USD, since the start of the year.
While the sharpest increase came from Bullish, which saw a notable surge in BTC depth beginning in April, Coinbase and Kraken also posted significant gains. This trend reinforces the view of improving liquidity conditions across the board.
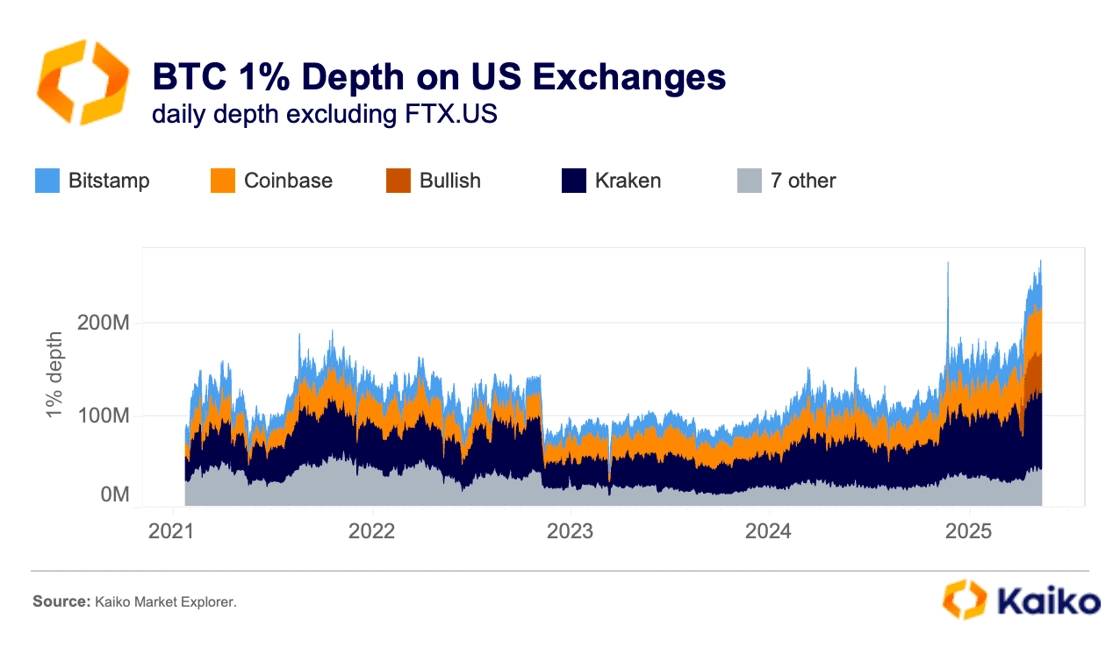
This marks a definitive closure of the so-called “Alameda gap,” a liquidity gap that emerged following the collapse of FTX and its affiliated market maker, Alameda Research. The gap, driven by a combination of shaken sentiment and the structural withdrawal of key liquidity providers, persisted for more than a year. Its resolution signals renewed confidence in Bitcoin’s market structure and the growing participation of institutional market makers.
Notably, liquidity recovery has been uneven. ETH and the top 50 altcoins continue to lag behind their 2021 liquidity highs, widening the gap between Bitcoin and the broader crypto market.
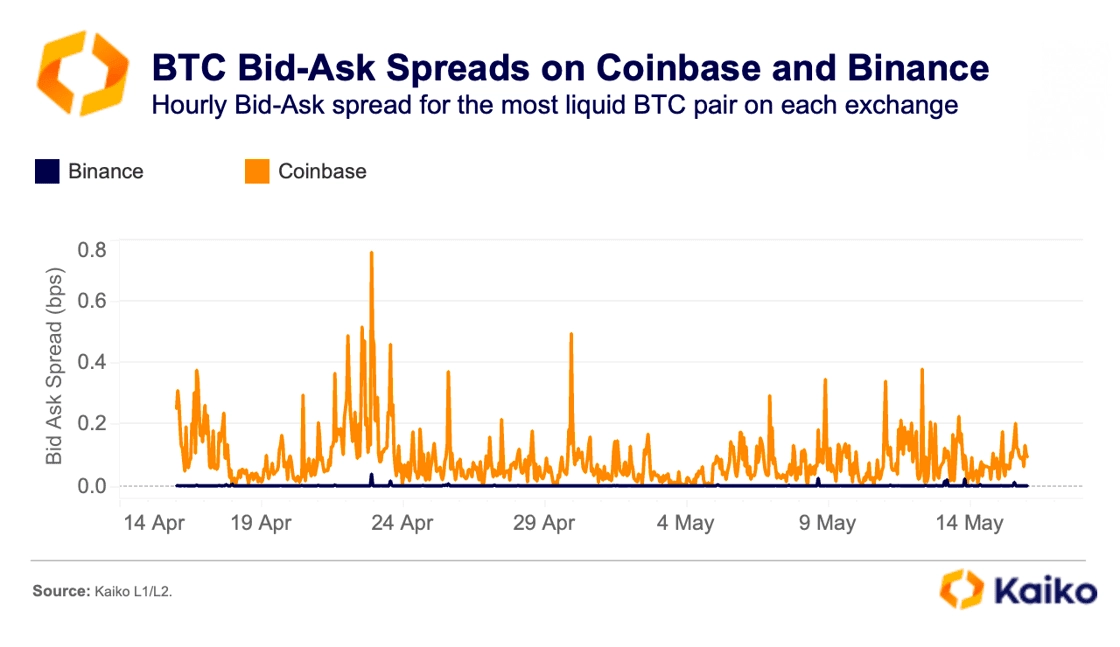
Why are BTC spreads higher on U.S. platforms?
Despite improving liquidity on U.S. exchanges, Bitcoin bid-ask spreads on offshore platforms have historically been lower. Over the past month, the average spread for BTC-USDT on Binance, the world’s largest offshore exchange, has hovered around 0.0014 bps, compared to 0.086 bps on Coinbase’s BTC-USD pair.
This suggests that while liquidity conditions in the U.S. have improved in absolute terms, the cost of executing trades remains higher due to wider spreads.
But why are spreads on offshore platforms so tight?
The bid-ask spread is often used as a proxy for market liquidity. While tighter spreads usually suggest deeper markets, they’re also heavily influenced by exchange fee structures and incentive programs.
Offshore exchanges like Binance offer a clear advantage to market makers by charging little to no maker fees, and in some cases, even providing rebates. This enables market makers to quote extremely tight spreads without incurring costs. In contrast, U.S. exchanges typically impose higher maker fees, forcing market makers to widen spreads to maintain profitability after accounting for the cost of each trade.
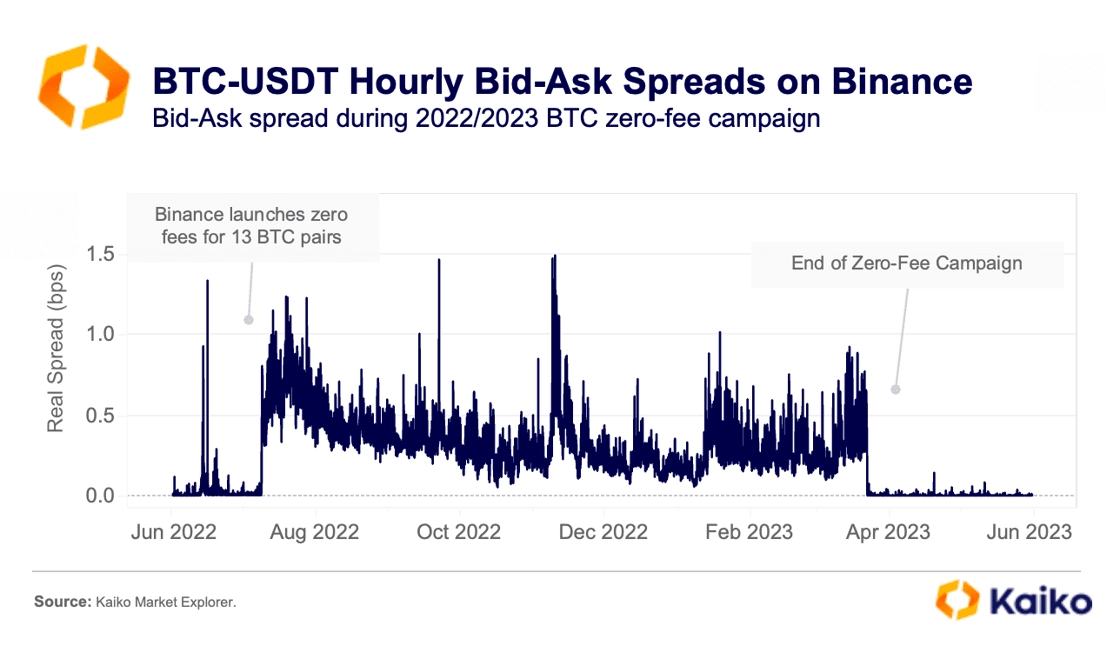
A striking example of how fees affect spreads comes from Binance’s zero-fee trading campaign for BTC-USDT between July 2022 and March 2023. Despite surging trade volumes during this period, spreads actually widened. Why? With fees removed, market makers could no longer count trades toward Binance’s VIP tier discounts, reducing their incentive to quote tightly.
To offset this, they widened spreads, essentially shifting costs to takers. When the fee program ended and normal incentives resumed, spreads tightened immediately, returning to their previous levels.