June Analyst Call: Crypto data insights and trends with our experts

Comparing Liquidity on Uniswap and Binance

Liquidity

DEX

24/08/2023

Welcome to Deep Dive!

This week we’ll take our first in-depth look at Market Depth on CEXs and on Uniswap V3 with a comparative approach. We’ll mainly focus on liquidity distribution across prices and markets, aiming to enhance our understanding of liquidity dynamics and provide you with tools to harness the potential of CEX/DEX data. In today’s trading landscape with DEXes gaining market share, knowing which exchanges or pairs offer optimal trade execution is crucial. Kaiko’s depth data makes that possible.

  • Uniswap V3 pools can be modeled as order books

  • Recent CRV-related events impaced V3 pools’ liquidity

  • Uniswap V3 offers deeper market than CEXes for major tokens

  • Uniswap V3 pools’ depth structure differs from CEXs due to entry/exit costs

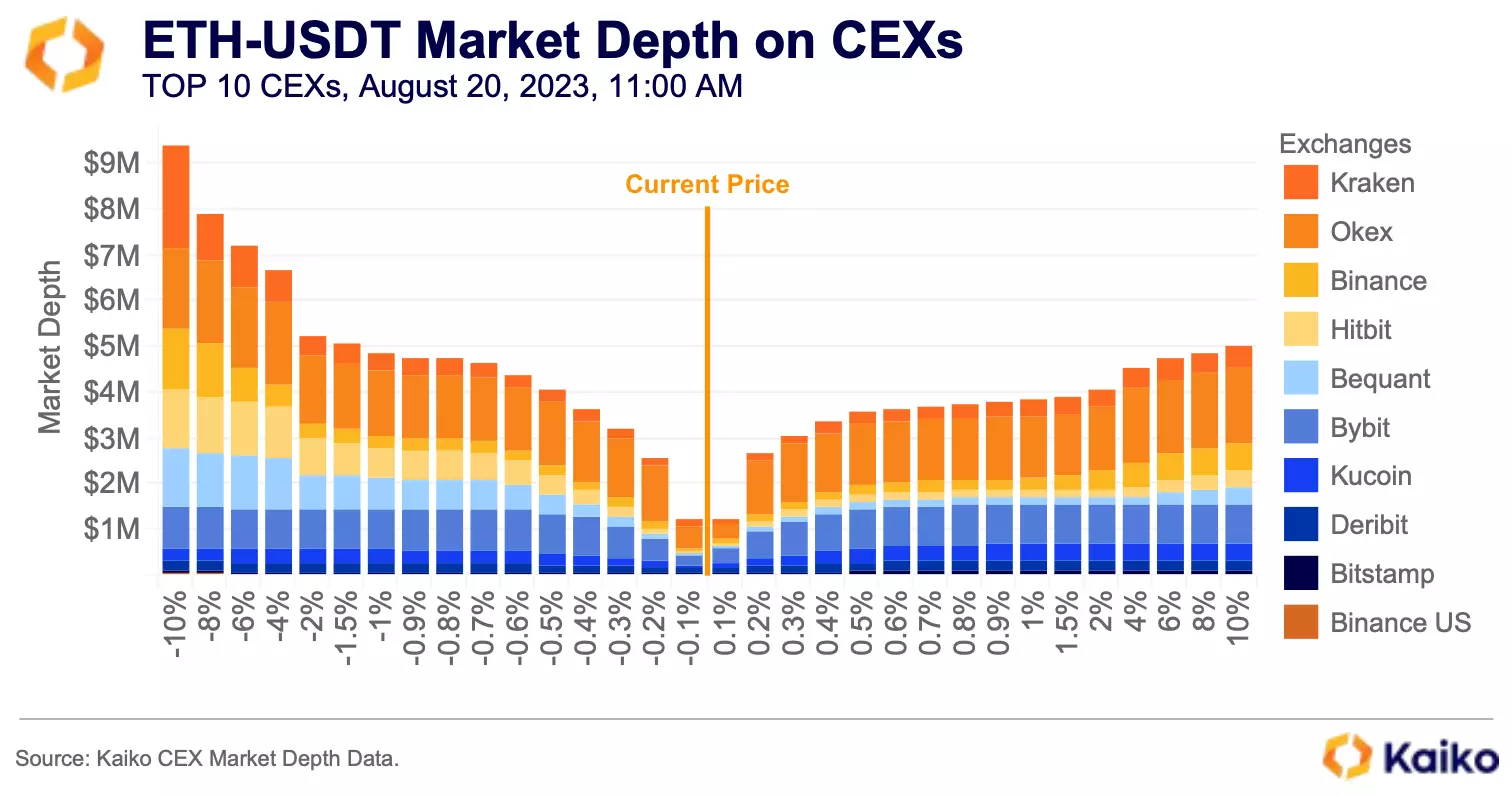
Market depth is a widely used measure of liquidity, commonly calculated across the order books of cryptocurrency pairs on centralized exchanges (CEXes). It provides the amount of bids and asks at varying distances from the mid-price, encompassing a range from -0.1% to 10%.

This chart shows cumulative ETH-USDT bid and ask volumes at various levels on the ten largest CEXes. Each exchange’s orderbook at each point in time possesses its own liquidity profile, empowering traders to choose the most suitable platform based on their execution strategy.

Overall, a deeper market means higher liquidity, making it easier to buy or sell assets close to the desired price. It also helps traders better estimate the slippage that larger orders may incur. A larger market depth corresponds to lower slippage, meaning the market can accommodate larger trades without significantly shifting the market price.

computing market depth for uniswap v3 pools

However, simply looking at CEXs liquidity isn’t enough, as DEXes account for a substantial portion of trading volume for some tokens. For instance, on August 20, Ethereum DEXes accounted for 25% of USDC’s trading volume and over 80% of DAI’s. But finding where liquidity is in crypto markets is complex due to differing price discovery mechanisms between DEXes and CEXes.

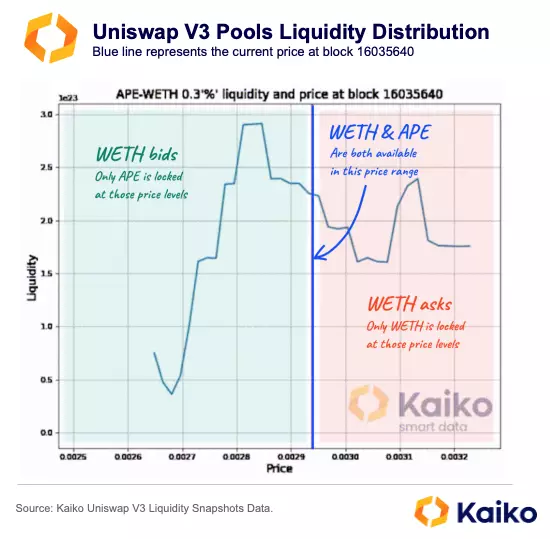
Most DEXes do not use order books, instead using Automated Market Makers (AMMs). AMMs determine asset prices by assessing the quantity of each asset within individual liquidity pools across various price levels. These pools acquire tokens from liquidity providers (LPs), allowing traders to directly trade these assets. Although most AMM-based DEXes don’t provide order books, certain liquidity pools, like Uniswap V3’s, which specifically rely on what we call concentrated product AMMs, can be modeled as order books because LPs deposit tokens in certain price bands. We can see an example in the wETH-APE 0.3% pool below.

To ensure that all crypto markets have accessible and comparable liquidity data, Kaiko offers users all the data and tools needed to compare market depth across CEXes and DEXes.

Taking a closer look at Uniswap V3 Market Depth: we calculate it at an alpha level (a percentage from the block’s current price) for a specific Uniswap V3 pool and block. Using Kaiko’s Uniswap V3 liquidity snapshot data, we track liquidity, including token amounts available in each of the different price ranges liquidity providers have initialized. Uniswap V3’s equations are then applied to find out how many tokens can be swapped before the price shifts by 1 + alpha. Alpha can range from -/+0.1% to +20% compared to the market price.

Never Miss a Deep Dive.

comparing cex and uniswap v3 depth

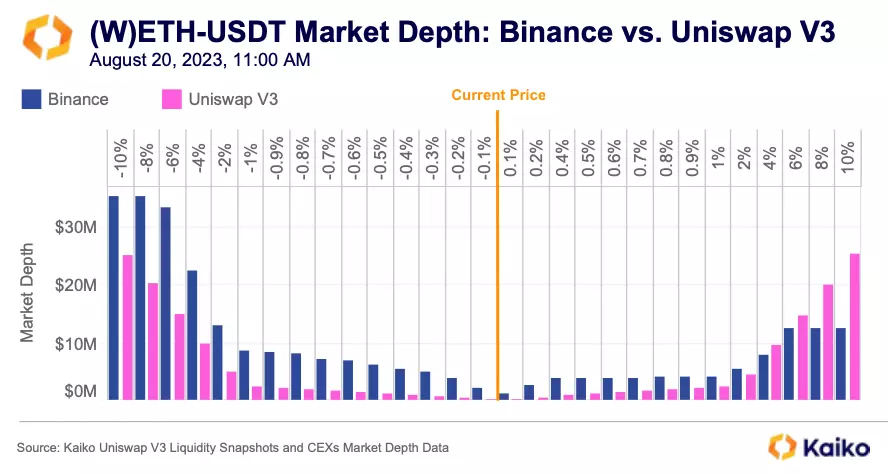
With that out of the way, let’s take a look at market depth for one of crypto’s most liquid pairs, the (w)ETH-USDT pair on Binance and on Uniswap V3.

Uniswap V3’s wETH-USDT 0.3% fee pool is less liquid than Binance across most price levels, with Binance having over four times Uniswap’s liquidity at certain price levels. However, Uniswap does have more liquidity at some price levels further away from the mid price. It’s important to note that this is just one of Uniswap V3’s wETH-USDT pools, there are two others with different fee levels; if you were to combine these pools’ liquidity they would be slightly less liquid than Binance immediately around the mid price and much more liquid further from the mid price.

Overall, Uniswap V3’s liquidity distribution is surprisingly symmetrical, which suggests that the liquidity is spread widely enough to efficiently capture most, if not all, price variations, especially considering the high cost of adding or removing liquidity from Uniswap V3 liquidity pools.

exchange market depth breakdown

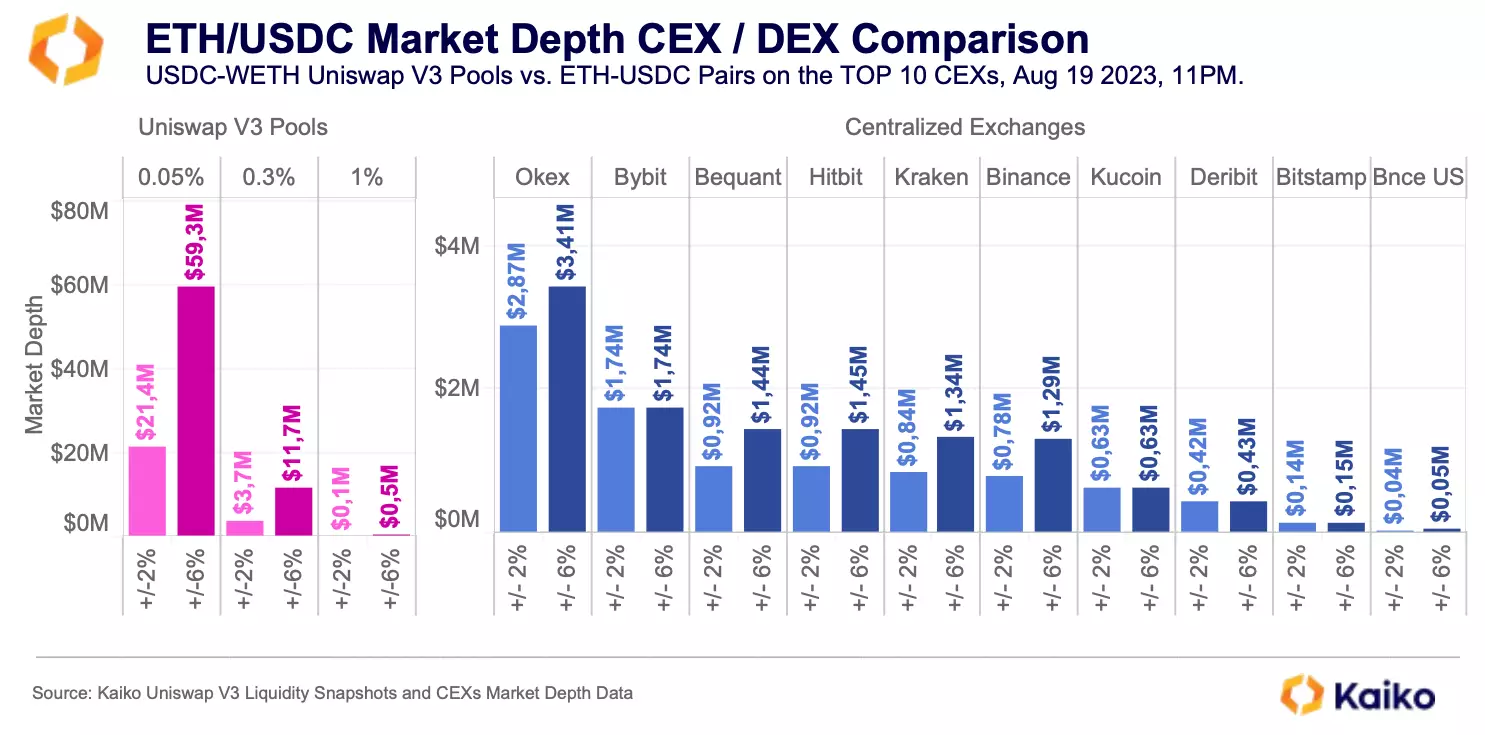
Although Uniswap V3 loses in the liquidity competition with Binance for the (w)ETH-USDT pair, it emerges victorious against all major CEXs in the (W)ETH-(W)BTC market. Its 0.3% and 0.05% fee pools for this pair offer 6 and 3 times more liquidity, respectively, for prices within 0 and 6% of the market price.

Considering the popularity of wETH and wBTC as base and quote assets on Uniswap, these findings come as no surprise. These markets offer efficient paths for transactions; for example, swapping wBTC for an altcoin would likely travel through this pair. So, it’s logical for liquidity to focus here.

In total, there are over 13k pools on Uniswap V3. Out of these:

  • About 1,500 pools use wETH as either the base or quote asset, making up approximately 11% of the total pools. 
  • Over 500 pools include USDC, constituting around 4.50% of the total. 
  • About 100 pools include wBTC, accounting for roughly 0.75% of the total pools.

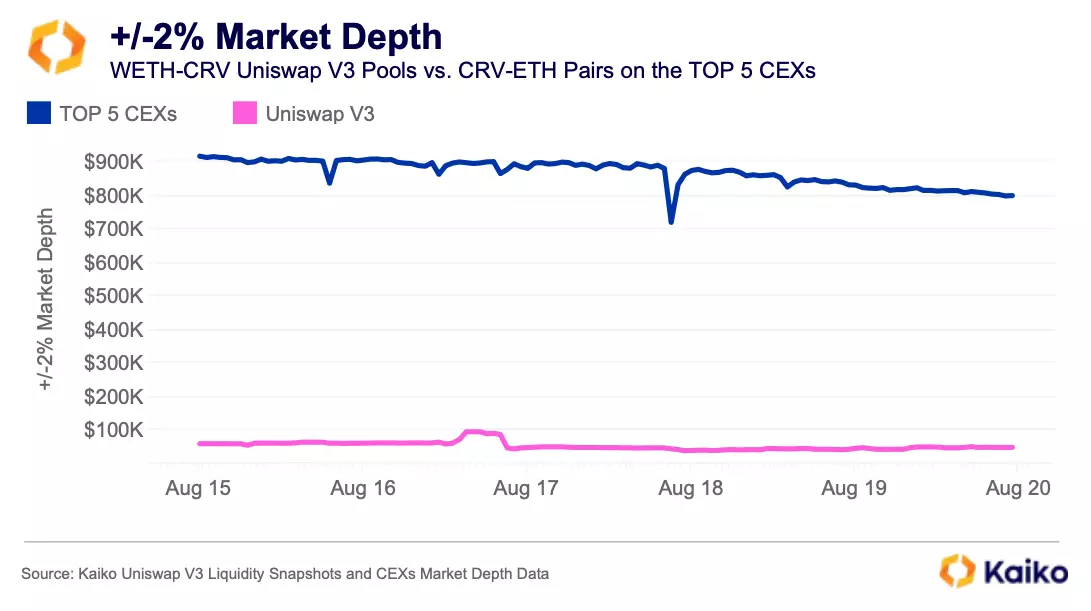
Surprisingly, for smaller tokens like CRV, Uniswap seems to have less liquidity compared to the top 5 most liquid CEXs that offer the CRV-(W)ETH market.

Considering recent challenges faced by the CRV token, it’s expected to see these markets with limited liquidity. In March 2023, CRV’s trading mostly occurred on DEXes during stress periods. CRV holders were uncertain due to the token’s usage by Curve’s founder, namely his CRV-collateralized loans on platforms like Aave. Since then, an exploit of some Curve pools added to the uncertainty, reducing the motivation for users to provide liquidity and potentially absorb toxic flow.

most liquid uniswap v3 pools

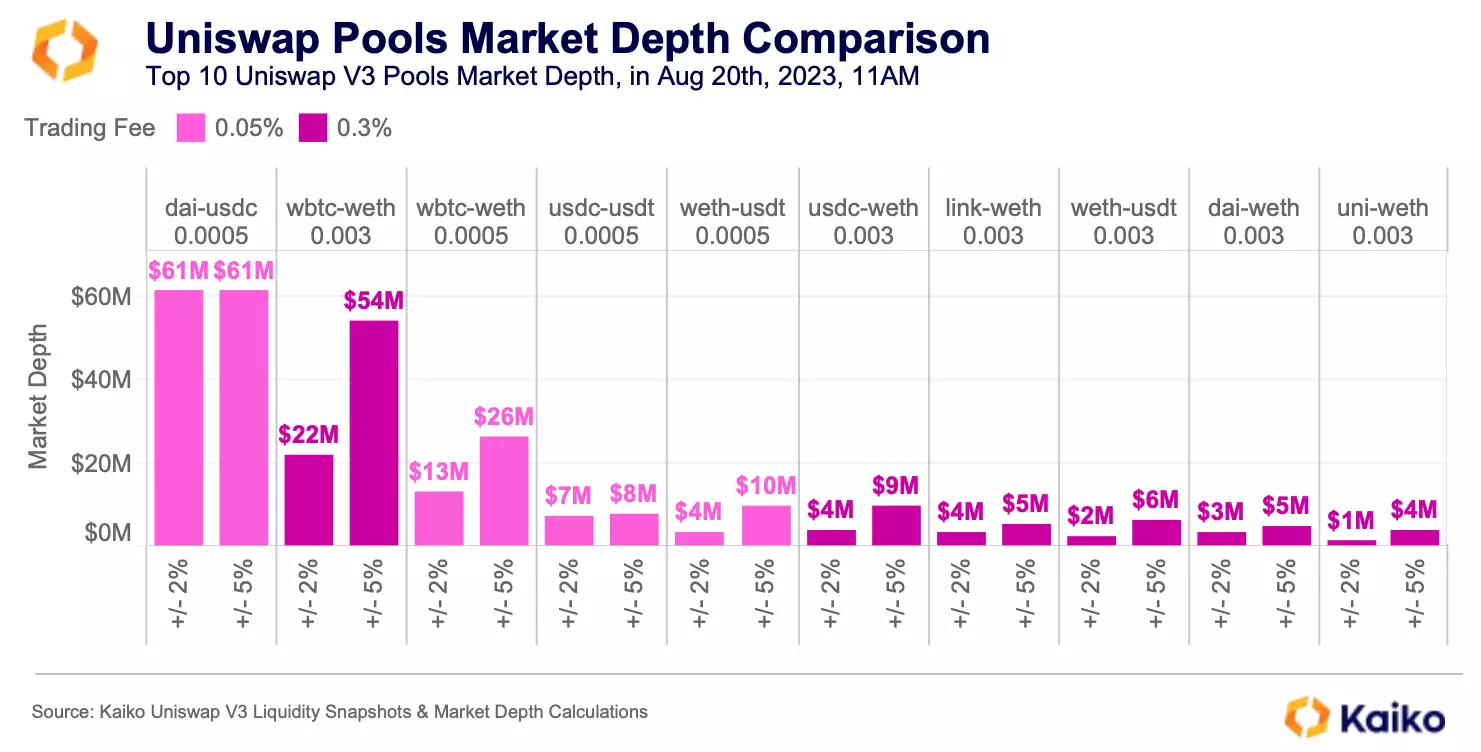
Taking a broader look at Uniswap V3 liquidity shows that four out of the top five most liquid Uniswap V3 pools have a 0.05% trading fee, the second lowest option on Uniswap. It seems that LPs have arrived at an equilibrium in which they’ve found that 0.05% provides the best balance between trading volumes and fees.

Uniswap V3 provides competitive markets for traders compared to CEXes; these are particularly appealing to arbitrageurs due to ample liquidity available at varying price levels, though trading costs can vary. This CEX/DEX standardized market depth dataset not only helps us understand the impact of recent market events on liquidity but also reveals the role of market microstructure in shaping liquidity dynamics.

Data Used In This Analysis

  • DeFi Data

    Block-by-block liquidity snapshots of DEX pools

  • Order Book Data

    Market depth data from centralized exchanges

More From Kaiko Research