Trend of the Week
BTC Rally Tracks Softer USD.
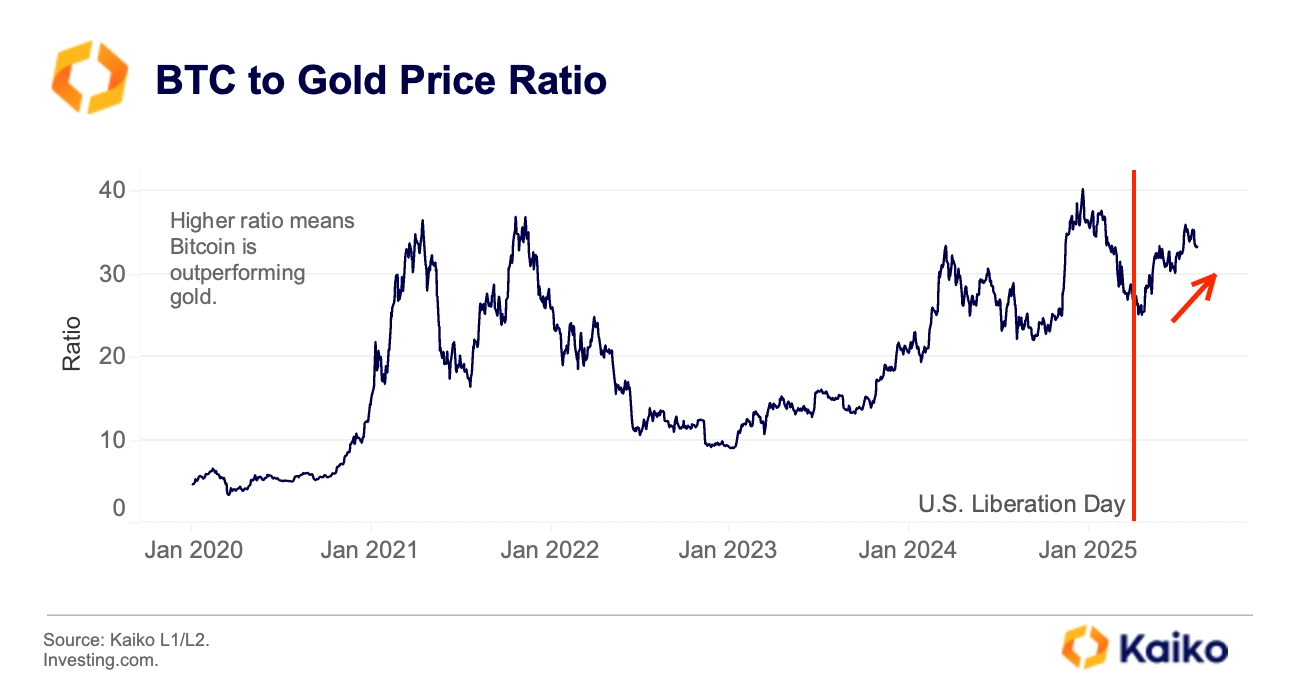
U.S. dollar weakness has been a clear tailwind for BTC in 2025. Year-to-date, BTC is up 26% against the USD, compared with 19% versus the KRW and roughly 10-12% against the BRL, MXN, CHF, and EUR. The divergence widened after April’s “Liberation Day” tariff announcement, which knocked the DXY roughly 5-6% lower from early April levels and catalyzed flows into alternative assets, notably Bitcoin and gold.
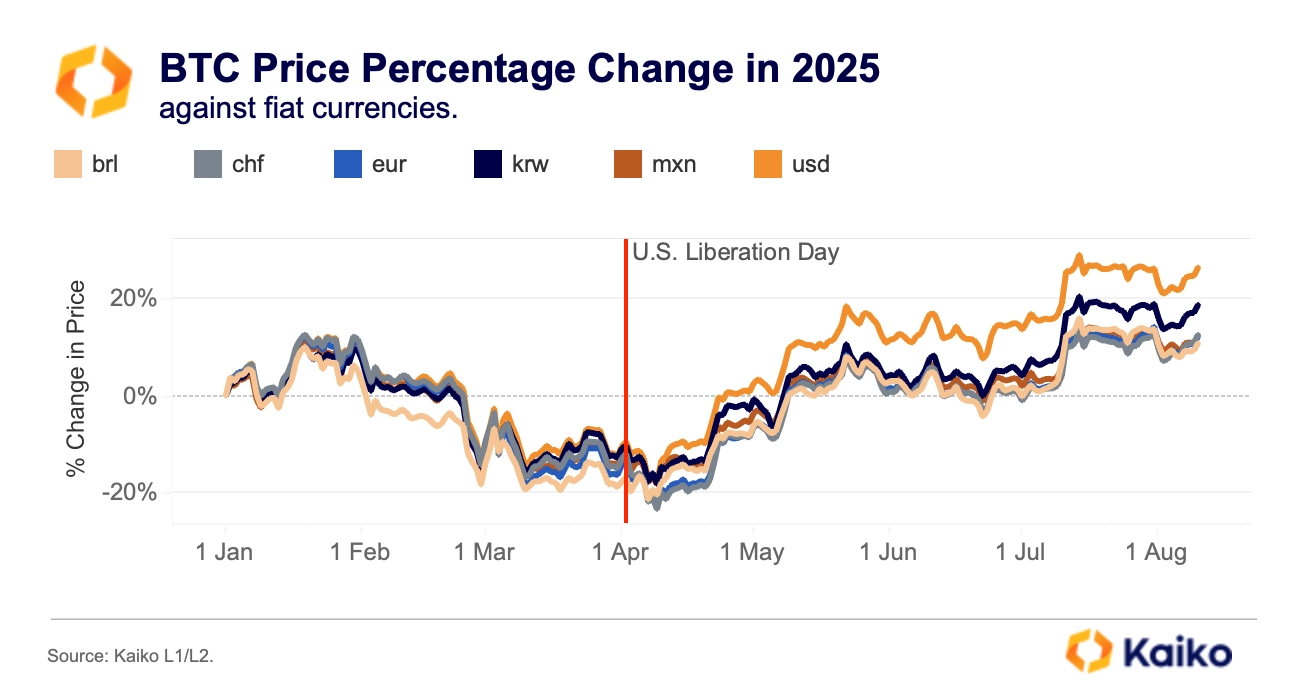
This is not surprising as more than 90% of global crypto volume is denominated in USD or USD-backed stablecoins. A softer dollar tends to support BTC/USD by boosting non‑USD purchasing power and risk appetite, amplifying upside moves.
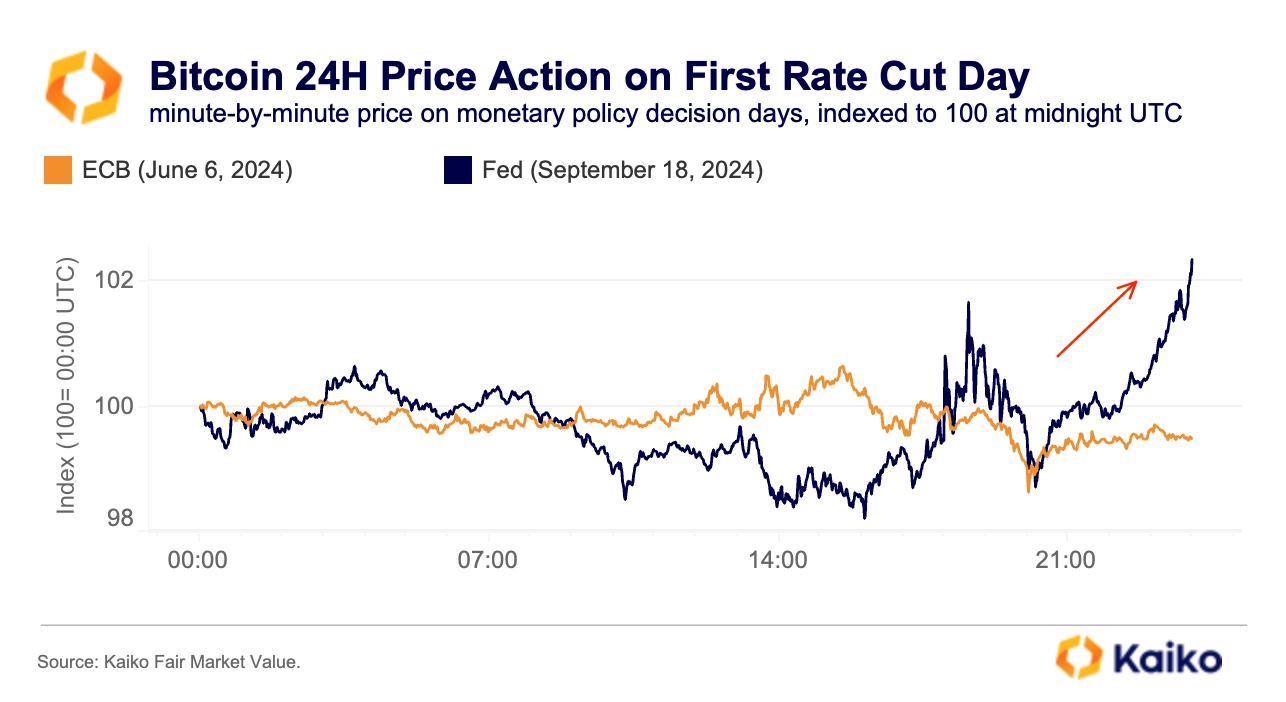
BTC remains highly sensitive to U.S. monetary policy. After the Fed’s surprise 50 bp cut in September 2024, BTC rose about 2% in the following hours on a surge in net spot buying. By contrast, around recent ECB cuts, BTC traded slightly lower, suggesting U.S. policy retains an outsized influence on crypto pricing.
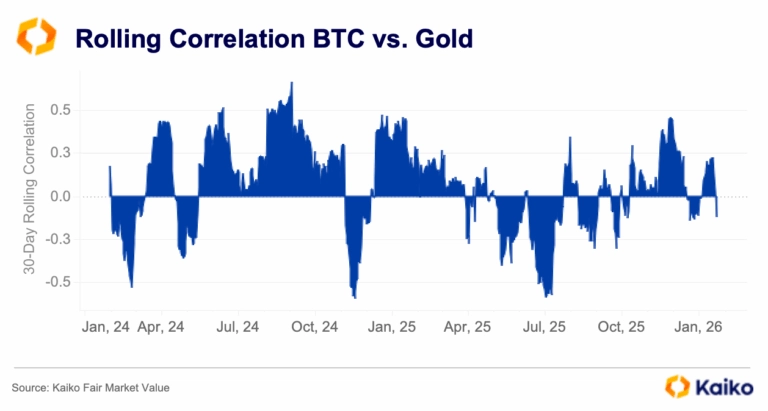
But dollar weakness doesn’t tell the whole story. Bitcoin has also outperformed gold since April. The BTC-to-gold ratio hit multi-month highs this summer, and U.S. Bitcoin ETF flows have approached those of major gold ETFs in recent months. Risk-adjusted returns for Bitcoin have outpaced both gold and equities, as volatility tumbled, reinforcing its profile as a maturing institutional asset.
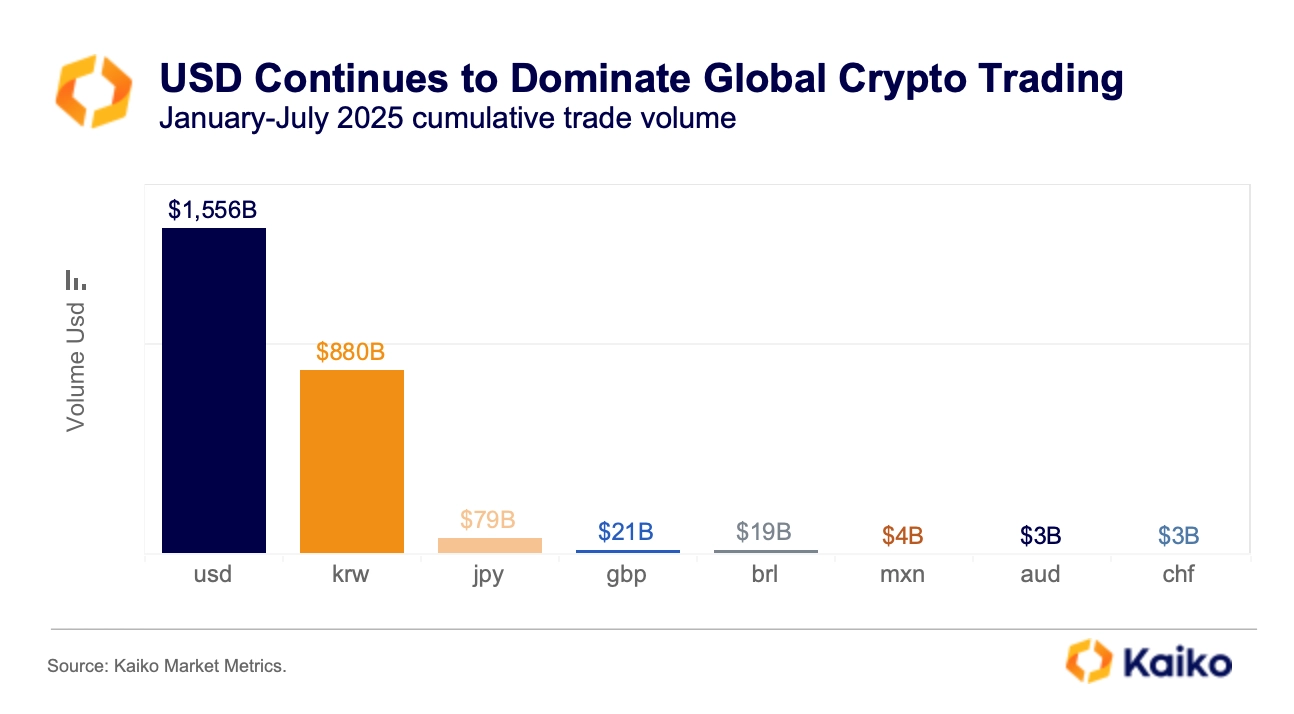
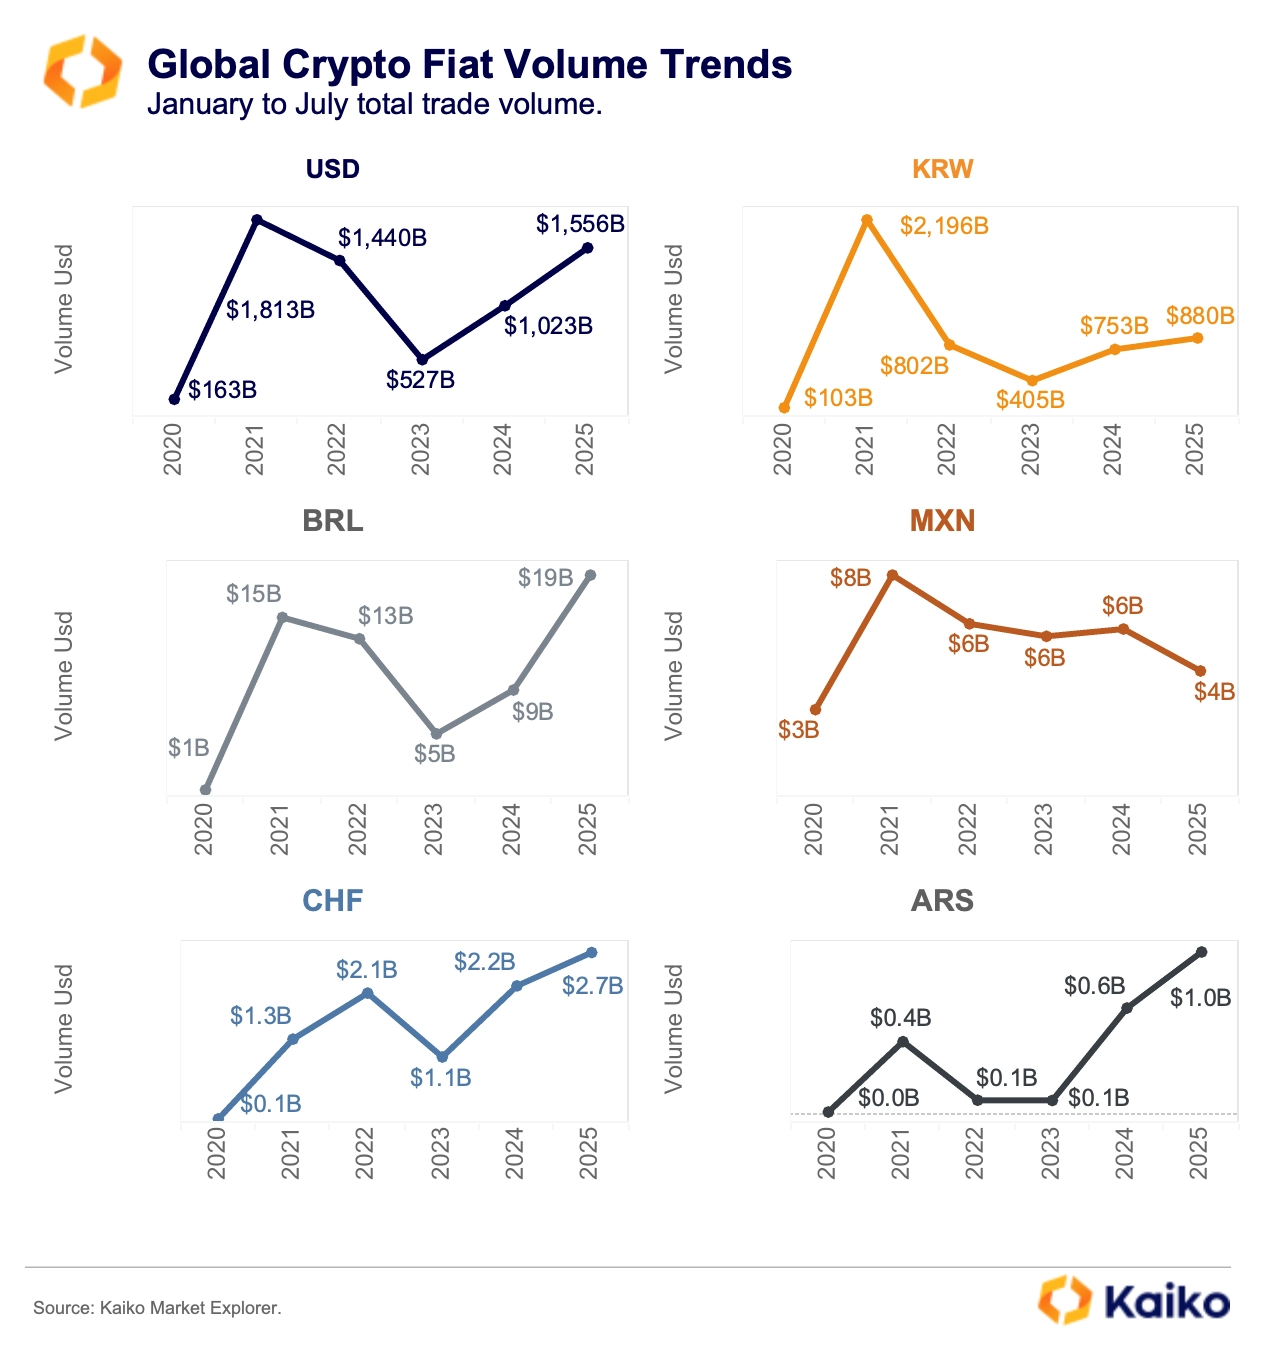
Additionally, regional crypto markets are diverging under the weight of local regulation, market structure, and shifting domestic demand. USD pairs continue to concentrate global liquidity, with USD‑denominated transactions reaching a record $1.56 trillion between January and July 2025. By comparison, KRW remains the second‑largest fiat market at $880 billion over the same period, up 17% year over year. Yet the gap with USD has widened to its largest since 2020, signaling relative underperformance despite absolute growth.
A major reason for Korea’s relative underperformance is regulatory friction. Korean exchanges operating in KRW face unclear rules and the “one-bank rule,” which restricts partnerships and complicates global onboarding. These constraints have made overseas expansion a distant goal for Korean crypto platforms, even as domestic demand remains strong. Meanwhile, Brazil’s BRL trading volume reached its highest level since 2021, outpacing regional peers like the Mexican peso. Brazil’s leadership in LATAM is anchored by a deep financial sector and a track record of innovation. Its B3 exchange launched the region’s first spot BTC and ETH ETFs ahead of the U.S. and has since approved several altcoin spot ETFs.
Smaller markets are also gaining momentum. Argentina and Switzerland both posted record-high trading activity in 2025. Switzerland’s growth reflects its established crypto banking infrastructure, while Argentina’s surge comes amid macro challenges. Notably, despite a recent improvement in macro fundamentals and an IMF deal easing FX restrictions, crypto demand remains structurally strong.
Data Points
Stablecoin Liquidity Deepens.
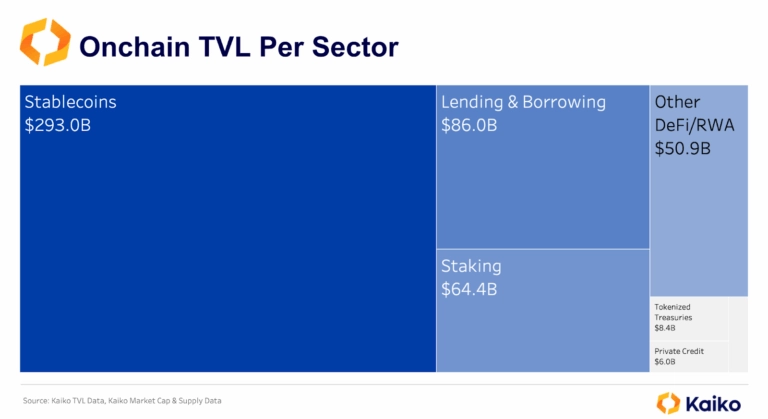
The 2% market depth for trading pairs where the base asset is a stablecoin has climbed above $1.2 billion, signaling that more market‑making capital is flowing into these markets. USDC is doing most of the heavy lifting. Its 2% depth has roughly doubled in recent months to about $544 million, tightening spreads and potentially lifting executable size across the book.
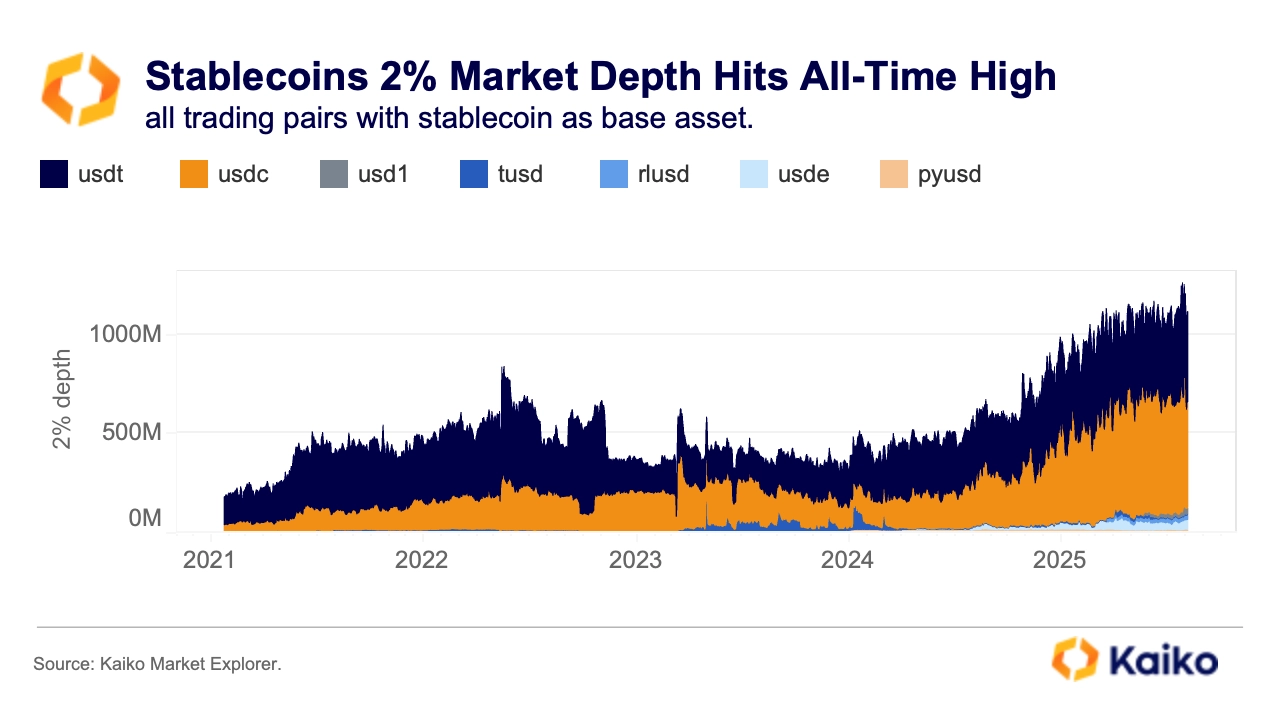
This build‑out in liquidity matters because the combination of high velocity and deep liquidity gives stablecoins an edge over fiat rails, especially in markets where access to hard currency is limited or parallel‑market rates are elevated. In many such countries, stablecoins command a “liquidity premium” over local fiat. It is often cheaper and easier to exchange stablecoins for domestic currency than to convert fiat‑to‑fiat.
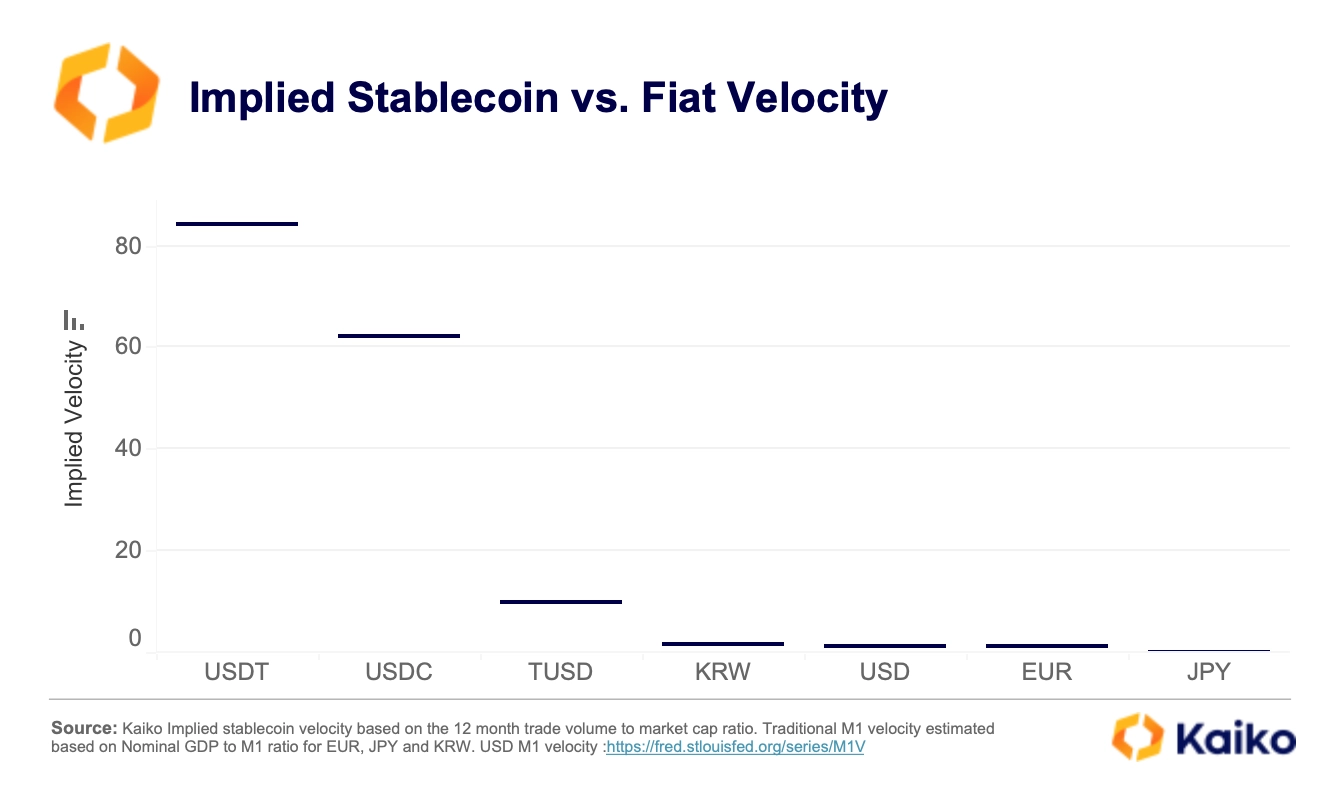
Stablecoin velocity typically ranges between 50 and 80, far above the 1–2 range for major fiat currencies and roughly 1.6 for the U.S. dollar. Implied stablecoin velocity is defined as annual spot trading volume divided by current circulating market cap. The higher the velocity, the more frequently supply turns over on exchanges and the more intensively the asset circulates within the crypto economy.
XRP 1% Depth on U.S. Crypto Exchanges Hits All-Time High.
XRP liquidity on U.S. crypto exchanges hit a record last week, with 1 percent market depth of around $116 million. The milestone follows the formal closure of the SEC case first brought in 2020, with both parties dropping their appeals on August 7. The move caps a steady onshoring trend since early 2024 as U.S. market makers rebuilt exposure. Price action was more restrained, with XRP rebounding but still below July highs and volumes rising only moderately, suggesting the legal endgame was largely priced in.
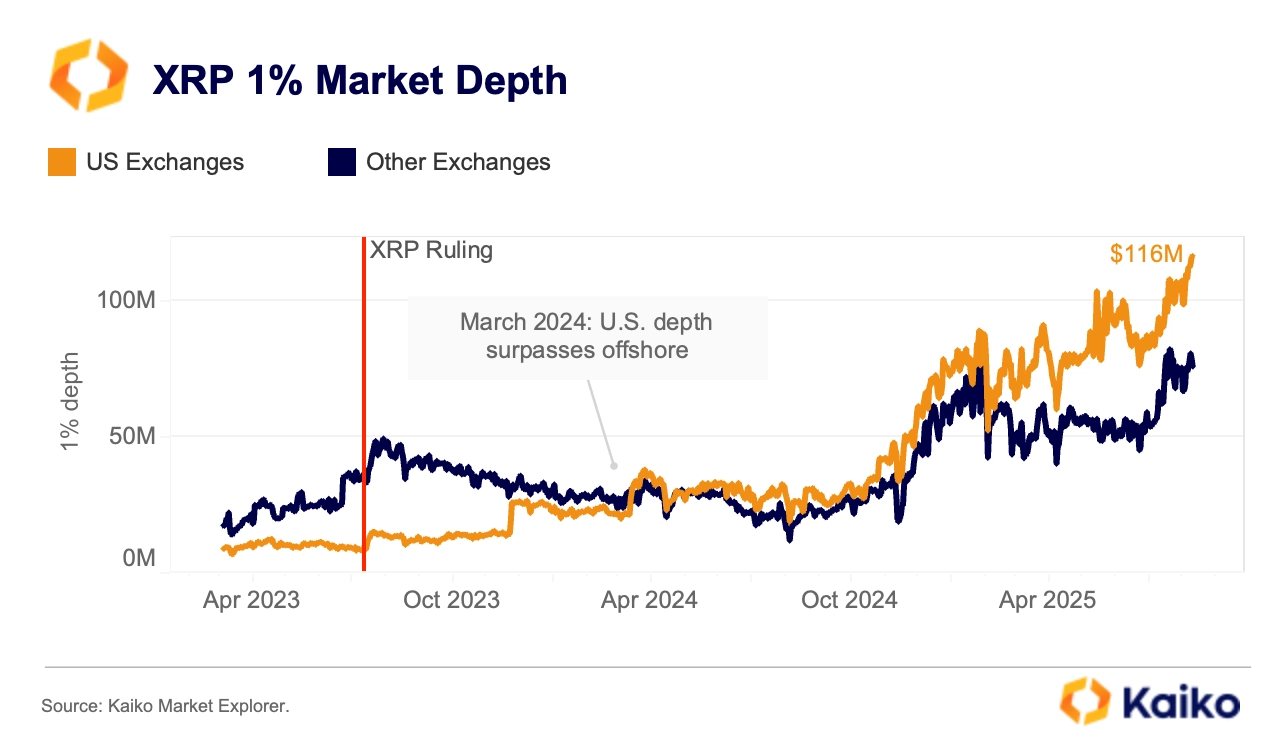
The resolution removes a major overhang and improves XRP’s investability for regulated counterparties. Deeper onshore order books typically mean tighter spreads and lower execution costs, which can help sustain institutional flows. Strong U.S.-led depth is also a key building block for any potential approval of a spot ETF product.


![]()
![]()
![]()
![]()


