The chart below uses Kaiko’s Asset Liquidity Metrics to aggregate the market depth for all spot instruments related to the top 25 tokens, not including stablecoins (i.e., SOL-USDT and ADA-GBP are included, USDC-USDT is not).
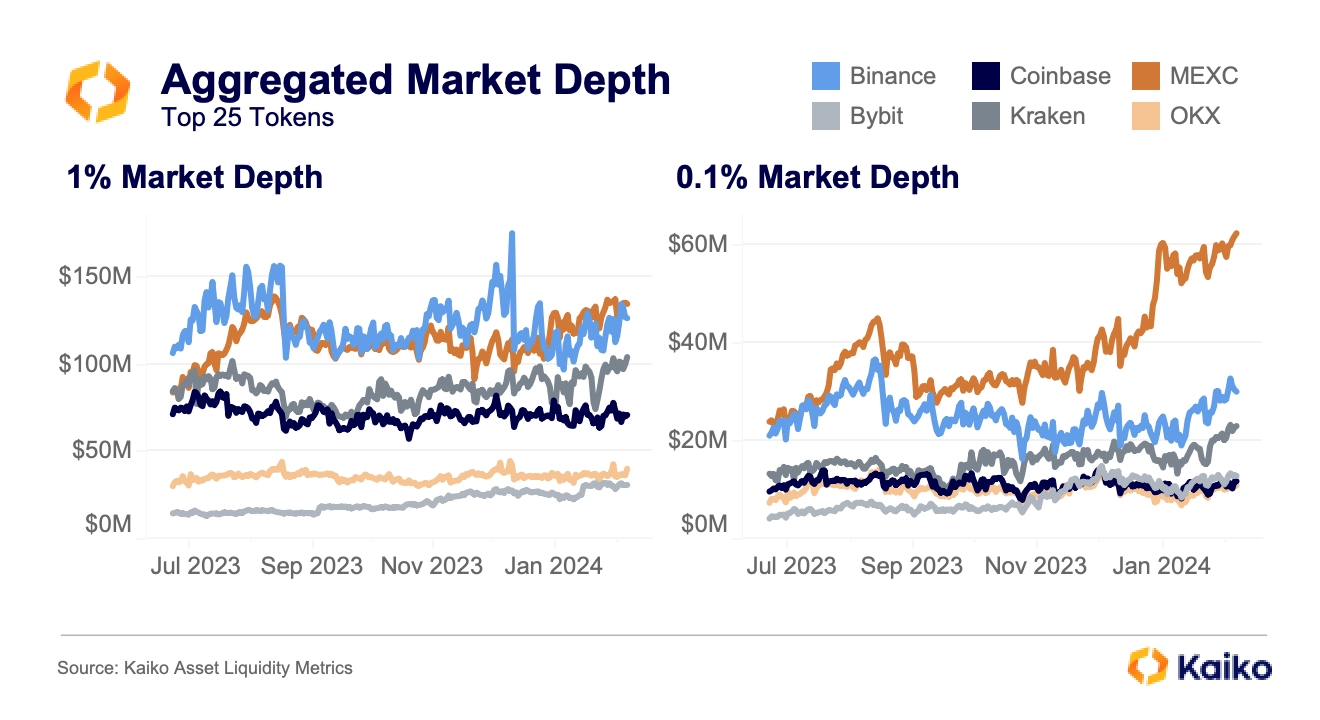
MEXC is immediately identifiable, touting the same 1% market depth as Binance and more than double Binance’s 0.1% market depth. At a time when liquidity is at a premium, MEXC has apparently doubled its near-mid-price depth in just three months.
To put a finer point on it, the monthly average 0.1% market depth for altcoins shows how the gap has widened between Binance and MEXC.
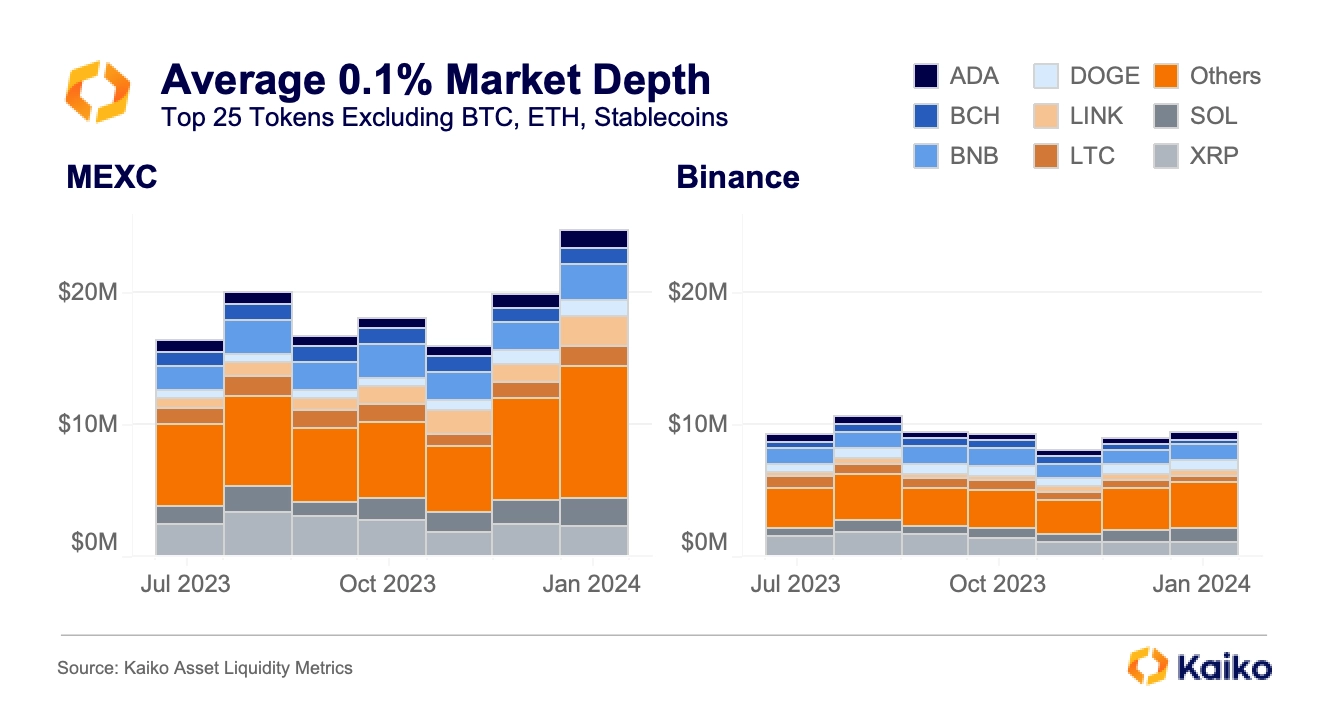
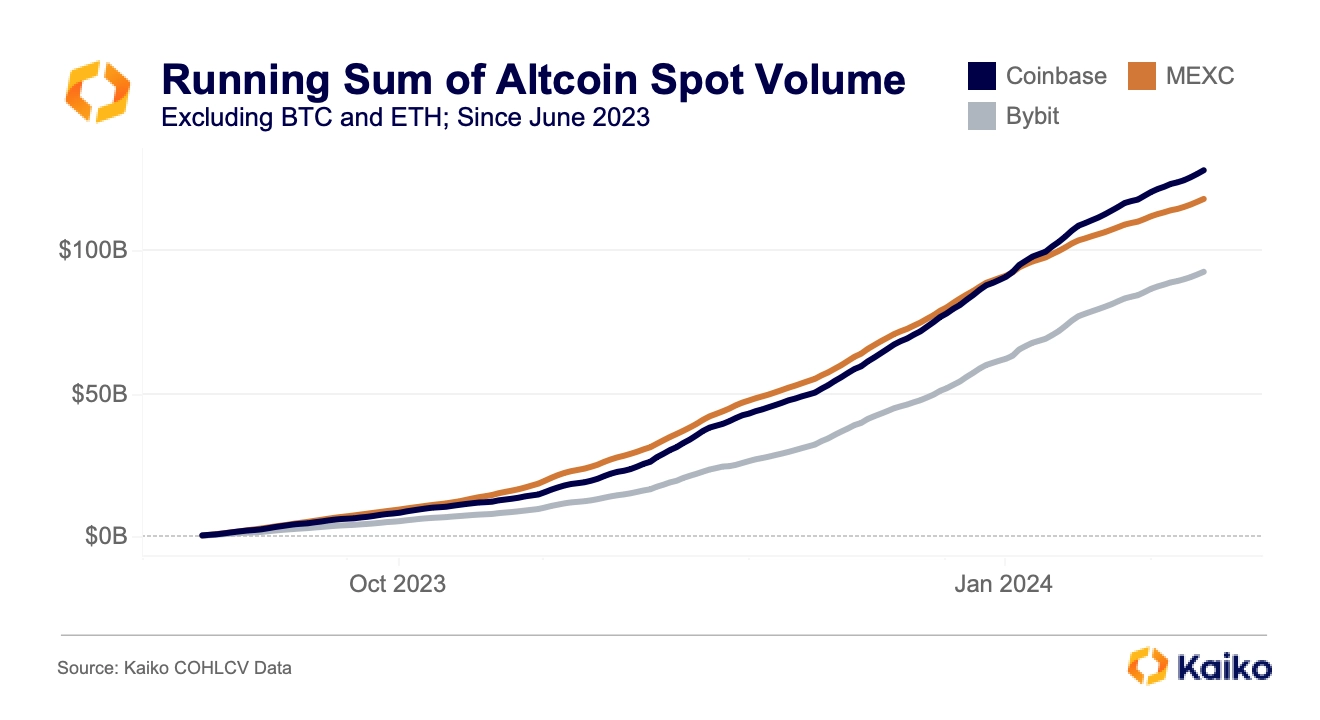
According to this data, BNB is nearly three times deeper on MEXC than on Binance. But is all this liquidity even necessary? Binance does so much more volume than MEXC that I couldn’t include it on the running sum chart above because it would have thrown the y-axis too much. MEXC has done just over $100bn in volume since September, while Binance is approaching $900bn.
To better illustrate just how bizarre these figures are, we can dust off the market depth to volume ratio, essentially showing how much liquidity there is for an asset relative to its volume. Higher values show more liquidity/less volume and vice versa. It’s also important to note the different y-axes.
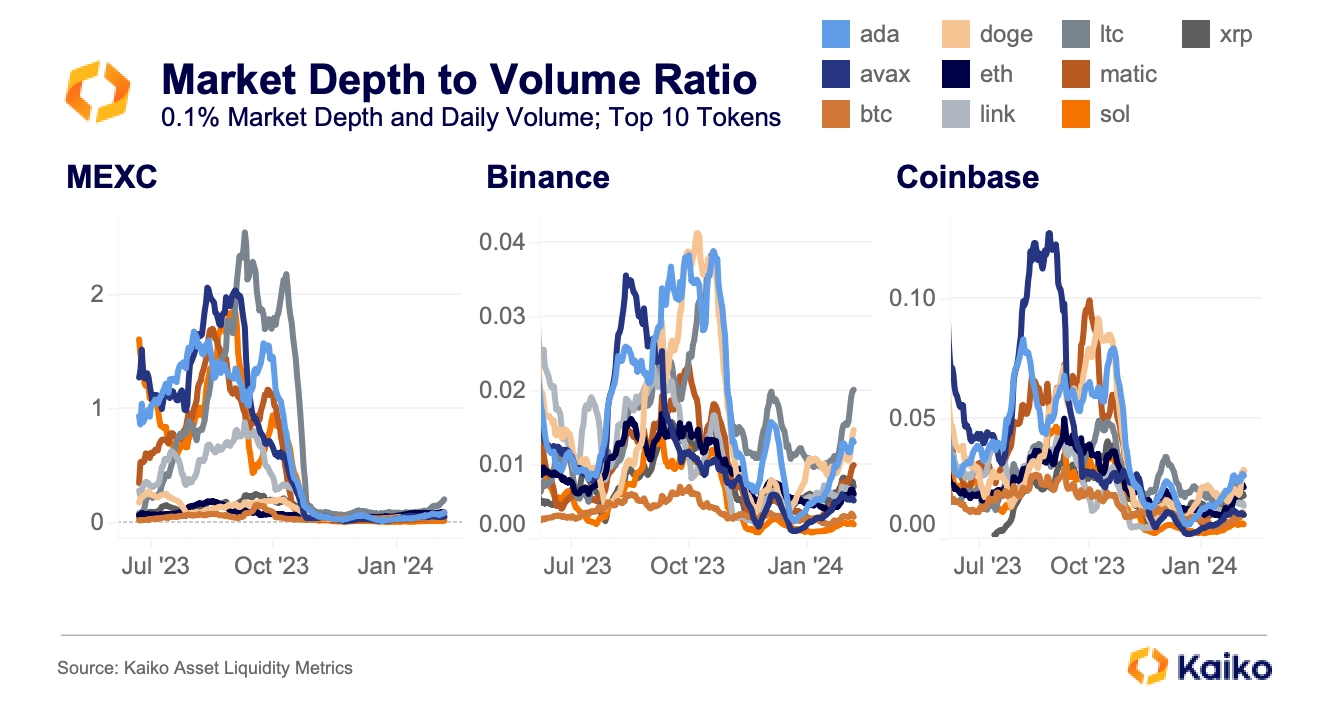
MEXC is nowhere close to Binance or Coinbase. During the summer doldrums, many of its top tokens sat with a ratio of over 1 for months, unheard of on other exchanges. Binance never topped 0.04, while Coinbase touched 0.15. When volumes picked up, MEXC’s ratios quickly dropped, though they are still much higher than on any other exchange. Its median ratio since September 2023 is 0.22, more than double Kraken in second [1].
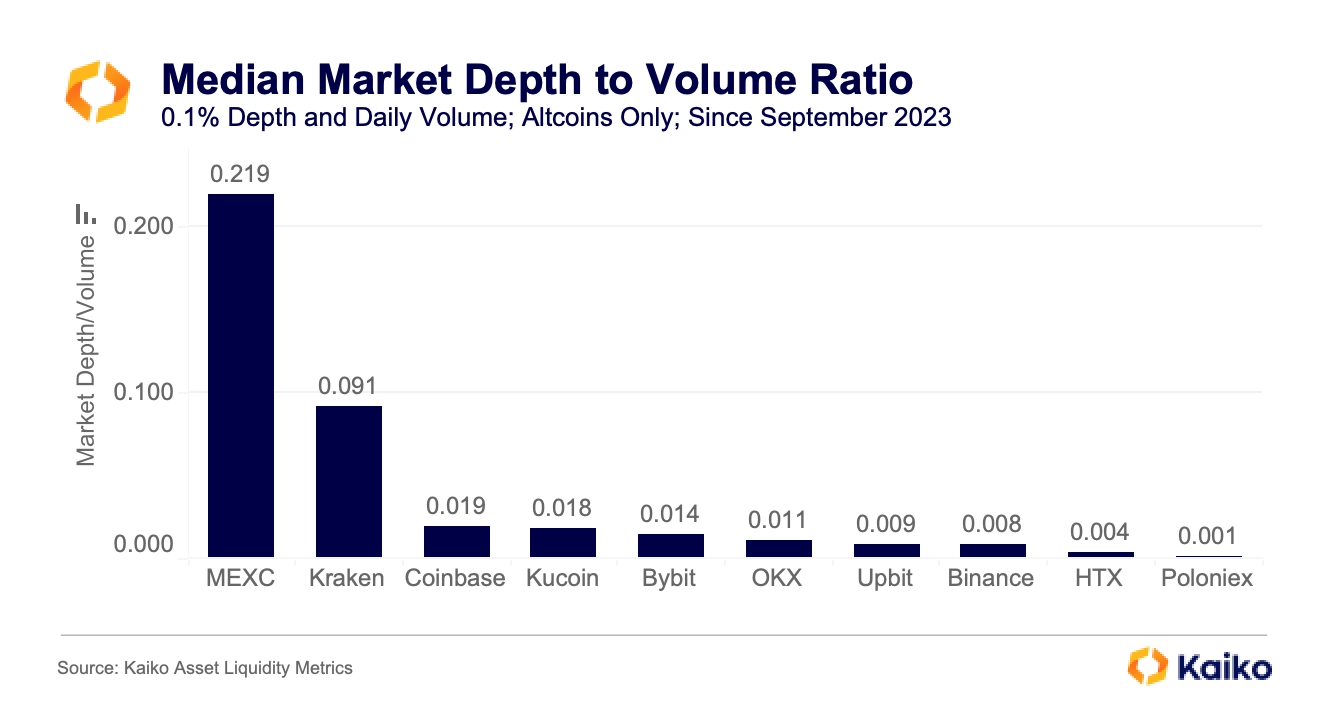
Coinbase, Kucoin, and Bybit are the next tier, followed by OKX, Upbit, and Binance. HTX and Poloniex – two exchanges on which we have already identified suspicious trading – clock in at absurd readings of 0.004 and 0.001, respectively.
When investigating MEXC further, I came across some patterns that look familiar. The chart below shows every UNI trade on Bybit (to serve as an example) and MEXC on January 31, 2024 with a logarithmic y-axis to better show small trades.
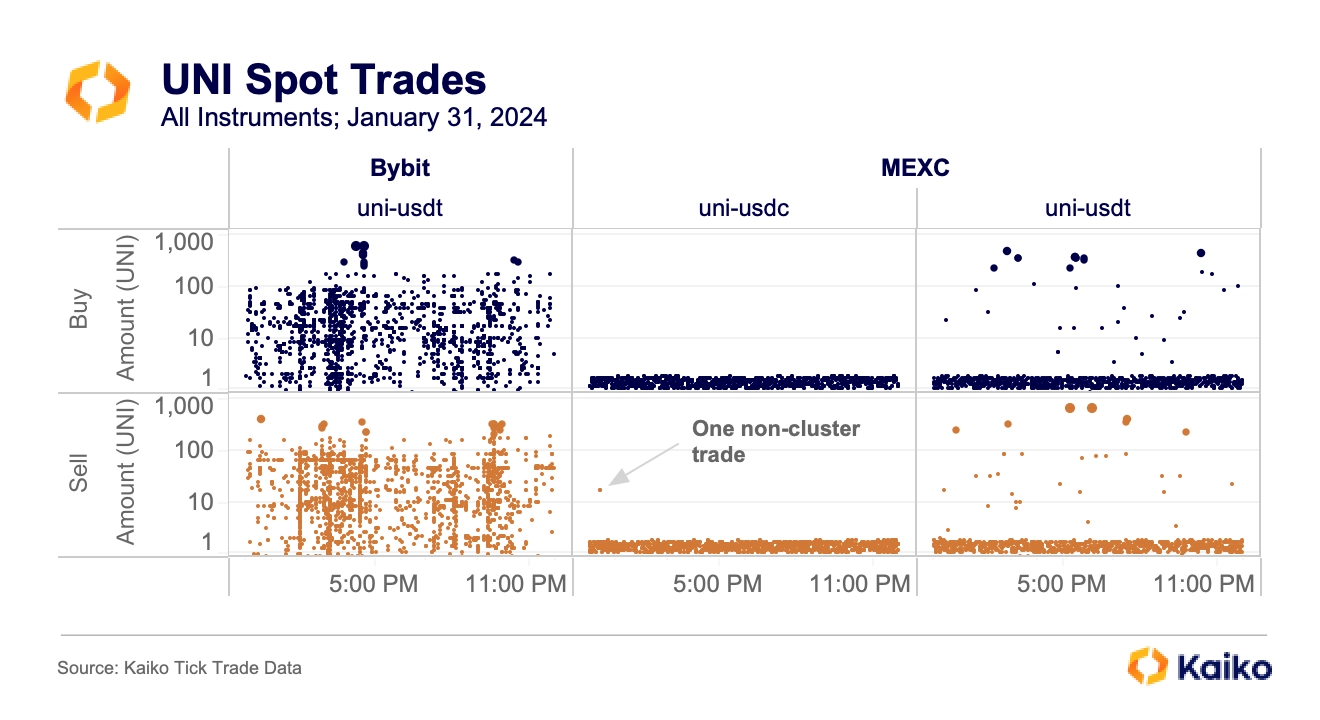
The pattern on MEXC is instantly clear, with the size of nearly every single trade on both pairs between 1.1 UNI and 1.9 UNI. These “cluster” trades represented 98.5% of MEXC’s UNI-USDT trades and 20% of volume. On the UNI-USDC instrument, there was only a single non-cluster trade the entire day. As expected, the volume of cluster buys and sells was nearly identical. In total, cluster trades represented 40% of volume. A similar pattern was observed on a variety of instruments. For example, since the start of February just 3% – 1,500 out of 47,000 – of trades on the BNB-USDC instrument have been non-cluster trades.
conclusion
For months, MEXC has been the most unusual exchange in our coverage [2]. While its market share grew, its liquidity told an amplified version of this story. In the past, we’ve seen exchanges juice the 2% market depth metric, which is featured prominently on sites like CoinGecko and CoinMarketCap. But MEXC is actually more dominant closer to the mid price, and has tight, though volatile, spreads to match. The exchange’s 0% spot maker and taker fees and lax KYC also mean that the suspicious volume patterns could, in theory, be coming from any entity. Even if there are market makers happy to collect the spread on these small, predictable trades, there is still no reason for there to be so much liquidity. Regardless of wherever the volume and liquidity is coming from – though I lean towards the simplest answer being correct – this is yet another example of the importance of investigating anomalous data.
[1] Kraken has a high ratio because it has many instruments per asset, all of which are aggregated to calculate market depth. For example, on Kraken SOL is denominated in USD, USDT, BTC, ETH, EUR, and GBP, whereas MEXC only has USDT, USDC, and BTC.
[2] Rest assured that it was excluded from the Q4 Token Liquidity Ranking.