the ranking
Here is the ranking, complete with both liquidity rank and market cap rank. A breakdown by component is now available at a dedicated webpage on Kaiko’s site here; below I’ll provide some metrics on the ranking.
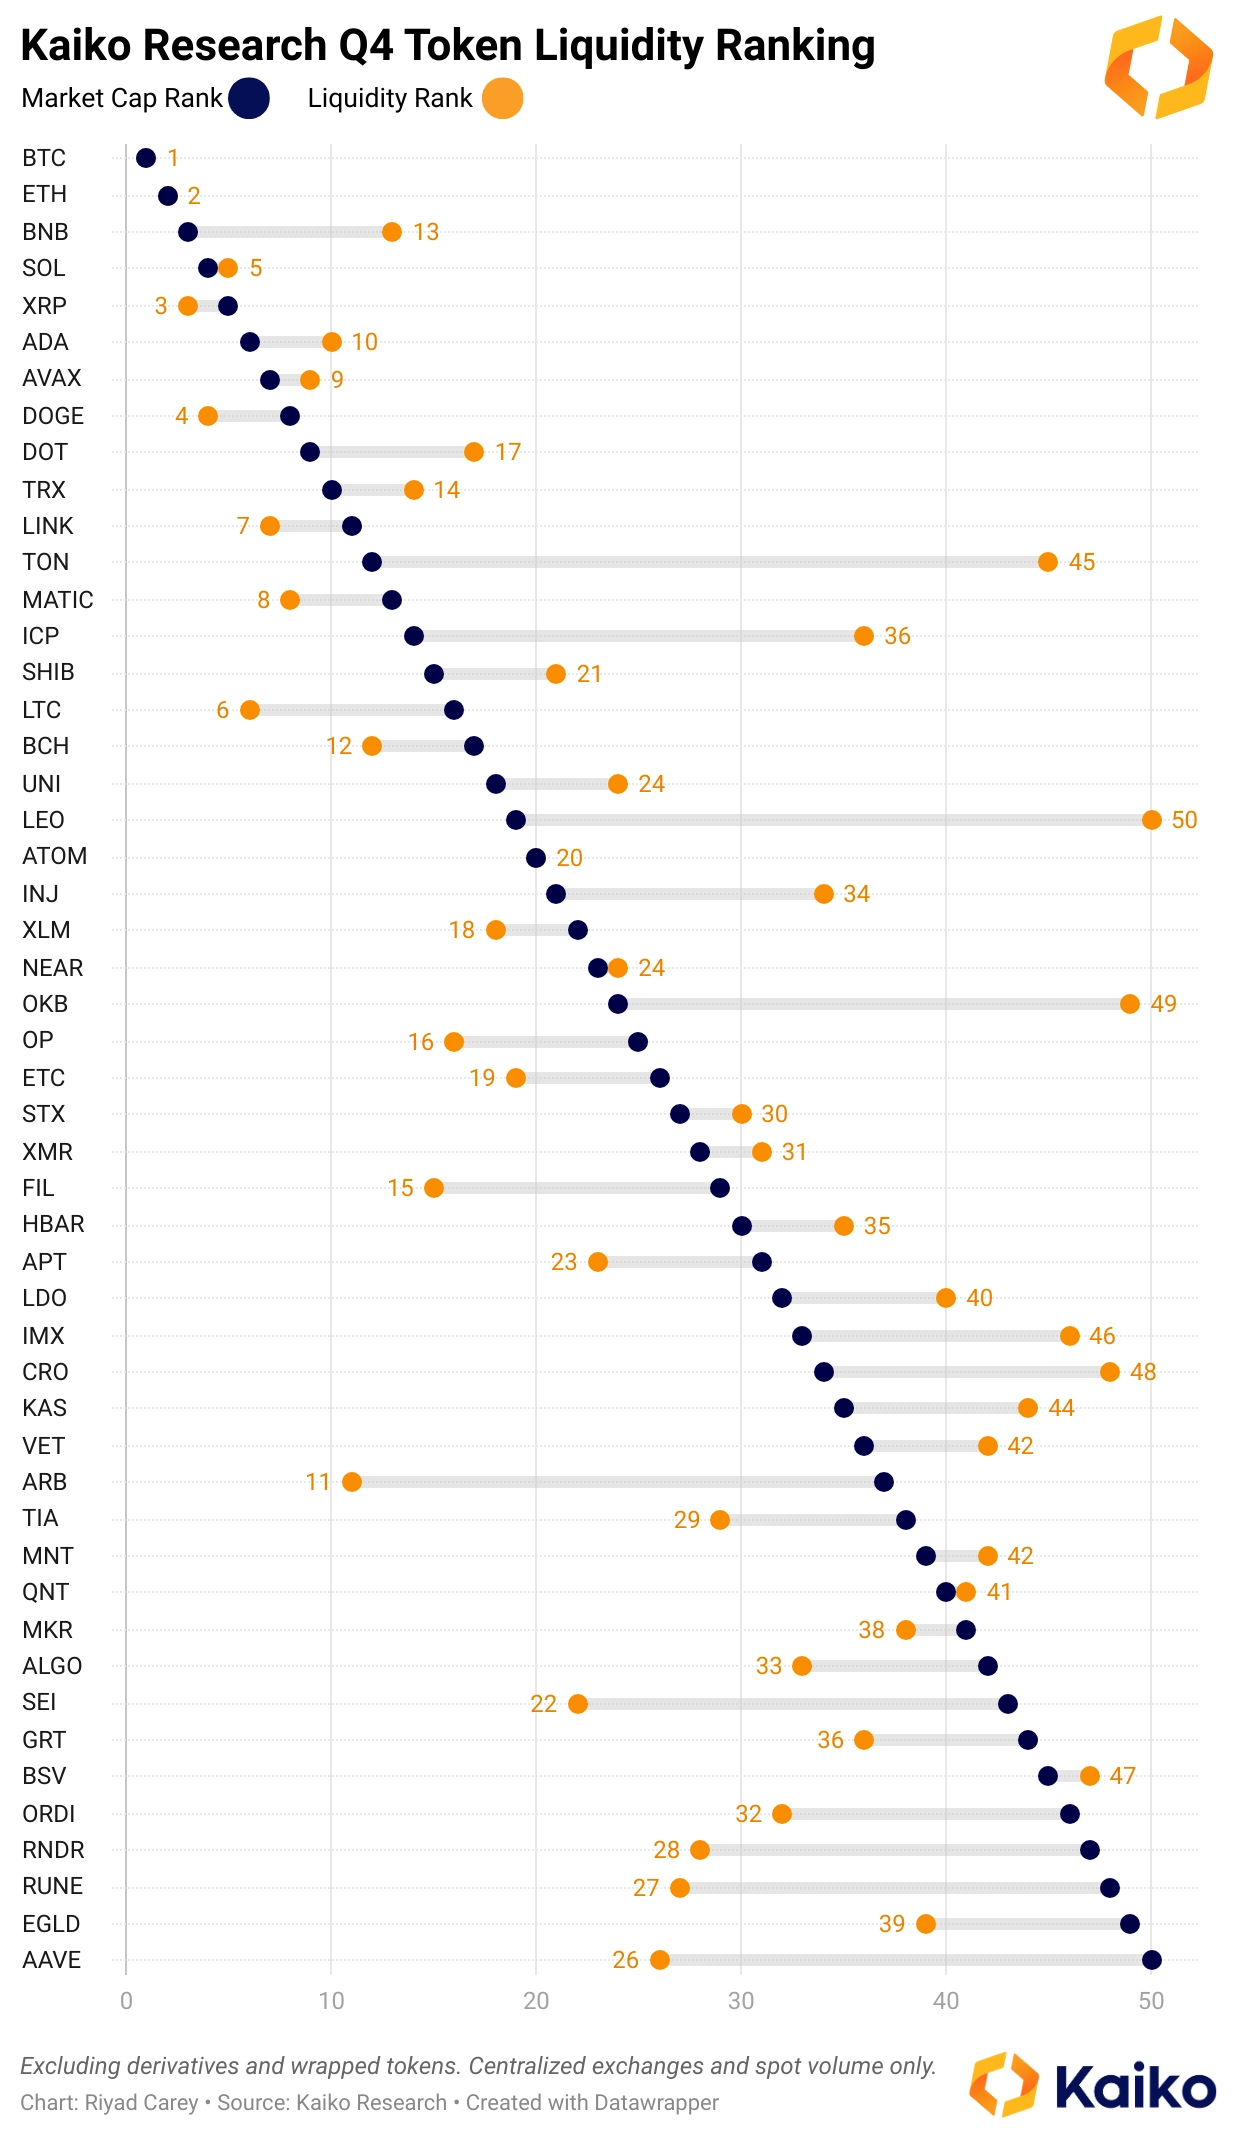
The top four tokens in our ranking – BTC, ETH, XRP, and DOGE – have remained unchanged. The first change comes in the five spot, with SOL jumping ahead of LTC. After that, the ranking becomes more chaotic: LINK is up 6 places to the 7 spot, MATIC 4 places to the 8, and AVAX up a whopping 14 to the 9 spot. Rounding out the top 10 is ADA, which dropped 3 places. BNB, 3rd by market cap, fell another 5 spots and missed out on the top 10.
To further illustrate the over and underperformers, here are the differences between market cap and liquidity rank:
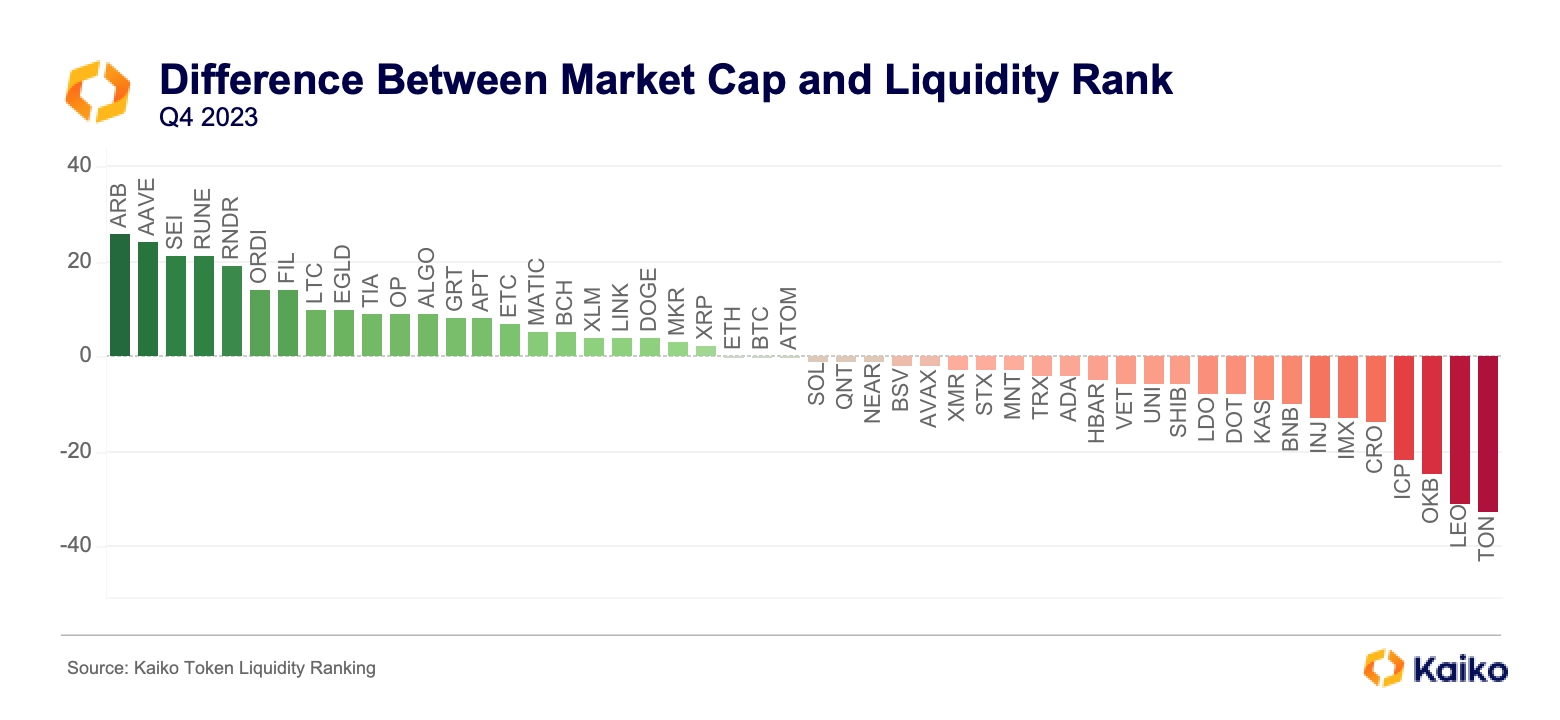
Some major takeaways:
- ARB, AAVE, and new entrants SEI, RUNE, RNDR, and ORDI most outperformed their market cap rank.
- ETH, BTC, and ATOM all performed exactly in line with their market cap.
- Telegram’s TON continues to significantly underperform its market cap because the majority of its volume is on HTX, which has been removed for suspicious activity.
- Tokens related to exchanges Bitfinex (LEO), OKX (OKB), and Crypto.com (CRO) continue to underperform.
- Internet Computer (ICP) underperformed by 22 spots, in large part due to a rally from under $5 to nearly $15 in December. While this boosted volumes, the rest of the components – depth, spreads, and liquid exchanges – lagged this large change in market cap.
Next, we can examine how the tokens’ ranks have changed since last quarter:

More takeaways:
- The token that fell the most was Mantle Network’s MNT (an Ethereum L2; MNT migrated from BitDAO’s BIT token), dropping 24 places. Last quarter, it was one of the top over-performers on the back of a Bybit instrument that was very liquid, though without much volume. This quarter, MNT’s volume picked up, in the process hurting its spreads and market depth and bringing its liquidity rank closely in line to its market cap rank.
- XMR – by far the largest privacy token – fell 17 spots amidst significant regulatory pressures and delistings.
- The exchange tokens LEO and OKB again dropped 10 spots each as we added 10 new tokens; we still have not found their “true” liquidity ranking, though I suspect it is closer to 75.
- After a bleak Q3, Avalanche’s native token, AVAX, had far and away the best bounce back this quarter.
- UNI and LINK, two older DeFi tokens, also gained ground this quarter.
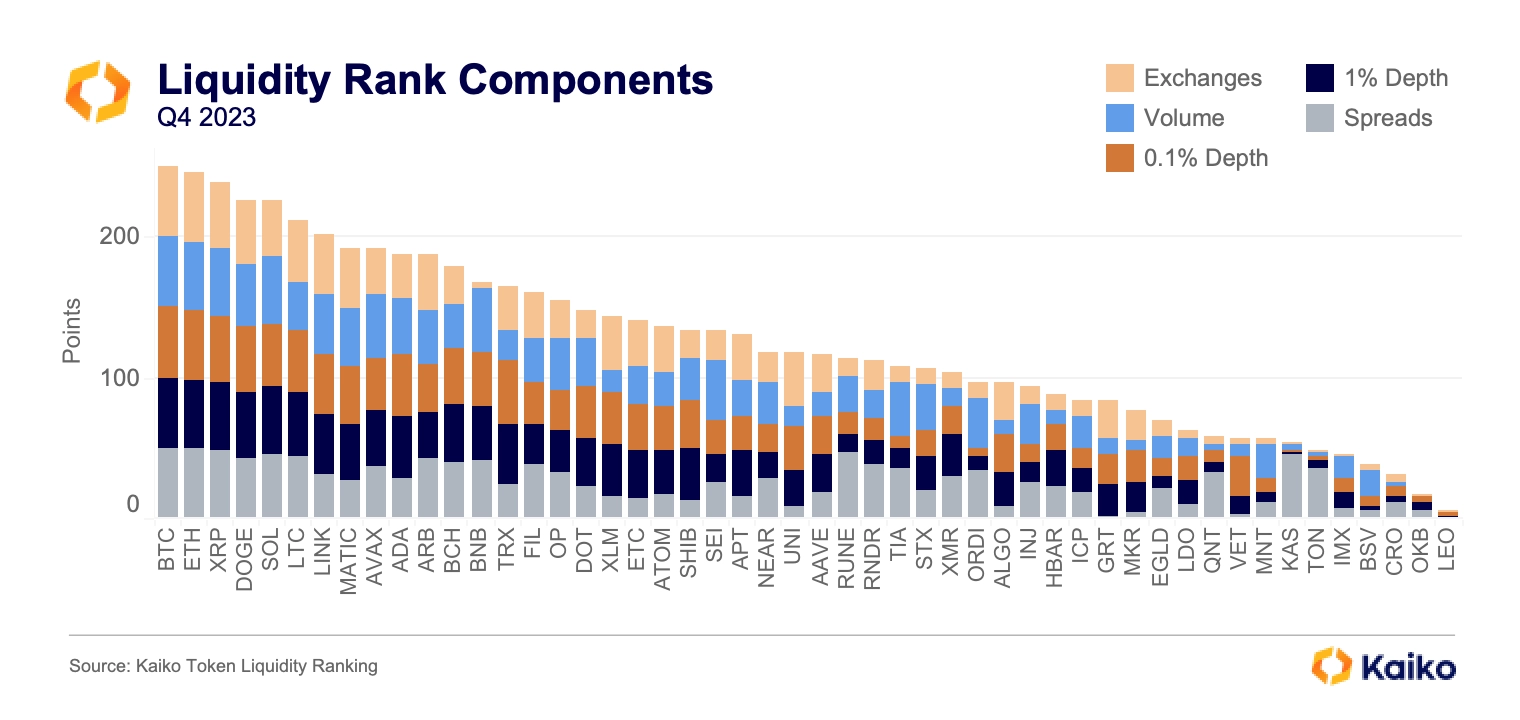
To wrap up this section, we can take a look at how all of the components fed into our ranking (for more details on the methodology of each, check out last quarter’s ranking).
larger trends
Volumes in Q4 were significantly higher than in Q3. BTC jumped from $484bn to $668bn and ETH from $156bn to $245bn.
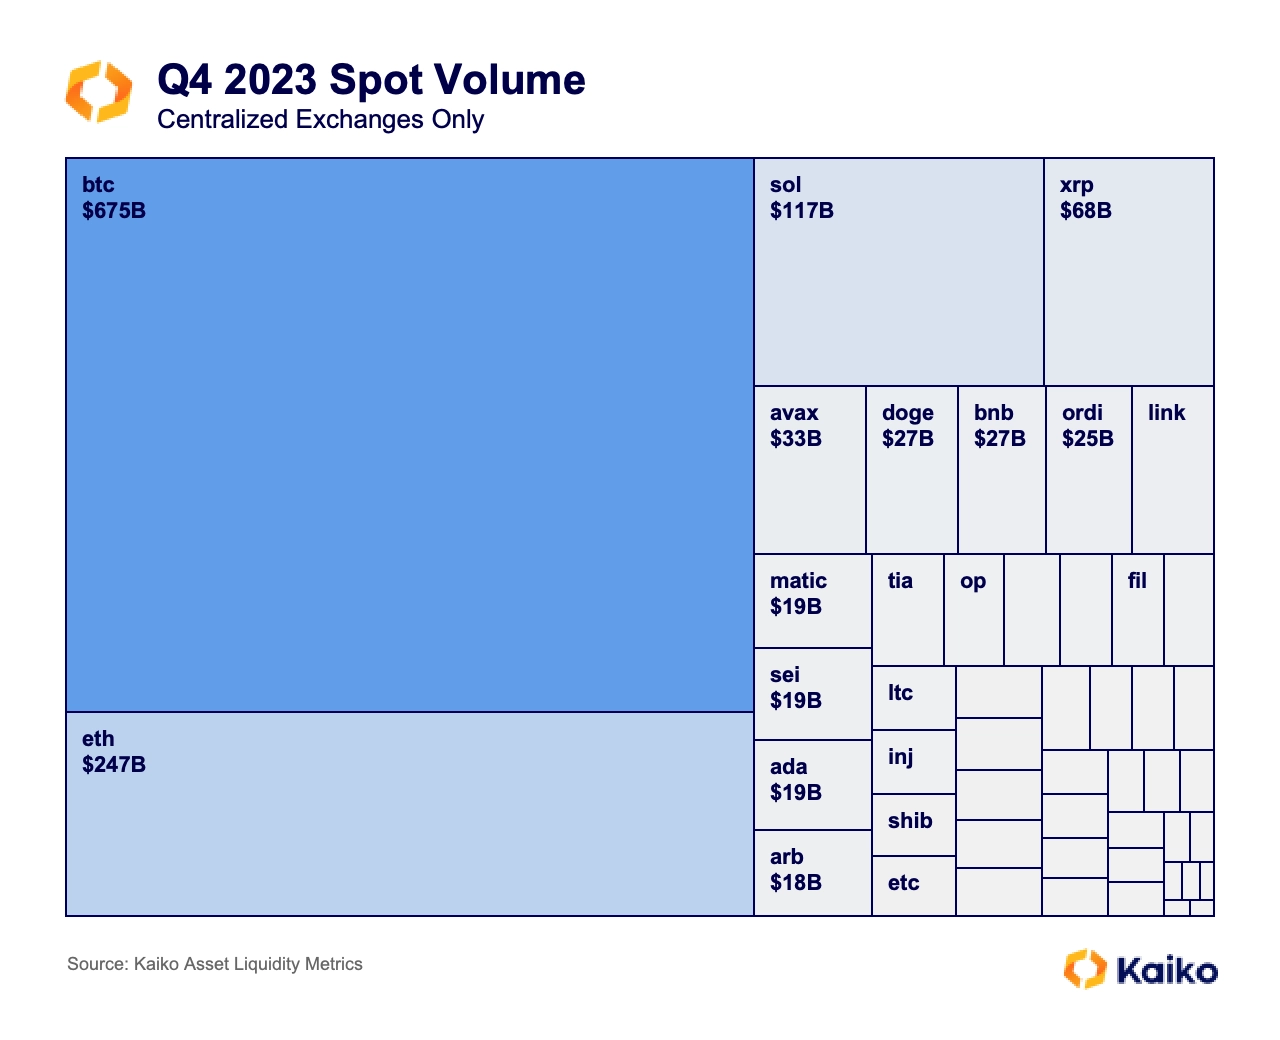
The most impressive jump was SOL, which moved from just $20bn to $116bn, passing XRP, which actually logged $2bn less volume this quarter than last. As we discussed earlier this week, SOL has flipped ETH in terms of spot volume on a number of large exchanges over the past couple weeks. Should this trend continue, SOL will likely pass DOGE to take over 4th, and could potentially challenge XRP for 3rd.
The changes on the market depth front were less dramatic. For BTC and ETH, 0.1% depth improved from $67mn to $75mn, while 1% depth was virtually unchanged following a sharp drop on December 10.
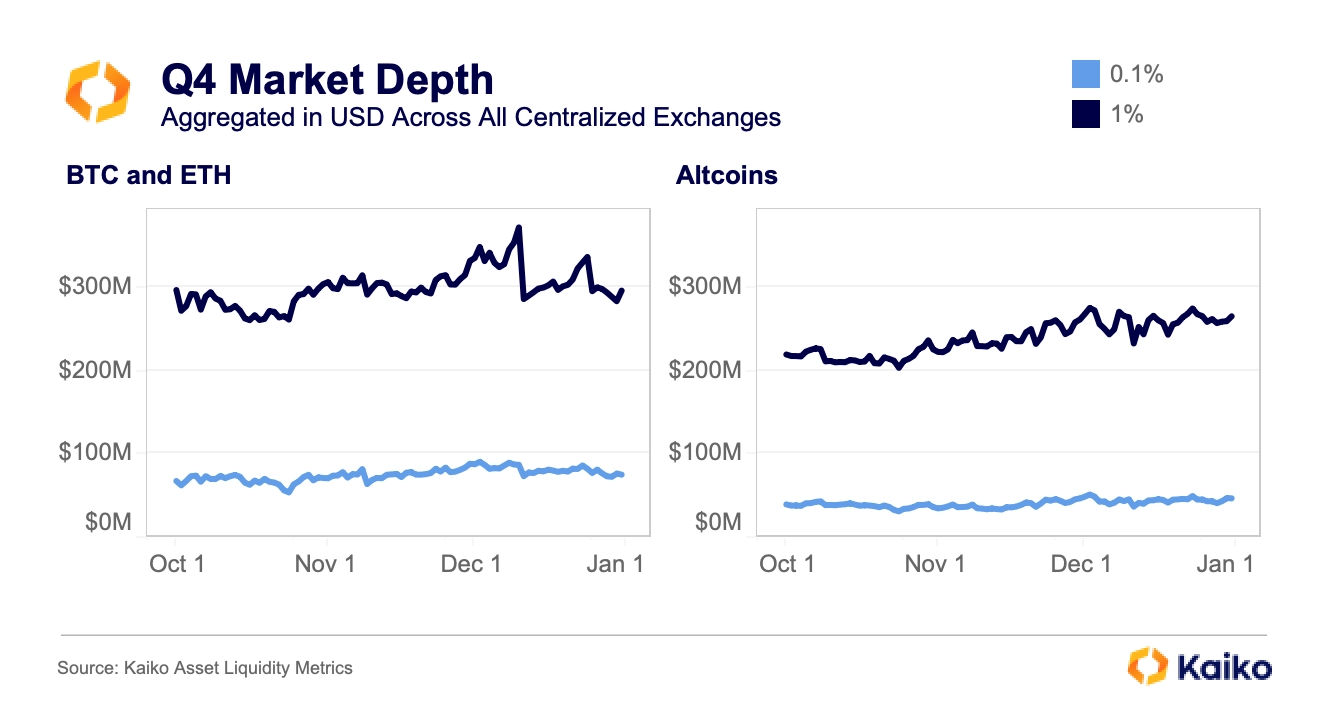
The most noticeable difference manifested in altcoins, whose 1% depth grew from $220mn to $260mn, while 0.1% expanded from $39mn to $46mn. While these are encouraging signs suggesting increased market maker and trader participation, liquidity has not kept pace with rising prices and market caps, suggesting that more volatility could be on the horizon.
conclusion
The market finally sprang back to life in Q4, led by BTC, SOL, and AVAX. Beyond these headliners, there was plenty of movement: newcomers SEI, TIA, RNDR, STX, and ORDI all had exceptional runs, each representing a relatively new narrative gaining traction. On the flip side, stragglers like BNB and DOT continued to slump, while XMR suffered the consequences of regulatory pressure. Exchange tokens continue to hang around in the top 50 by market cap despite being relatively illiquid.


![]()
![]()
![]()
![]()


