The path to $100k for Bitcoin

The State of Liquidity in Crypto Markets

Liquidity

23/03/2023

Welcome to Deep Dive!

Liquidity is all the talk in financial markets at present, and crypto has seen its fair share of liquidity incidents this month. We explore market depth, spreads, slippage and volumes to bring you up to date with all things crypto liquidity.

  • Liquidity for top 10 crypto assets has recovered in March

  • Binance spreads have narrowed after removing trading fees

  • BTC market depth is at 10-month lows

  • U.S. exchange spreads increased following the banking crisis

Crypto markets are at their most volatile when liquidity is low. Prices have less support to both the downside and the upside, which could explain BTC’s rapid +17% surge since the start of the month. Liquidity has also become a hot topic in traditional financial markets as the banking sector reels from several high-profile collapses. This has in turn trickled down to crypto, which was already suffering from a dearth of liquidity in the aftermath of FTX.

In this article I’ll examine the state of liquidity in crypto markets by looking at market depth, spreads, slippage and volumes, while outlining the key liquidity hurdles the industry needs to overcome in the near future.

Market Depth

Market depth is arguably the most relevant gauge of liquidity in crypto markets as it represents the amount of orders actually waiting to be filled within a certain price range. By summing both bids and asks within 1% of the mid price for the top 10 assets in crypto, we get a good barometer of liquidity in markets. A quick note on the data: we have started using 1% market depth to avoid potential manipulation of the 2% depth metric we uncovered which is used widely by price display websites.
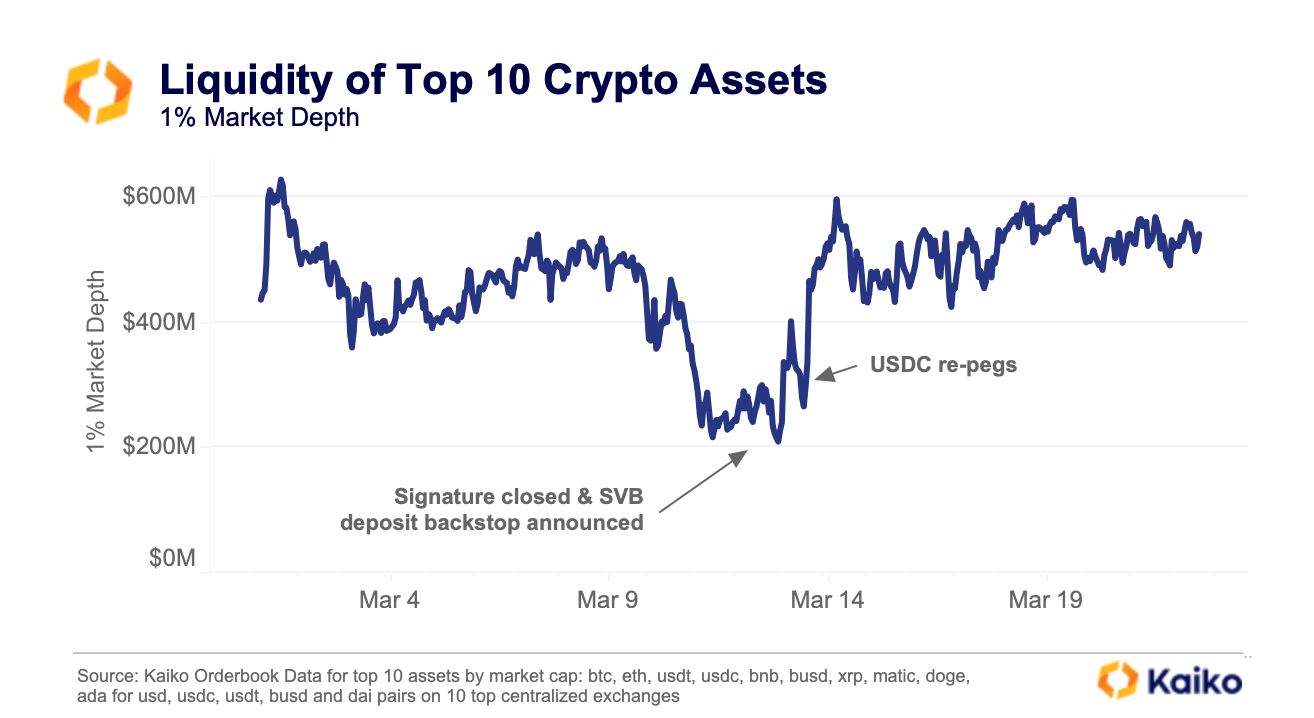
The above chart serves as a timeline for the liquidity events of the last month, with a $200mn drop around March 4th when Silvergate issues first arose and the SEN network was closed soon after. The next big dip happened when SVB and Signature collapsed, resulting in Circle’s reserves being called into question. Both SEN and Silvergate’s Signet payment network were two critical pieces of infrastructure for market makers in the space, providing 24/7 access to USD settlements with trading firms, OTC desks and other crypto firms. Following the closure of both of these networks, the liquidity situation in crypto hangs in the balance as the industry awaits a viable alternative (I talked about what could happen if no alternative appears in a piece for Coindesk this week).

The USD measure of market depth above fails to really capture the hesitance of market makers adding liquidity due to the rally in crypto prices in the last week, restoring USD liquidity metrics to their levels pre banking issues. One way to deal with this is to show market depth in native units to see if there has truly been a fresh injection of liquidity, or if it is just a price increase of the orders already on order books.
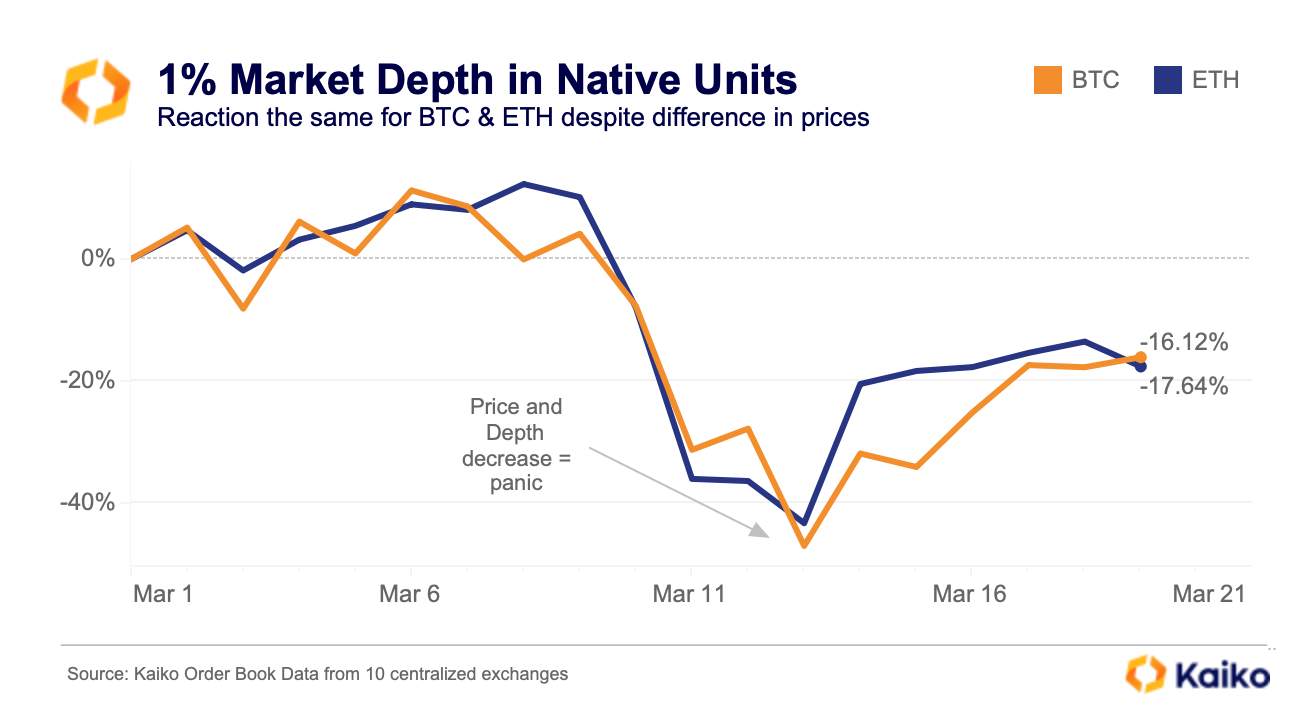
We can see that when denominated in native units, neither BTC or ETH have improved in depth, showing that this was purely a price driven increase in liquidity, which is a less sustainable way to increase liquidity in markets. Interestingly, market makers did not treat BTC and ETH any differently, despite the general rotation we’ve seen into BTC in the last week.

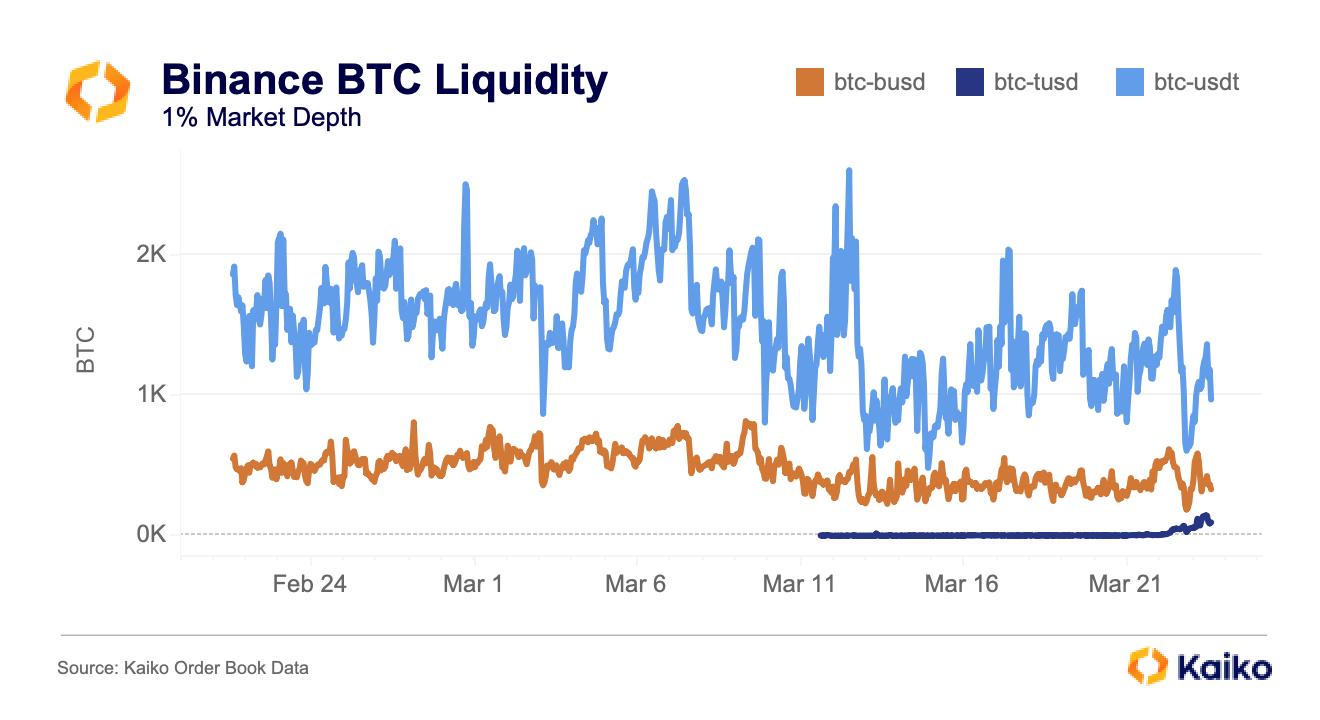
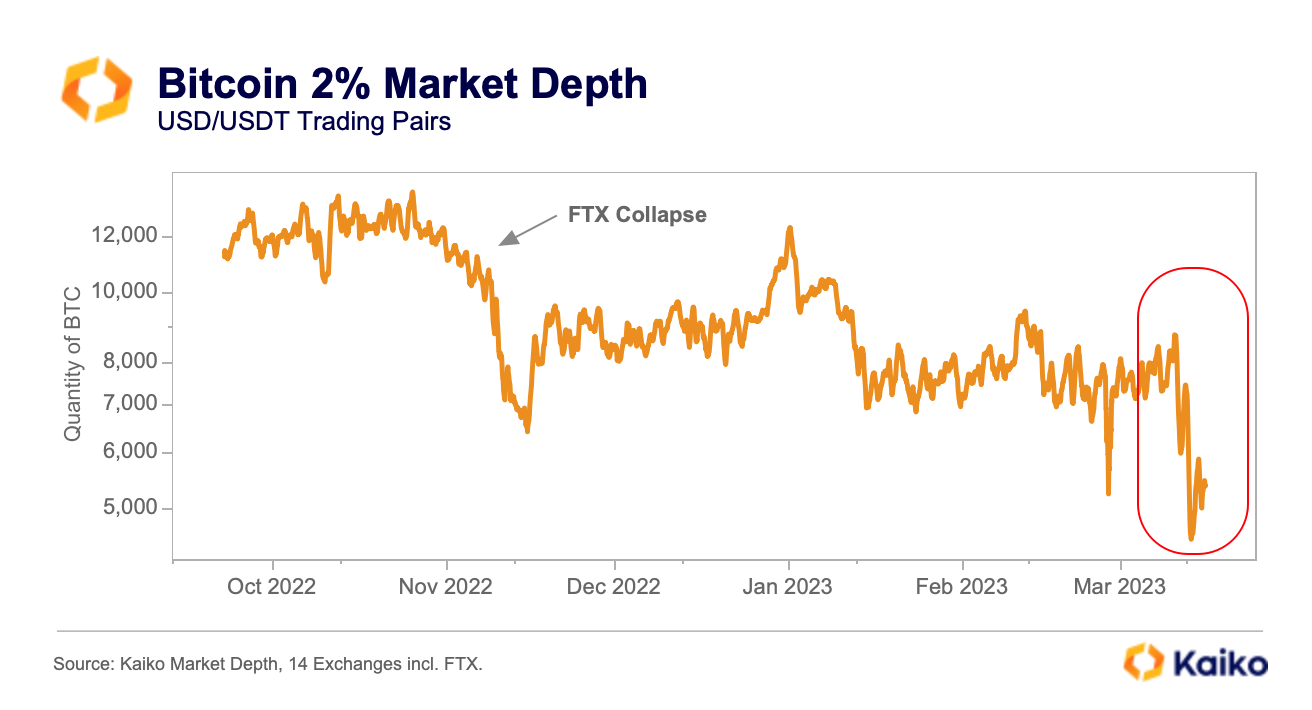
Zooming out over the last few months, market depth in BTC paints a cautionary picture. We are currently at our lowest level of liquidity in BTC markets in 10 months, even lower than the aftermath of FTX. Back when the FTX/Alameda entity collapsed, we first identified the drop in liquidity as “the Alameda Gap”, highlighting the absence of one of the industry’s biggest market makers. That gap has yet to be filled, and with the banking issues of late, liquidity has taken another blow.
The closure of SEN and wind-down of Signet, some of the only USD payment rails for crypto, resulted in U.S exchanges being harder hit from a liquidity standpoint as market makers in the region face unprecedented challenges to their operations.
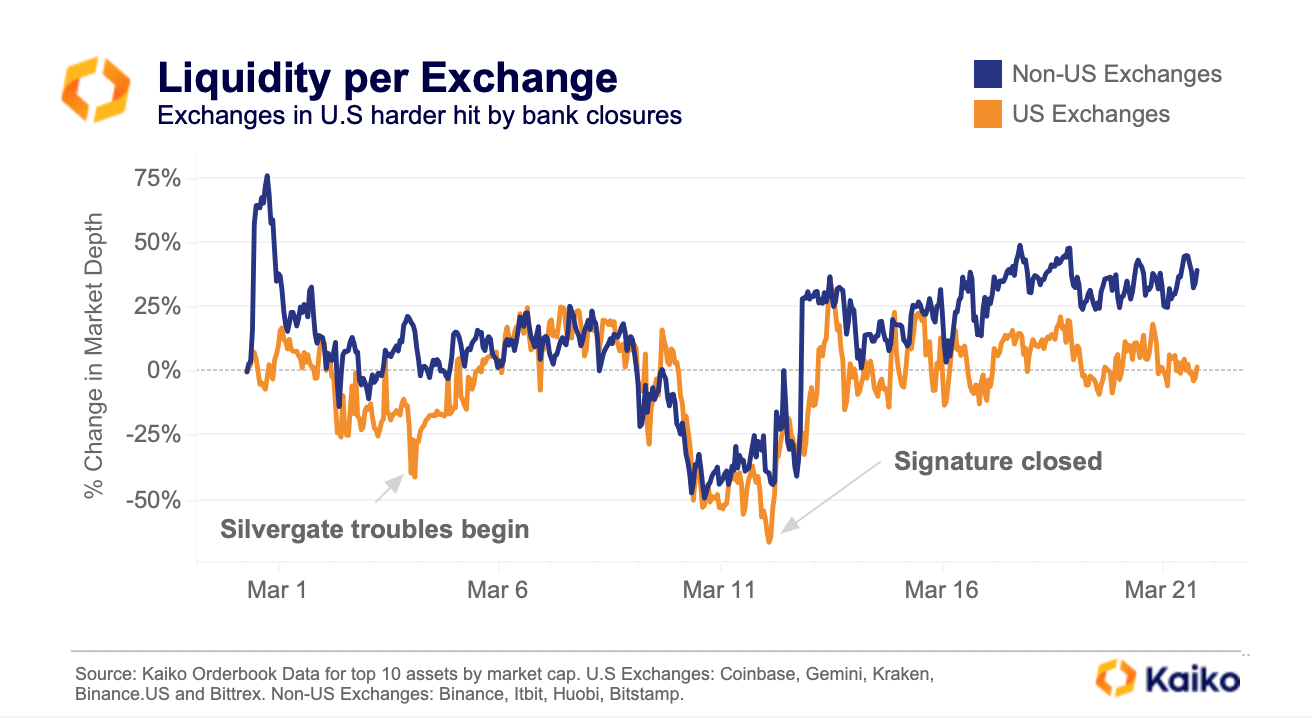
We can see the difference in reaction between US and non US exchanges with more severe reactions to some of the liquidity issues of the last month. The good news is that liquidity seems to have recovered to early-March levels, although the loss of easy fiat on-ramps could have a more long term impact.

Never Miss a Deep Dive.

Spreads

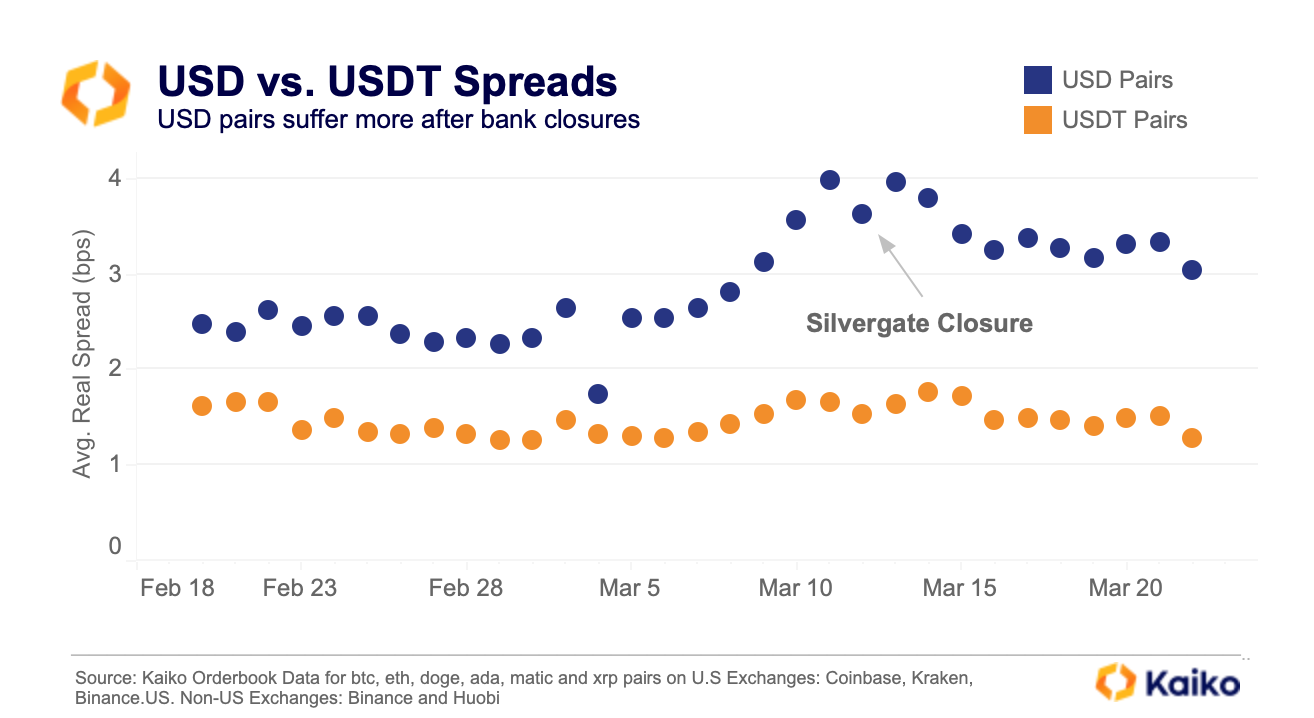
Another way to measure liquidity in markets are spreads offered on exchanges i.e the difference between the best bid and the best ask. Looking at USD v USDT pairs, we can see that USD spreads were more volatile as the banking issues worsened, spiking from 2bps all the way to 4bps as Silvergate was shut down.

As was the case with market depth, liquidity worsened for USD linked exchanges and pairs as the logistical issues surrounding the closure of fiat payment rails became clear. The longer it takes for a viable alternative to the SEN or Signet networks to appear, the more volatile we can expect spreads and depth to be as market makers face new operational challenges, pulling liquidity off exchanges until they can get more clarity.

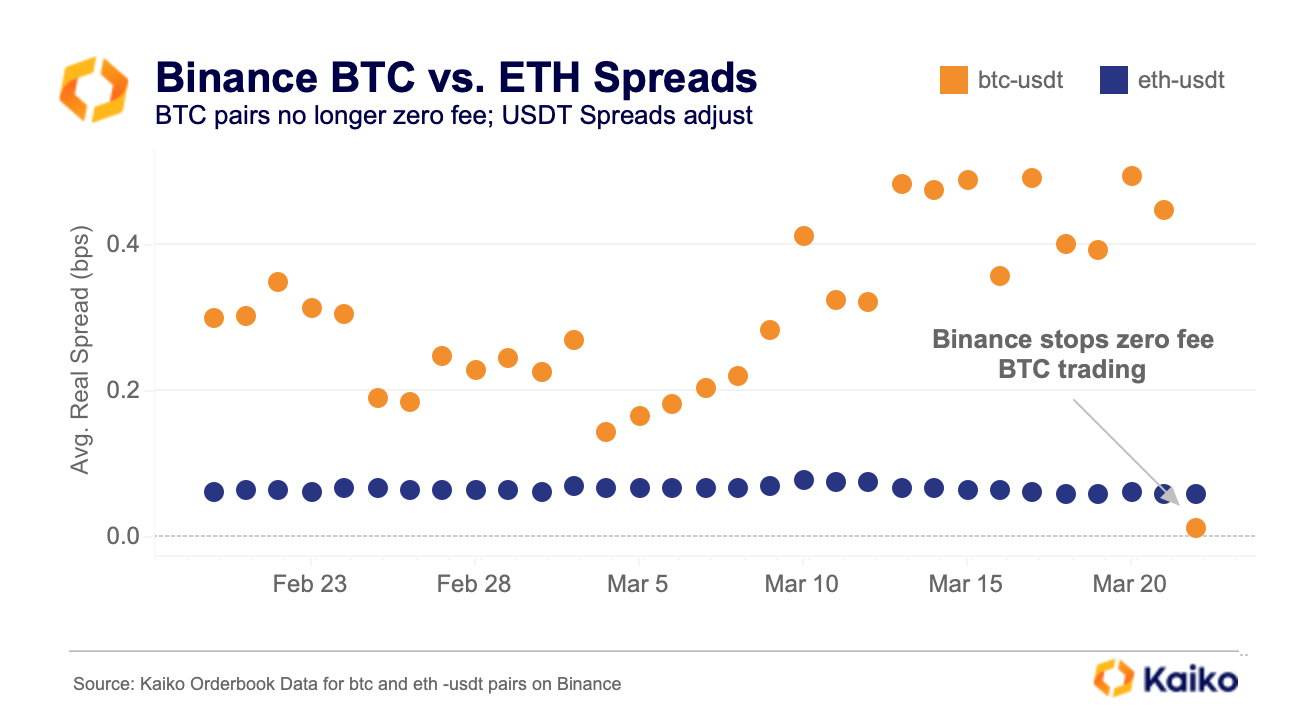
Looking away from the banking issues this month, Binance announced that they were stopping the zero fee program for BTC trading pairs (apart from the BTC-TUSD pair, which we’ll explore in next week’s Data Debrief).

The importance of this event on market liquidity is not to be understated – Binance is the most liquid exchange and the btc-usdt pair is the most liquid pair in crypto. The zero fee program allowed Binance to gain over 20% in market share since July, with over 61% of volumes coming from zero fee pairs. We can see the adjustment in spreads as the previously volatile BTC spreads on Binance, thanks to a lack of taker fee, plummeted once a fee was reintroduced, bringing BTC spreads lower than ETH spreads.

Tighter spreads make it less profitable for market makers to offer liquidity on that pair – with a taker fee being reintroduced investors aren’t willing to pay a higher spread. That has meant that liquidity has depleted from the BTC-USDT pair on Binance, dropping 70% overnight as market makers look for more profitable markets on other exchanges and pairs.

Slippage

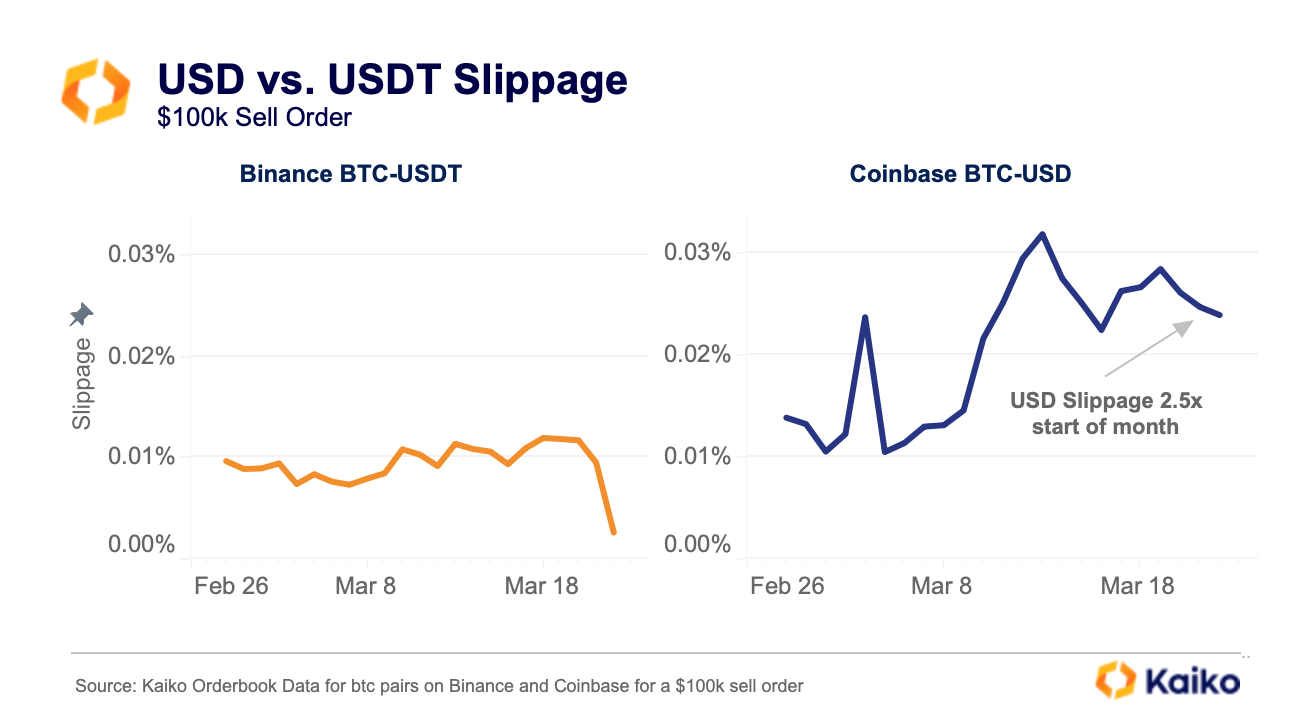
Slippage is another important measure to gauge liquidity in markets, placing a percentage loss on an order due to lack of liquidity. For a $100k sell order in BTC markets, the most liquid USD pair and the most liquid USDT pair had similar slippage of 0.1% to start March.

However, the fears over USD payment rails gripped liquidity markets in the U.S and we can see the spike in slippage around March 13th on Coinbase, compared to only a slight increase on the USDT pair on Binance. Slippage for the BTC-USD pair on Coinbase remains 2.5x higher than it was at the start of the month as USD liquidity suffers across the board in crypto markets.

Volumes

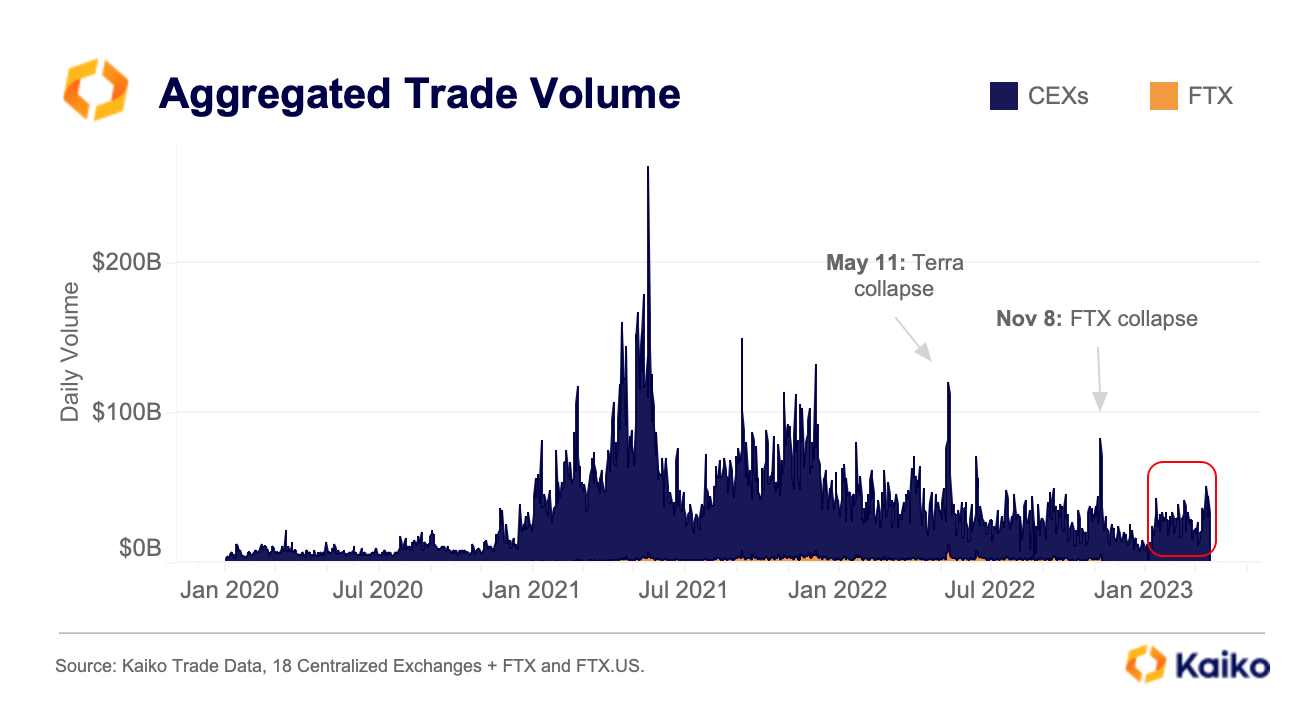
No liquidity analysis would be complete without taking a look at volumes and examining the different market dynamics that are occurring in crypto today. Taking a step back to give some context with regards to volumes, the good news is that volumes have significantly picked up from the multi year lows that were set at the end of 2022.

Looking at previous volume patterns, we seem to be at a similar level to both the start of 2022 and 2021, both resulting in very different outcomes. Which direction we move is anyone’s guess, but in order to have a sustained move upwards we certainly need a pick up in volumes, which we’ve started off with, and a pick up in liquidity, which as we’ve seen has yet to happen.

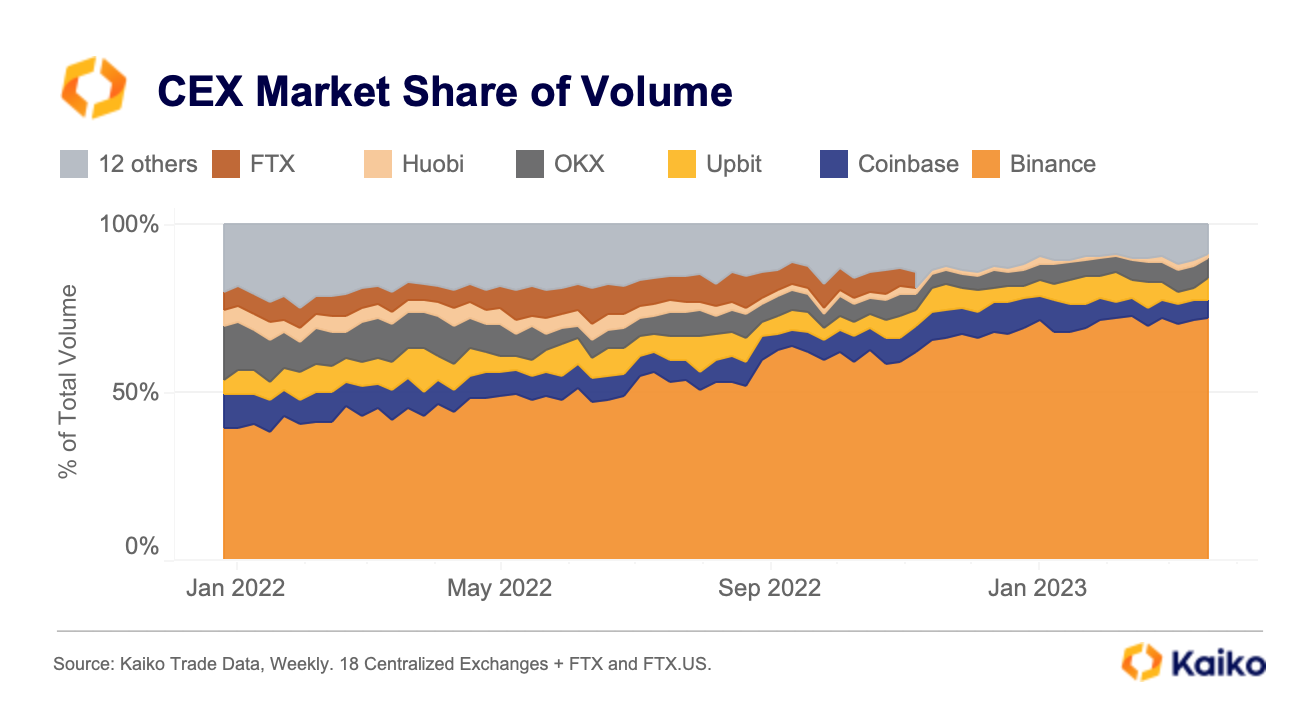
Breaking volumes down per exchange, it’s a story of Binance vs everyone else. Notably, Coinbase has failed to gain any market share in volumes despite the worries surrounding USD pairs, and the launch of its own Layer 2, Base.


One conclusion from the volume share per exchange is that very little volume actually flows into U.S exchanges and in turn, USD pairs. The split of stablecoin vs. USD volumes reinforces this conclusion, with stablecoins rising from a 77% share of volumes to 95% in just over a year.

Conclusion

The reality is USD pairs are being phased out by investors, in favor of stablecoins, and have been for some time. This makes the lack of USD payment rails more of an institutional problem than an investor issue, but the knock-on effects of reduced liquidity which we have seen in depth, spreads and slippage will have an impact on everyone in the space.

I have faith that someone in the U.S will be able to offer a payment network similar to SEN or Signet, the gap in the market is simply too big not to fill. Once, and only once that happens, will we see a boost to liquidity as market makers feel more comfortable offering liquidity in the space. A boost in liquidity will mean less volatility and a more attractive asset class for the next wave of investors to kick off the next bull cycle.

Data Used In This Analysis

More From Kaiko Research

  • Memecoins

    18/11/2024 Data Debrief

    Attention Shifts to Meme Tokens

    Bitcoin maintains a strong momentum despite whipsawing either side of $90k over the weekend, after briefly surpassing $93K last week. Meanwhile, Bitwise filed for a multi-crypto ETF and SEC Chair Gary Gensler hinted at resigning.

  • Bitcoin

    14/11/2024 Deep Dive

    The path to $100k for Bitcoin

    This week, we’re diving into the anatomy of BTC’s latest rally and its broader market implications. On Wednesday, BTC surged past $93K as post-election momentum gained traction. Meanwhile, memecoins are booming following the announcement of the creation of D.O.G.E., the U.S. Department of Government Efficiency.

  • Bitcoin

    11/11/2024 Data Debrief

    Bitcoin Breaks Above $80K

    Bitcoin broke above $80K over the weekend after Donald Trump’s U.S. election win last week spurred a broad market rally. ETH is also up by over 30% since November 5, outpacing BTC for the first time in months. Meanwhile, a consortium of crypto companies launched a USD-backed stablecoin, and the U.S. SEC delayed its decision on spot ETH ETFs options.

  • Bitcoin

    04/11/2024 Data Debrief

    2024 US General Election Special

    Ahead of the US election, this week we’re revisiting the topic as a follow-up to our Deep Dive coverage from last week. We’ll examine key metrics to monitor as the election night approaches and explore the following: