The original cryptocurrency is on yet another barnstorming run. In fact the rally over the past week’s markets is the third of its kind since January—when BTC broke $110k for the first time. Political headwinds sent BTC on a round trip to $80k after that, before it recovered to climb to near $112k in May.
Last week it surged again, this time above $118k. BTC even breached $123k on some exchanges today, according to Kaiko data. While those rapid price moves might make it seem like there’s some volatility in markets right now, it’s actually quite the opposite.
Critics of BTC spent most of the past 15 years pointing to its often whipsawing price activity as a deterrent to investors. Indeed it was for many years, while it could run up 150%, it was equally likely to drop by more the following week. However, that trend is changing and fast.
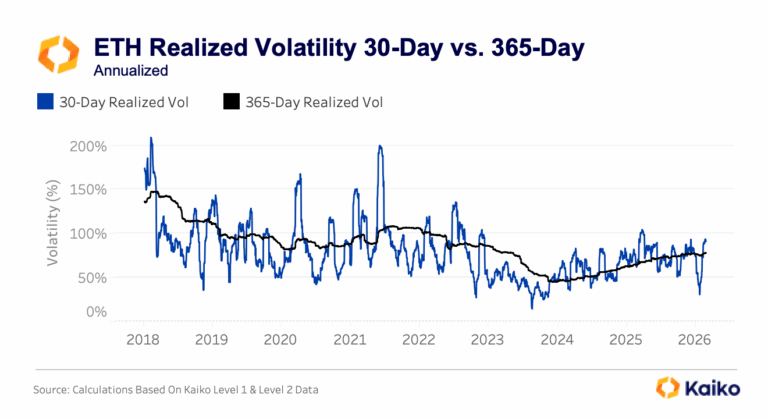
BTC’s realized 30-day volatility is currently below 40%, much lower that its average of 51% since January 2022. One of the major turning points on BTC’s volatility journey was the launch of spot BTC exchange-traded funds launched in January of 2024. Since then 30-day realized volatility hasn’t gotten above 80%. It even went as low as 25% in June of last year.

It’s easy to think that this might be a concern for BTC investors, who often viewed its high volatility as a feature and not a bug. However, its recent lower volatility profile hasn’t come at the cost of gains, as we can clearly see over the past few months.
Looking beyond realized volatility we can see that the value at risk for a BTC portfolio has been trending lower since the beginning of the year. Value at Risk (VaR) is a forward looking risk indicator used to quantify the extent and probability of potential losses in a portfolio. It helps assign a cash value to a specific confidence level, in our example below we’ve used a 95% VaR.
Basically it says, ignoring the really bad outcomes, like the worst 5%, what is the most we can expect to lose. If you hold one BTC your current daily 95% VaR is about $2.3k, and it has been falling.
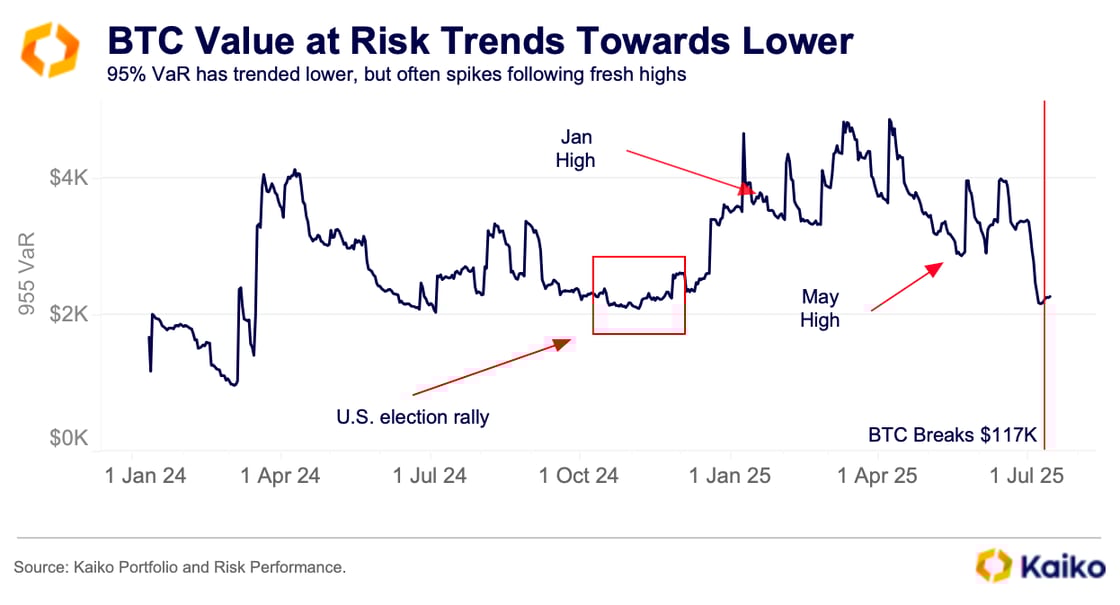
This isn’t the first time that the risk outlook has been muted while BTC ripped to record highs. During the rally from $70k to above $105k following the U.S. elections, the daily 95% VaR was consistently between $2.1k and $2.3k. Over this period BTC had multiple days where prices rose by more than $3k, meaning the risk-reward was hugely skewed to the upside.
We’re in a similar risk environment now as both daily and 10-day VaR are consistently below actual market returns. For example, if we look at a 95% VaR with a 10-day holding period from July 3, it was around $9.1k, less than the $10k price increase over that 10-day period. This is partly to be expected, as momentum builds and demand pushes prices higher, but it should still be encouraging to bulls as it echoes the record rally post-U.S. election.
Another thing that’s important to note here is how BTC’s investment profile is changing. Value at Risk is just one tool used by risk analysts and market participants, but it is something that should encourage more firm’s to be comfortable investing in BTC going forward.
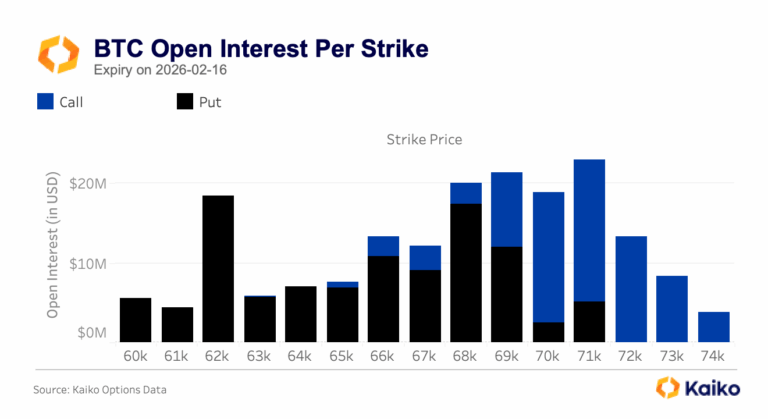
So, what does this all mean? Does this rally have legs? Activity in BTC options markets certainly seems to suggest a sustained bullish tilt in the near-term.
Since last week’s rally began options traders on Deribit have favoured call options, which are typically more bullish, over more bearish puts options. While this was less skewed over the weekend, as trading volumes fell, calls began to once again eclipse puts early on Monday.
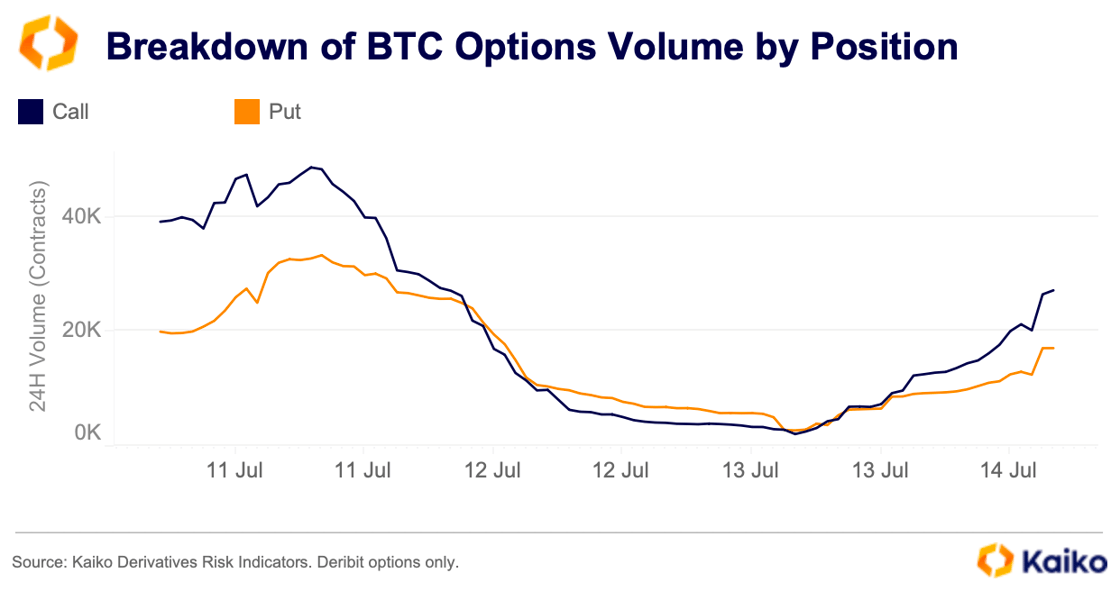
It’s important to note that not all call buying is a bullish signal, there’s nuances to options and we can’t explain them all here, but broadly speaking the call buying can be seen as a bullish signal. While some activity might be tied to hedges or more complex trading strategies.
Another way to look at sentiment right now is using implied volatility with regard to strike prices to create IV smiles. Currently next week’s July 25 expiry on Deribit is seeing more demand for protection to the shortside.
The end of month expiration for August is more symmetrical, with only a small spread between demand for short and long exposure. IV is skewed slightly to the left, shortside, at 47.9% for protective bets and 46.5% for upside exposure, on the right.
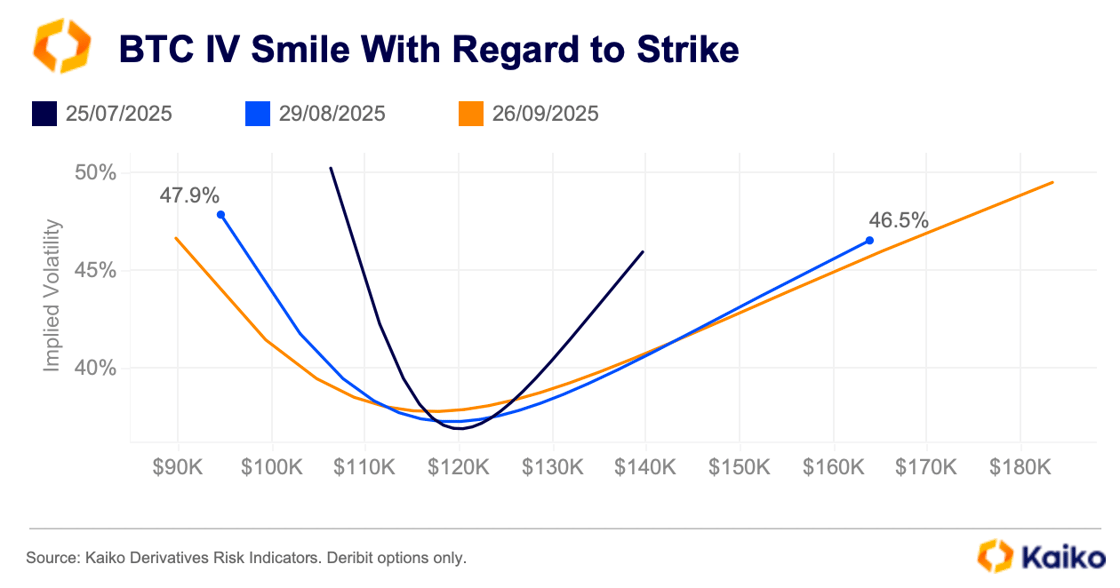
This modest skew to the downside for the end of August expiration doesn’t mean there’s a reckoning coming, as it is not extreme, it’s likely just portfolio hedging and adjustments after last week’s massive rally led traders to repositioning quickly.
Even though market risk has declined recently, it hasn’t disappeared. The same factors that drove volatility and price declines in March could resurface. In particular, renewed tariff threats from the U.S. president highlight the lingering potential for significant risk tied to the administration’s trade policy stance.
Data Points
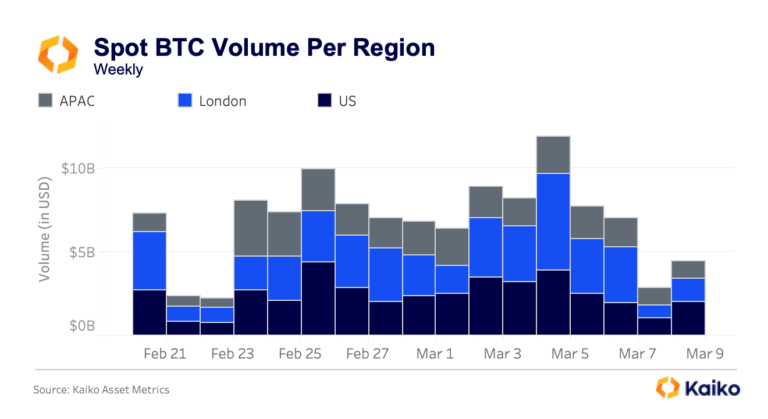
Share of BTC volume during U.S. market hours hits ATH
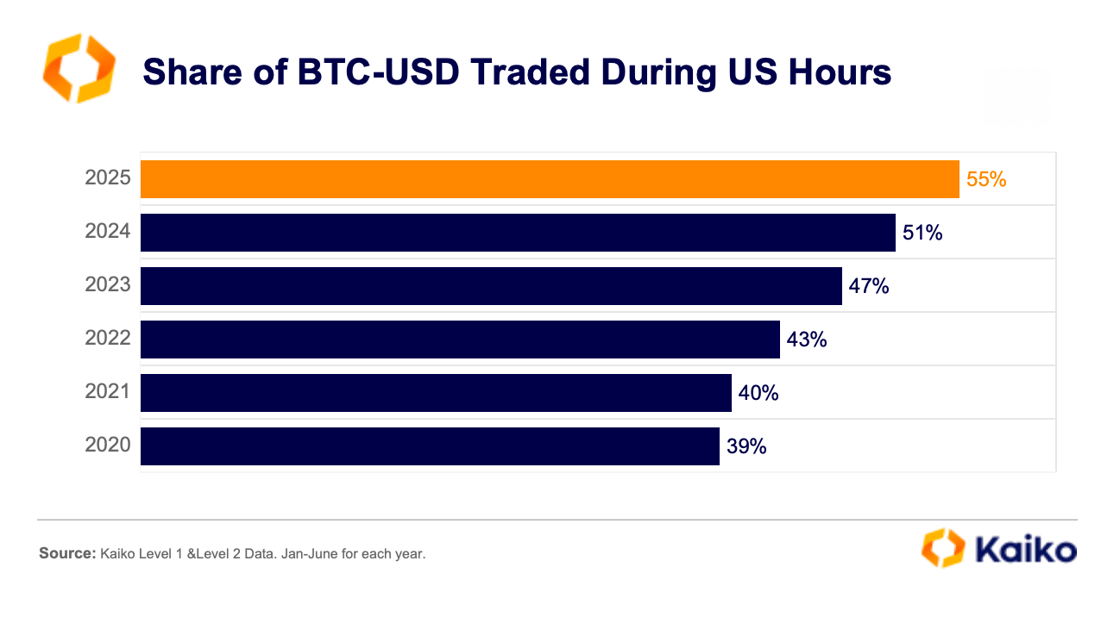
Bitcoin traded against the U.S. Dollar is now more concentrated than ever during U.S. trading hours. As of 2025, more than 55% of all BTC-USD trading now occurs during U.S. hours, up from just 39% in 2020. That’s a dramatic shift in market structure, hinting at institutional participants increasingly driving the action.
A quarter of all BTC-USD volume is now clustered around the U.S. market open and close, two windows long known for intense activity in equities and futures markets. We first noticed this trend following the launch of U.S. spot Bitcoin ETFs in early 2024, when the U.S. close (19:00–20:00 UTC) became the dominant trading hour, as arbitrageurs and ETF flows poured in.
But in 2025, the focus has shifted. The U.S. market open has overtaken the close as the busiest time of day, potentially pointing to deeper and more diverse institutional participation, or a rise in algorithmic trading.
In traditional markets, algos tend to concentrate activity around the open, when liquidity is highest and price discovery is most active. Bitcoin seems to be following suit.
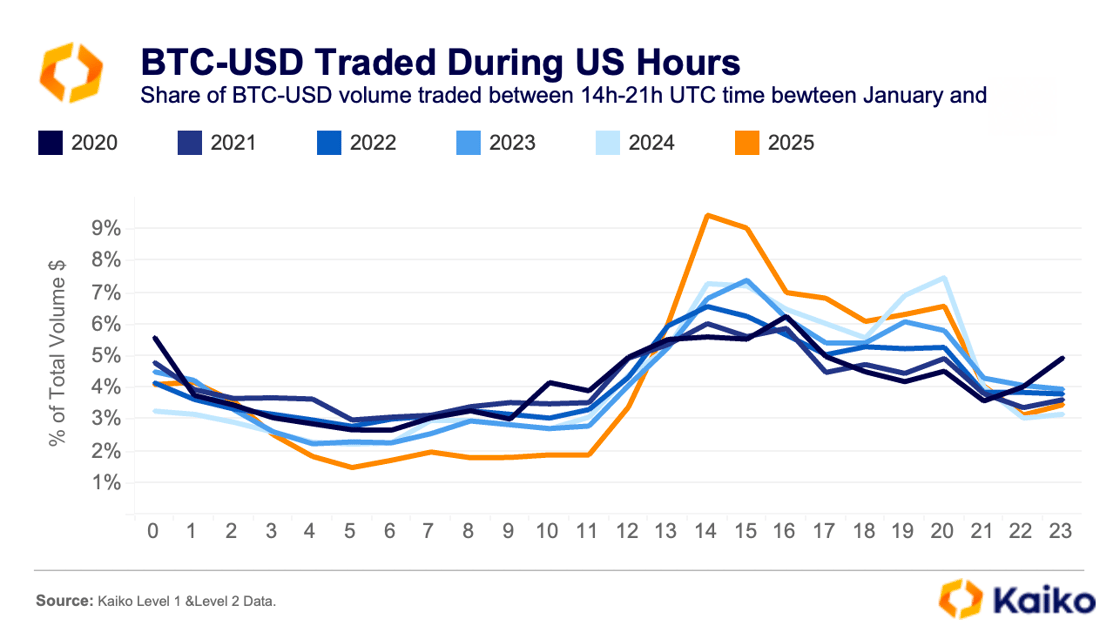
However, as U.S. participation has grown, trading outside U.S. hours has declined to an all-time low. The USD market now shows a clear liquidity gap during Asia and Europe’s trading windows, raising concerns about slippage and price inefficiencies when American desks go offline.
Yet, not all signs point to centralization. Weekend liquidity, long in decline, has shown a small but notable rebound. After bottoming at 12.8% in 2024, the share of BTC-USD volume traded over the weekend has stabilized at 13.3%. It’s still far from the 21% highs seen in 2021, but it’s a sign that market infrastructure is improving—and that market makers are regaining the confidence to quote risk even when traditional markets are closed.
EUR market share of volume nears all-time high.
While much of the spotlight in crypto markets has focused on U.S. regulatory developments, the Euro has been staging a quiet but significant comeback.
Over the past six months, the Euro’s share of global fiat trading volume has nearly doubled, rising from just 6% in January to over 11% by early July. Even more notably, its share has consistently remained above 10% since March, marking the longest such stretch since 2020.
What’s behind this rise?
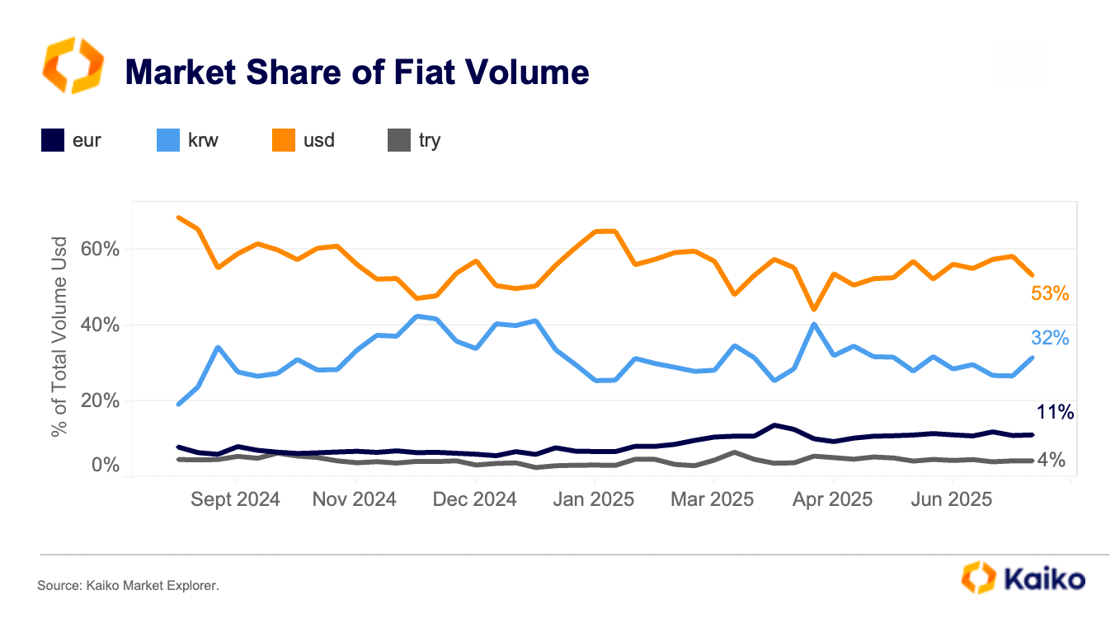
The answer points offshore. In particular, Binance has significantly expanded its presence in the EUR market, growing its EUR market share from 10% to 19% since the start of the year.
Interestingly, while BTC-EUR has long dominated Euro-denominated crypto trading, it’s ETH-EUR that’s driving the current wave. ETH-EUR has briefly surpassed BTC-EUR as the largest EUR trading pair on Binance, with its share nearly tripling since April. It now accounts for almost 34% of all EUR-denominated volume on the platform.