Data Points
The data behind the analysis: how we measure liquidity.
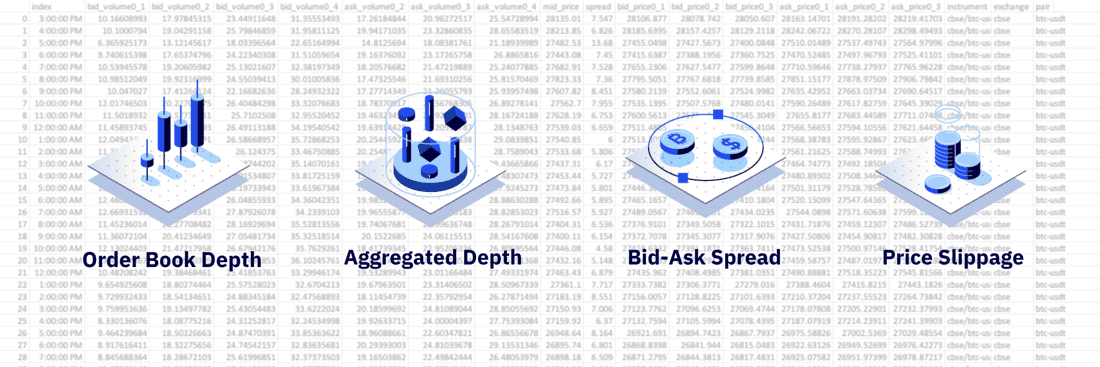
Liquidity is a complex concept in crypto markets that can only be fully understood with the right data. In our latest deep dive, we provide a behind-the-scenes look into the data that we use for some of our best-known research. We explore market depth, bid-ask spread, slippage, and all of the various granularities and aggregations that exist.
View Deep Dive
Binance derivatives volume still peaks during U.S. hours.
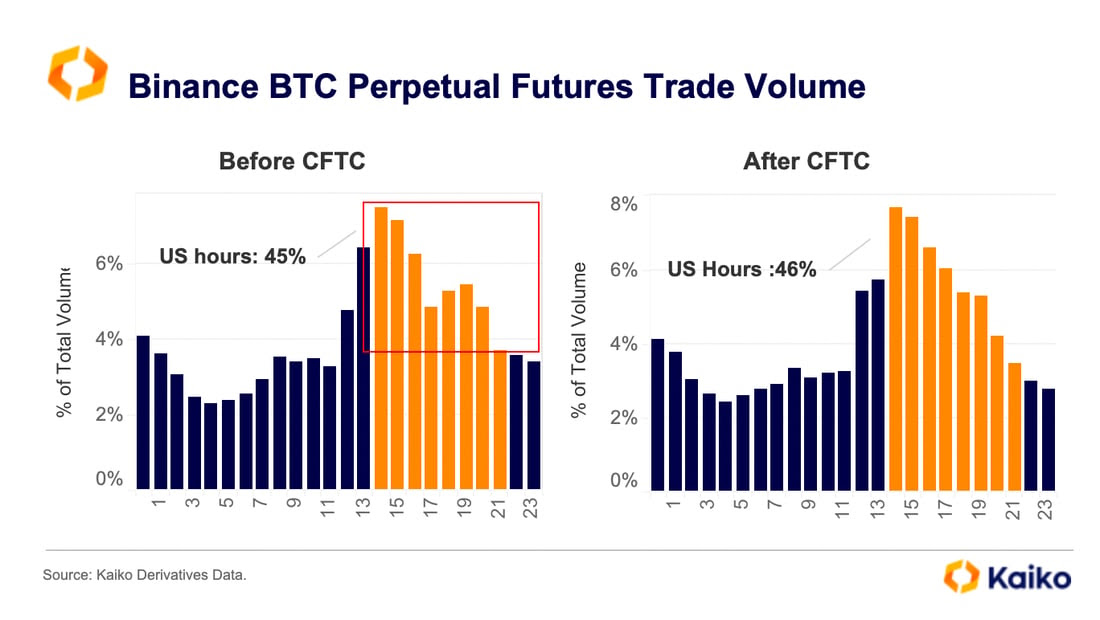
In March, the CFTC charged Binance with operating an illegal exchange for derivatives on digital assets, alleging they willingly enabled U.S.-based traders to use the platform. In the month following the lawsuit, we noticed a decline in the share of perpetual futures traded during U.S. hours. Six months after, it appears this trend has disappeared.
Volume still peaks at the opening of U.S. trading hours, which in total account for 46% of daily average volume. It should be noted that crypto markets are 24/7, so U.S. trading hours are used as a proxy to estimate the location of traders under the assumption they operate during similar hours. Ultimately, due to the anonymity of trade data, it is difficult to determine the location of any crypto trader.
What explains FDUSD’s rise?
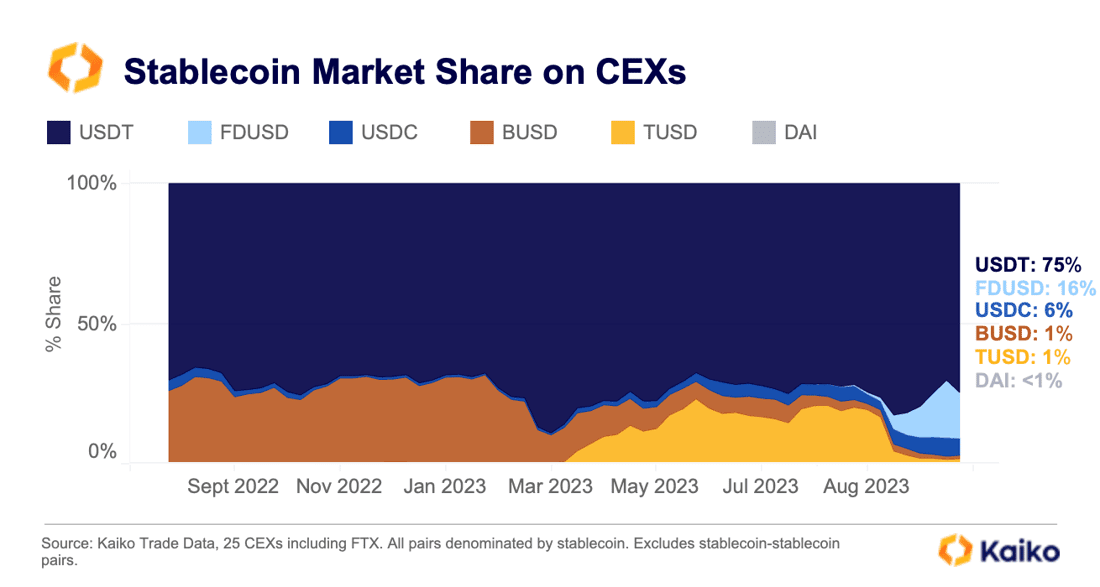
Out of nowhere, the little-known stablecoin FDUSD went from having 0% market share on centralized exchanges to more than 16%. Its spectacular rise coincided precisely with TUSD’s spectacular fall. What gives?
The link here is Binance. TUSD is a stablecoin that had virtually no volume before Binance essentially selected it as a successor to BUSD back in March and began promoting a zero-fee BTC-TUSD pair. This caused a massive increase in TUSD’s market share from <1% to a high of 23%, with the vast majority of all volume aggregated on this one zero-fee pair.
For unclear reasons, Binance decided to stop promoting TUSD in August. Enter FDUSD.
FDUSD is a new stablecoin issued by Hong Kong’s First Digital and appears to now be the chosen successor to BUSD. Binance began promoting a similar zero-fee pair, causing FDUSD volumes to skyrocket. FDUSD is only listed on Binance, whereas TUSD is listed on 10+ exchanges. It remains unclear the origins of this new stablecoin and details on its issuer remain scarce.
Circle’s Euro stablecoin now leads market share.

In June of 2022, Circle launched a euro-backed stablecoin, EURC, as an alternative to its dollar-backed stablecoin USDC. For years, euro stablecoins struggled to gain any users, in part due to the ECB running negative interest rates on cash deposits for over a decade. The interest rate environment has since changed, spurring a handful of issuers to attempt to grow euro stablecoin usage.
EURC has since claimed the largest market share of volume on centralized exchanges relative to EURT, Tether’s stablecoin, and EURS, a smaller stablecoin.

Yet, the market for Euro stablecoins remains infinitesimally smaller than for USD stablecoins. Average weekly volume for USD stablecoins was $107B, compared with just $16m for Euro stablecoins.
Bitcoin forks: how are they doing?

Bitcoin SV (BSV) rallied 30% last week as Binance relisted perpetual futures for the token. This rally brought the Bitcoin fork into positive territory for the year, which it broke only briefly back in July. Bitcoin Cash (BCH), the more popular Bitcoin fork, managed a 200% rally in the same month. There were few obvious catalysts for this massive appreciation other than BCH being included as one of four tokens available on EDX Markets, the institutional exchange backed by Fidelity and Citadel that launched in July. BCH’s rally helped it nab the title of “most improved” in our token liquidity ranking.
Spot volume is dropping faster than derivatives.

Derivatives contracts have long been the preference of crypto traders. Average derivatives volumes have historically ben far higher than spot, and we can see this trend play out in the prolonged bear market we are in. While volumes have dropped globally across all markets since January, perpetual futures have fared significantly better than spot, with a drop of just 42% relative to 69%.


![]()
![]()
![]()
![]()


