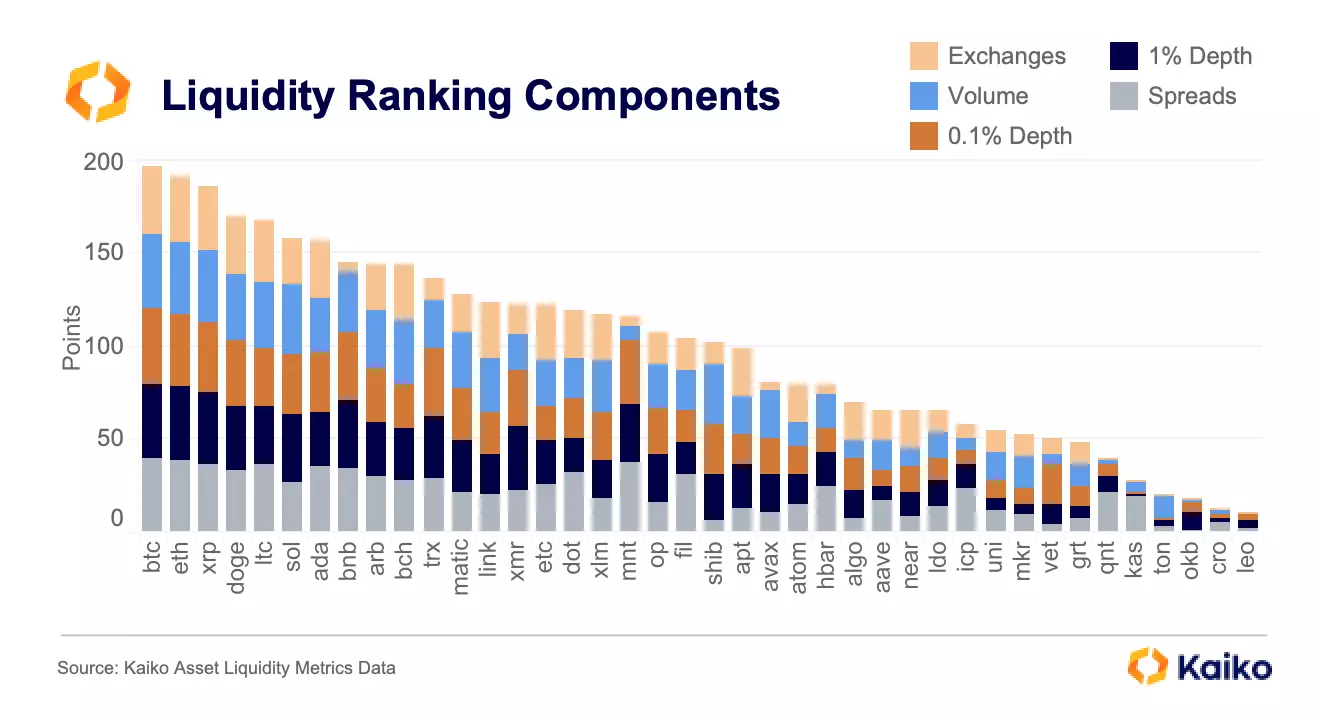
spreads
For the most part, the five components are correlated. There are, however, some interesting divergences, especially when it comes to spreads. For example, SOL’s spreads are worse than its peers; XLM, SHIB, OP, ALGO, and NEAR also have poor spreads relative to their ranking. MNT, FIL, QNT, and KAS have better spreads relative to their rankings. In fact, MNT has the third best spreads of any token, benefitting from the fact that the vast majority of its volume and liquidity is on a single instrument on Bybit.
Below is a sample of median spreads in the past month.
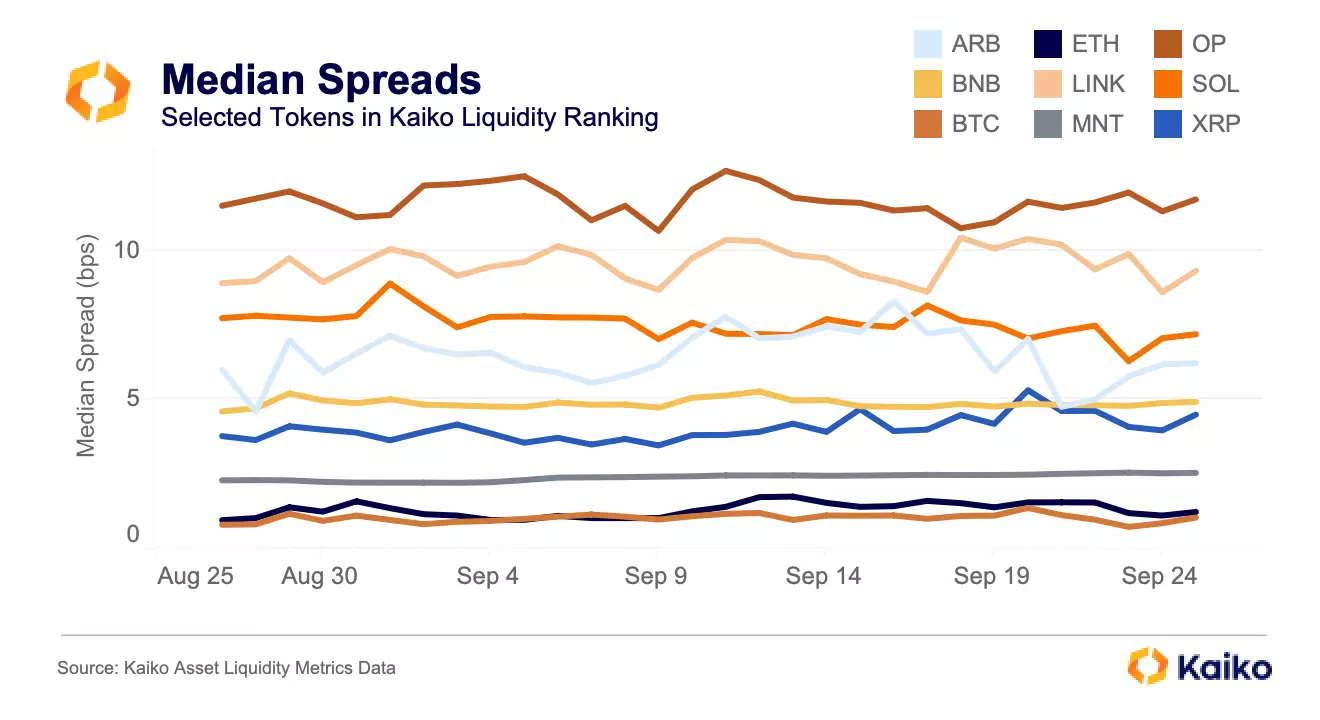
BTC and ETH are in a league of their own (with ETH briefly having tighter spreads in early September), but MNT is in 3rd by a substantial margin. Most of the tokens surveyed fell in the 5 to 15 bps range. To address tokens like MNT and BNB, whose liquidity is extremely concentrated, we added a liquid exchange component.
Liquid Exchanges
Using a simple formula based on a token’s market cap and 0.1% market depth [1], we found the number of liquid centralized exchanges for each token. The rationale here is that, in a world where exchanges sometimes have downtime, it’s important for a token to be traded on multiple liquid venues. A greater number of liquid exchanges for a token also makes things like oracle manipulation more difficult.
As expected, older and more established tokens tended to do the best. Note that exchanges with suspicious volumes or market depth have been removed from the dataset entirely (they do not factor into the volume or depth components either).
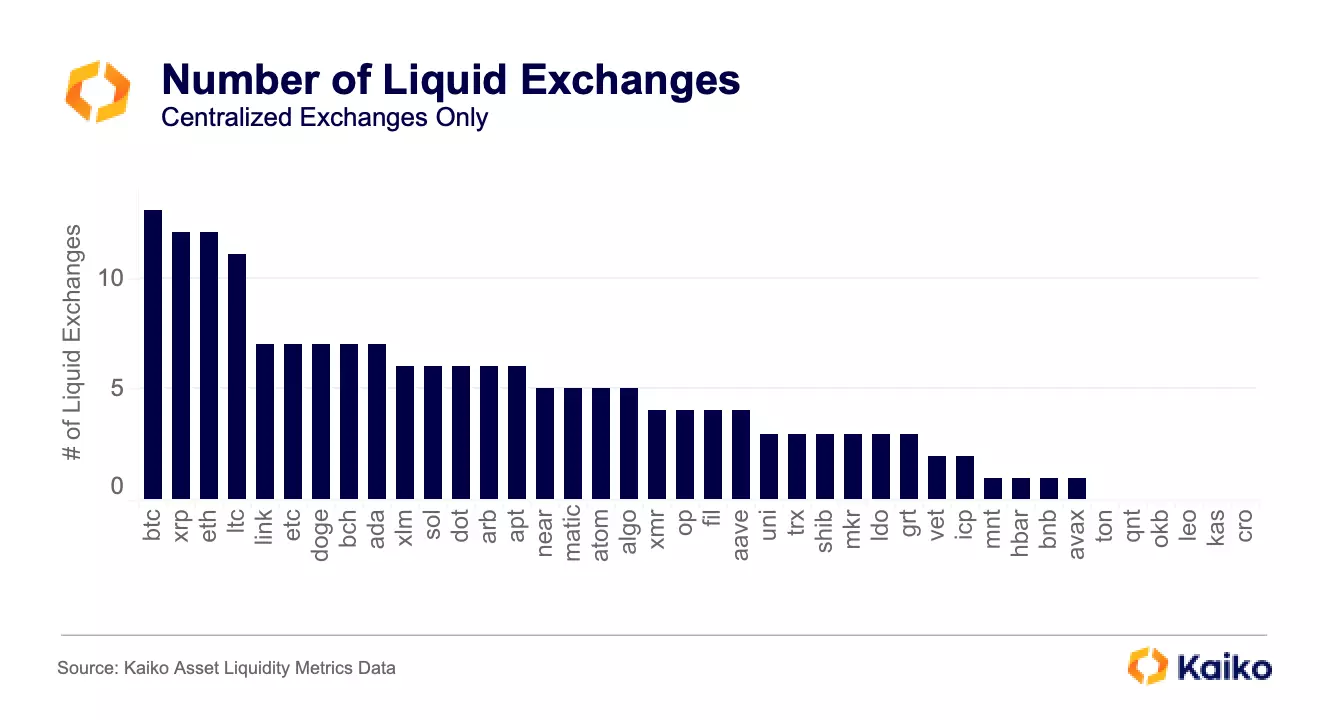
BTC, ETH, XRP, and LTC were at the top of this metric by a substantial margin. XRP benefited greatly from a beneficial court ruling in the Ripple and SEC case that prompted major U.S. exchanges Coinbase and Kraken to re-list the token. By our metric, XRP was considered liquid on Binance, Kraken, Bitstamp, Coinbase, Bybit, Upbit, OKX, Kucoin, Bithumb, Bitfinex, Independent Reserve, and BtcTurk.
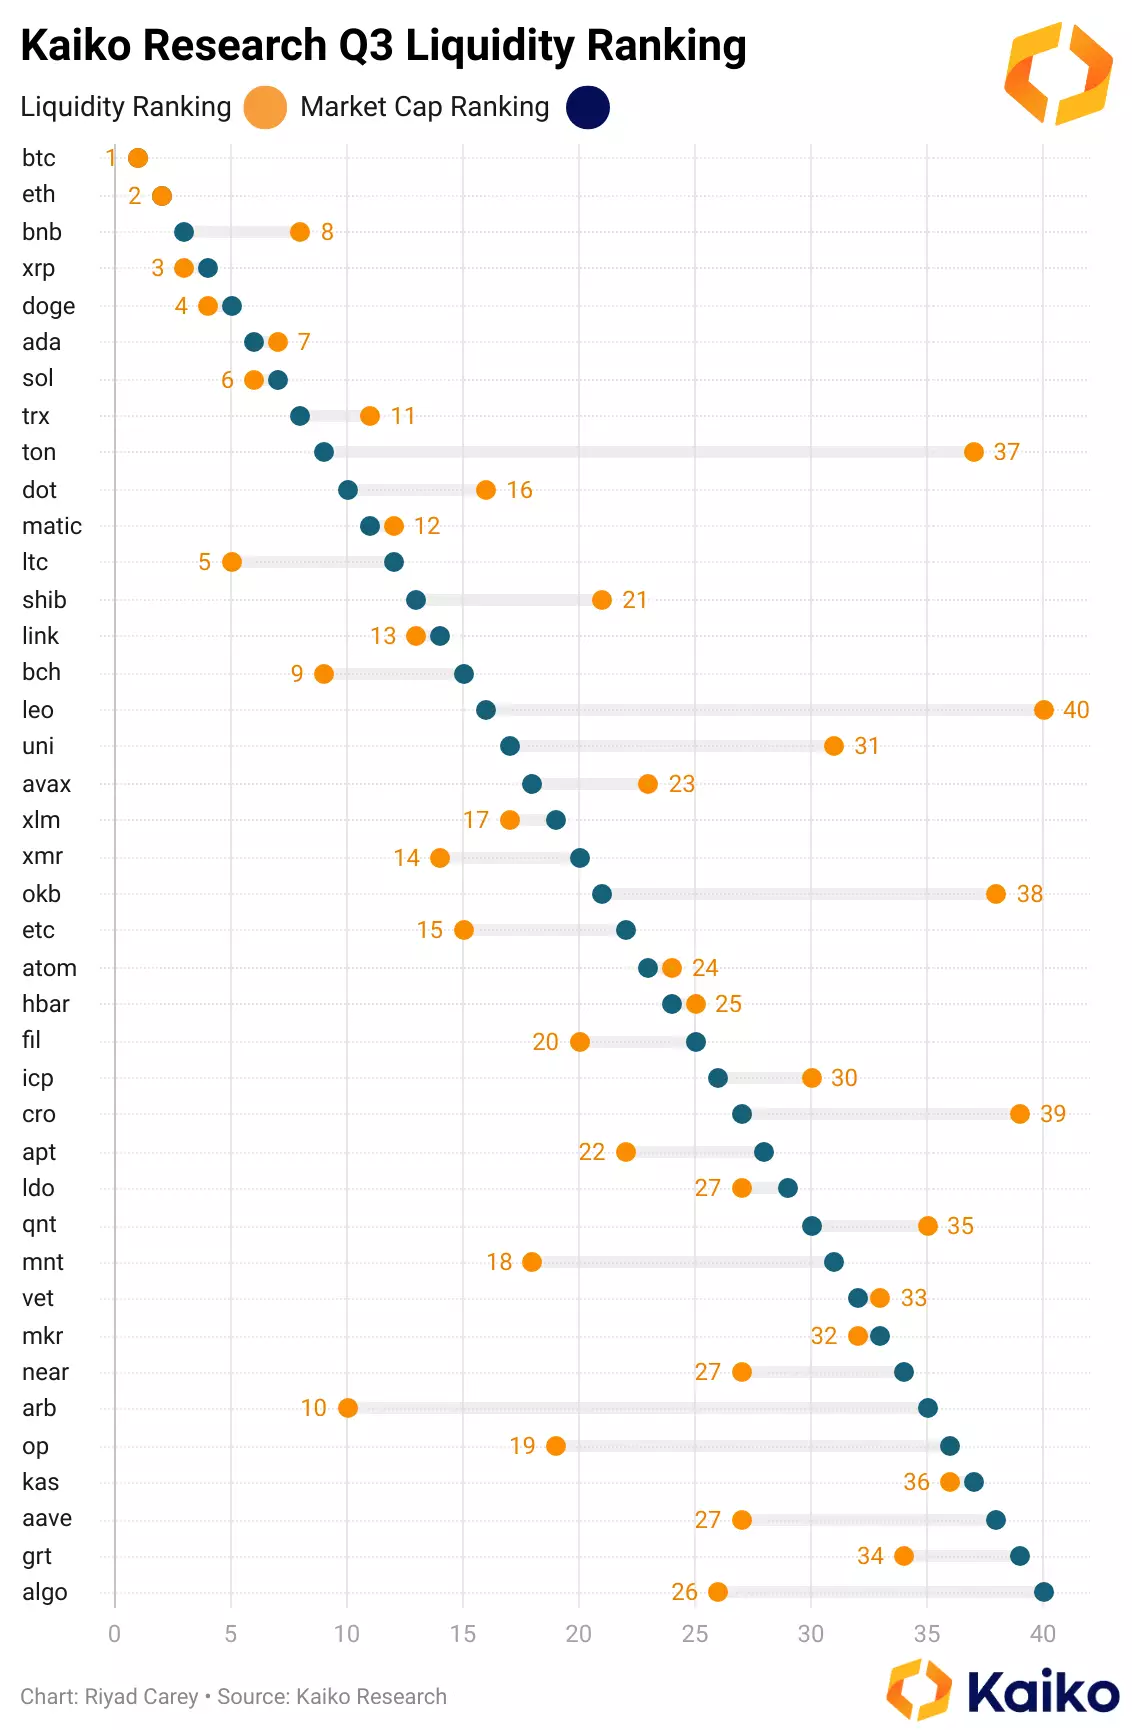
As mentioned above, BNB is 3rd by market cap but is only liquid on Binance. Notably, TON – 9th by market cap – has zero liquid exchanges; its highest volume pair is on HTX (formerly Huobi), which has been removed for suspected wash trading, and its most liquid pair (on OKX) doesn’t meet our criteria to be considered liquid.
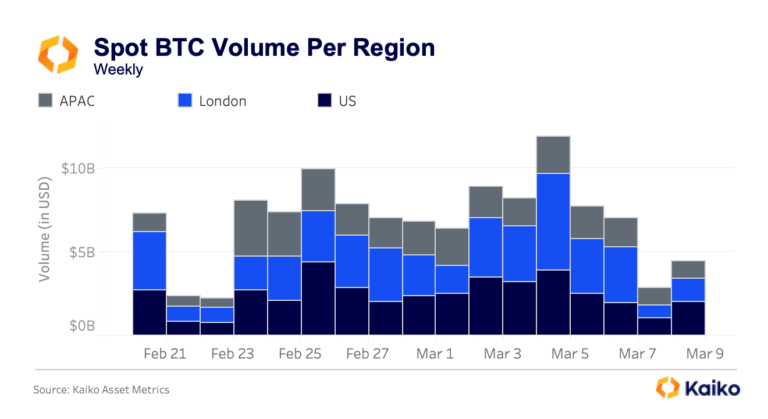
Volumes
Again, BTC, ETH, and XRP make up the top three of this metric, followed distantly by SOL, DOGE, LTC, BCH, and BNB.
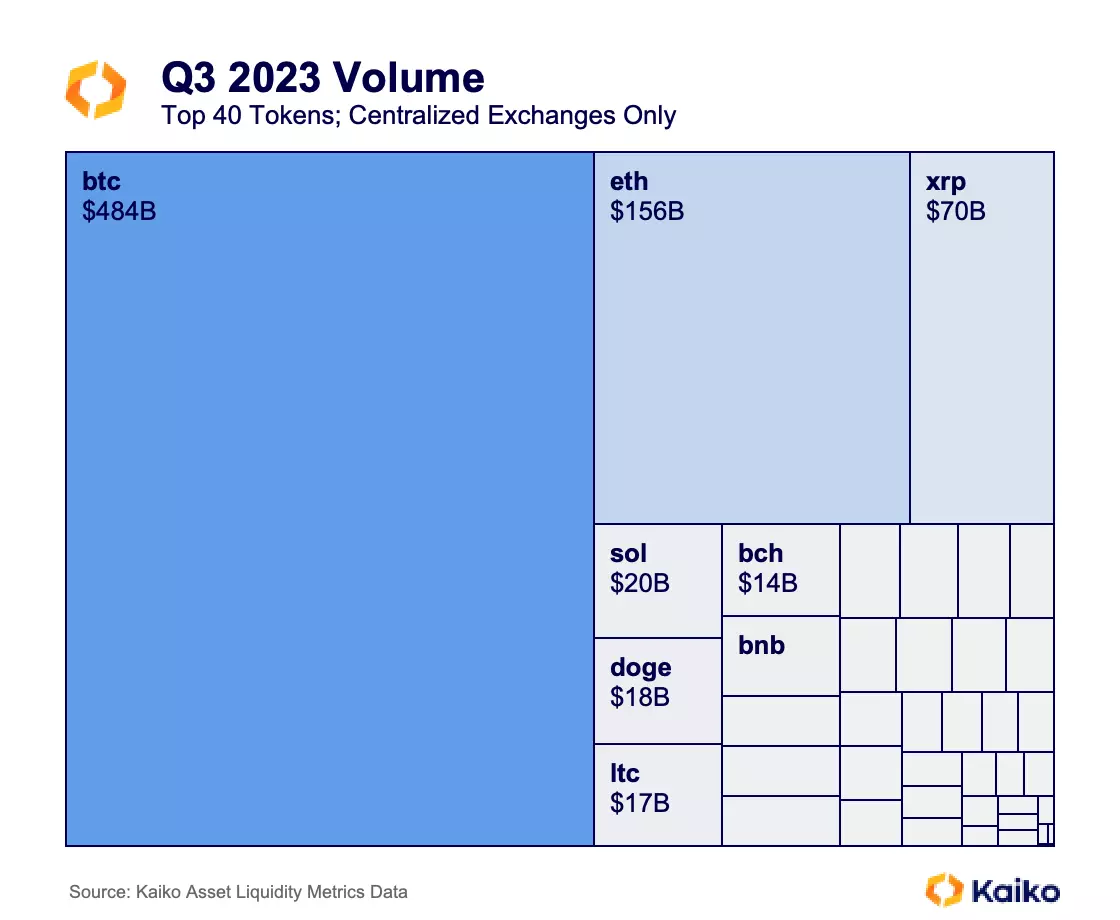
Volumes are critical for liquidity, forming a self-sustaining cycle in which market makers are more willing to provide liquidity for tokens with more volume. This has been the slowest quarter volume-wise since the early bull market in 2020.
market depth
Finally, the ranking considers market depth, or the value of the bids and asks within a certain percentage of the mid price. The chart below shows both 0.1% and 1% market depth over the course of the quarter, split between the top two and all other tokens.
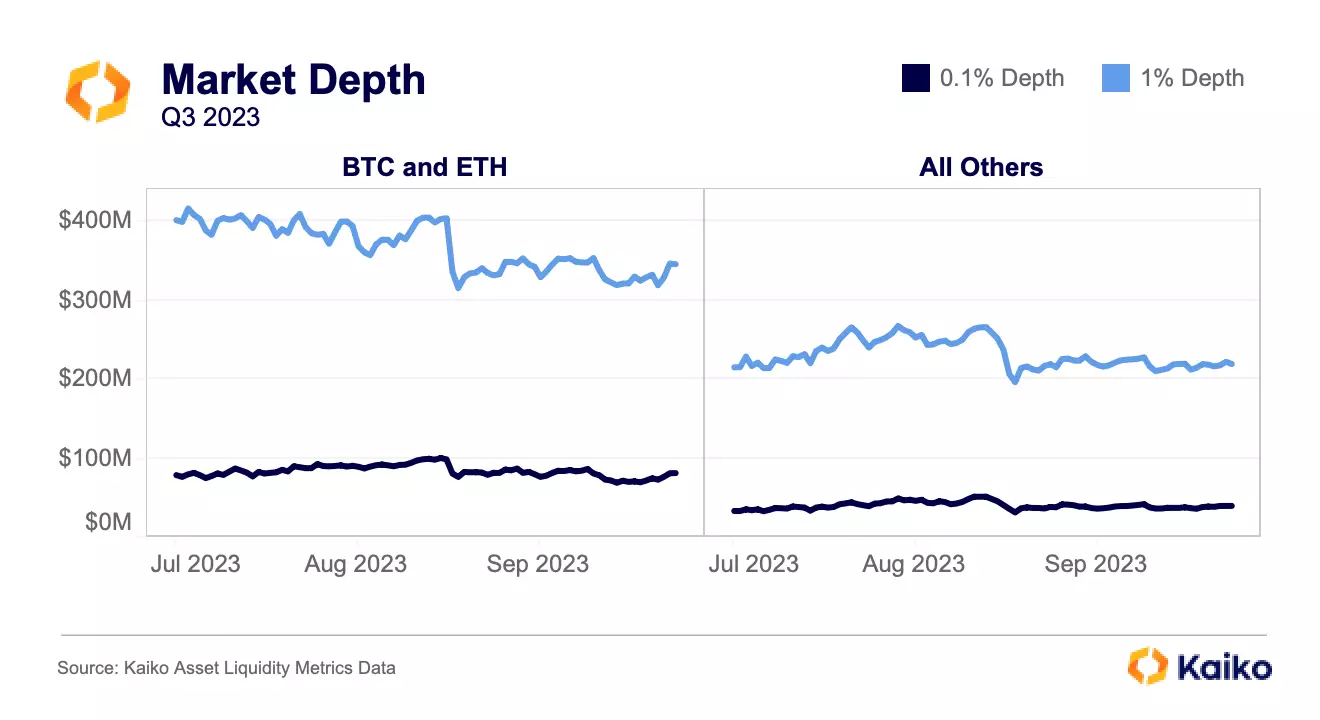
BTC and ETH’s 1% depth has fallen significantly since the start of the quarter, down from $400mn to under $350mn, punctuated by a near-$100mn drop from August 16 to August 18; 0.1% depth fell from $100mn to $75mn in those two days. Meanwhile, altcoin liquidity is nearly identical to where it was at the start of the quarter, with a slight increase from $215mn to $219mn. Altcoins’ 0.1% depth also improved, from $33mn to $39mn.
The reshuffling of altcoin liquidity lends credence to the sentiment that altcoin trading has become a zero-sum game. One token begins to pump and volume and liquidity chase that token and abandon others, sinking the abandoned tokens’ price, volume, and liquidity. This has been a constant cycle throughout the bear market because there is not enough money flowing into the space to support consistent gains across a wide breadth of tokens.
Conclusion
Metrics such as market capitalization and fully diluted value provide an incomplete story. We believe that metrics like volume, market depth, and the number of liquid exchanges are significantly better indicators for measuring a token’s true value. This was best demonstrated by FTT, whose market cap peaked at nearly $10bn without ever having liquidity that matched this theoretical value. In this vein, it is concerning to see that there are still exchange tokens with huge market caps and very poor liquidity. Notably, BNB’s liquidity is much better than these tokens, but still does not match up with its lofty market cap.
[1] Those who read my stablecoin depeg methodology Deep Dive know I’m a fan of thresholds. This is a simple one: if an exchange’s 0.1% market depth for a token is greater than the square root of the token’s market cap, it’s considered liquid.