The path to $100k for Bitcoin

Q2 Liquidity Ranking for Crypto Assets

Liquidity

29/06/2023

Welcome to Deep Dive!

This week we provide a Q2 update to our crypto asset liquidity ranking. The recent SEC lawsuits have directly impacted the liquidity of assets identified as securities, and our ranking breaks down the changes. We then compare each asset’s liquidity score to its market cap to spot the most misleading assets.

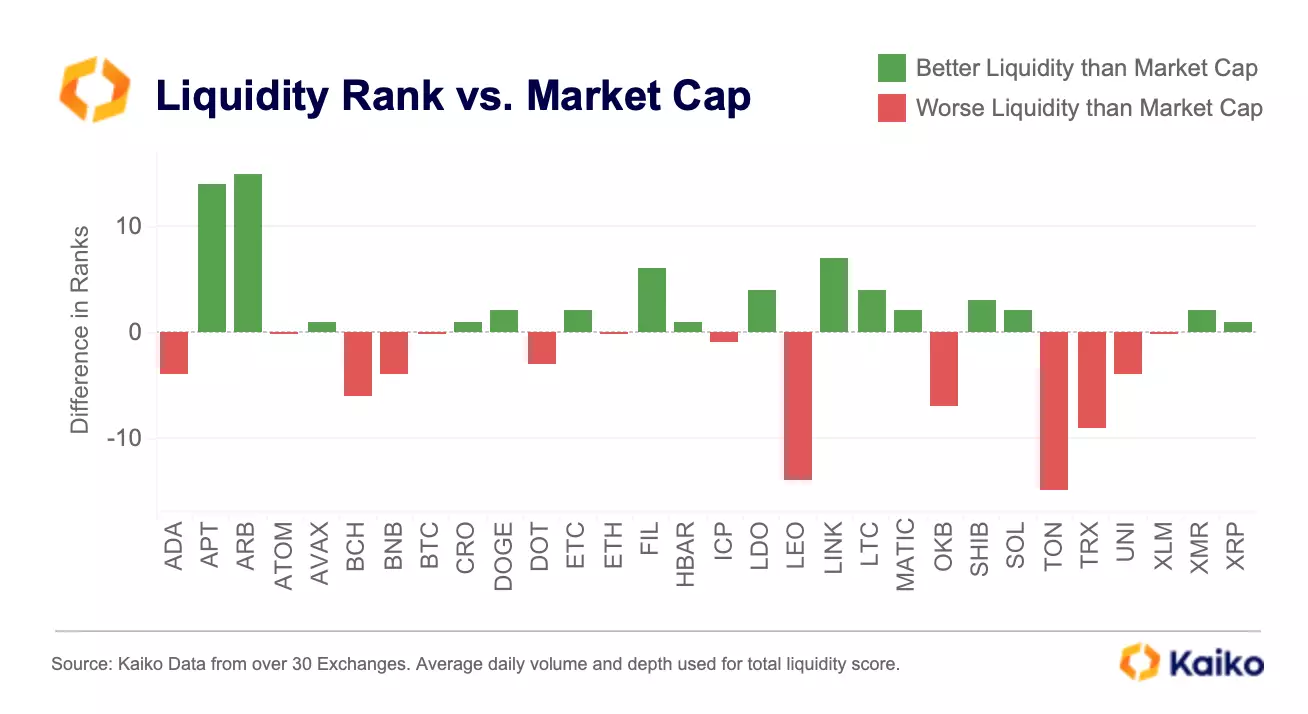
  • APT and ARB liquidity is better than their market cap suggests.

  • LEO, TON, TRX and OKB liquidity is far worse than their market cap suggests.

  • AVAX, SOL and XMR liquidity rank improved 7 spots each over the quarter.

  • ATOM, FIL and MATIC liquidity rank dropped the most over the quarter.

Towards the end of last year, I published the first liquidity ranking system for crypto assets, comparing each asset’s liquidity ranking to its market cap and investigating which token’s market cap is the most misleading from a liquidity standpoint. In Q1 of this year I provided an update to the ranking system as overall market liquidity hit 10 month lows.

The good news is that global liquidity has been more or less flat over Q2, with no further drops apart from the tokens featured in the SEC lawsuits and a handful of exchange-specific drops in liquidity, such as Binance.US.When liquidity is low, price volatility increases and so it is essential investors can accurately evaluate the liquidity of each individual asset to gain an understanding of how much short term volatility to expect. In this article, I’ll provide an update to the liquidity ranking model, highlighting any big movers from last quarter in the process.

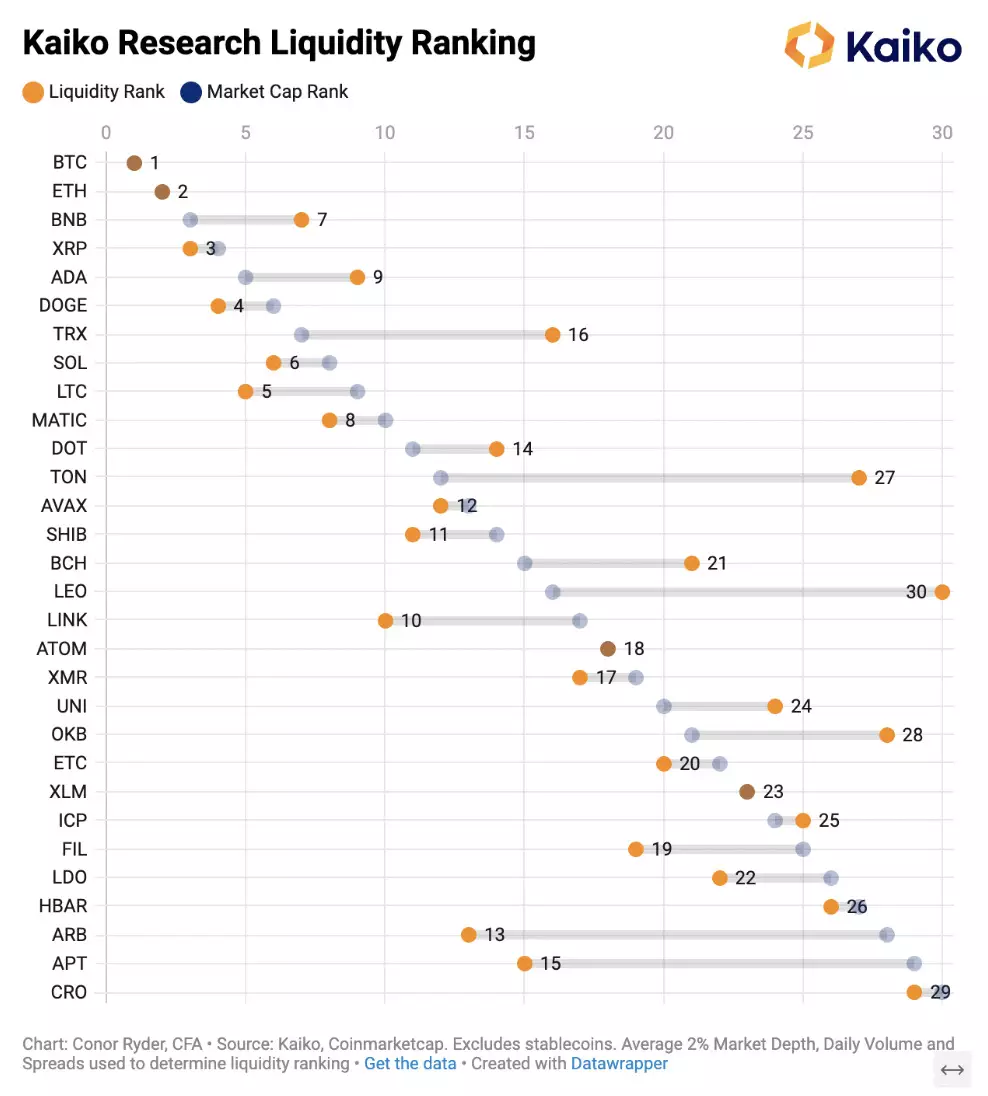
As always, before diving into each liquidity metric, the below chart offers an overall look at each asset’s liquidity rank (orange) compared to its market cap rank. If a token’s liquidity rank is to the right of center, it has a worse liquidity rank relative to market cap, and vice versa.

Never Miss a Deep Dive.

The Data

30 tokens were ranked by market capitalization, excluding stablecoins and wrapped tokens. For volume and market depth, Kaiko’s newest product, Asset Metrics was used, which allows us to improve upon our liquidity ranking system from last quarter. Last quarter, we only took the top 11 centralized exchanges for both depth and volumes, as well as only looking at pairs with a stablecoin as the quote asset. Asset Metrics allows us to look at over 35 exchanges and all pairs for that asset with a stablecoin or token as the quote asset – drastically improving the liquidity coverage we can provide, as well as making our ranking system more comprehensive and robust.

One important point to note – we have made the decision to remove spreads from the liquidity ranking model. Spreads vary too much between exchanges and pairs – we accounted for this in the past by just taking Binance spreads, but we can’t simply assume Binance is a proxy for the wider market anymore.

Market depth and volumes allow us to look aggregate across all exchanges and so those two metrics are the most important for liquidity analysis. The end goal is to make this ranking model as robust as possible and in order to do so we have removed spreads from our analysis.

1) Volumes

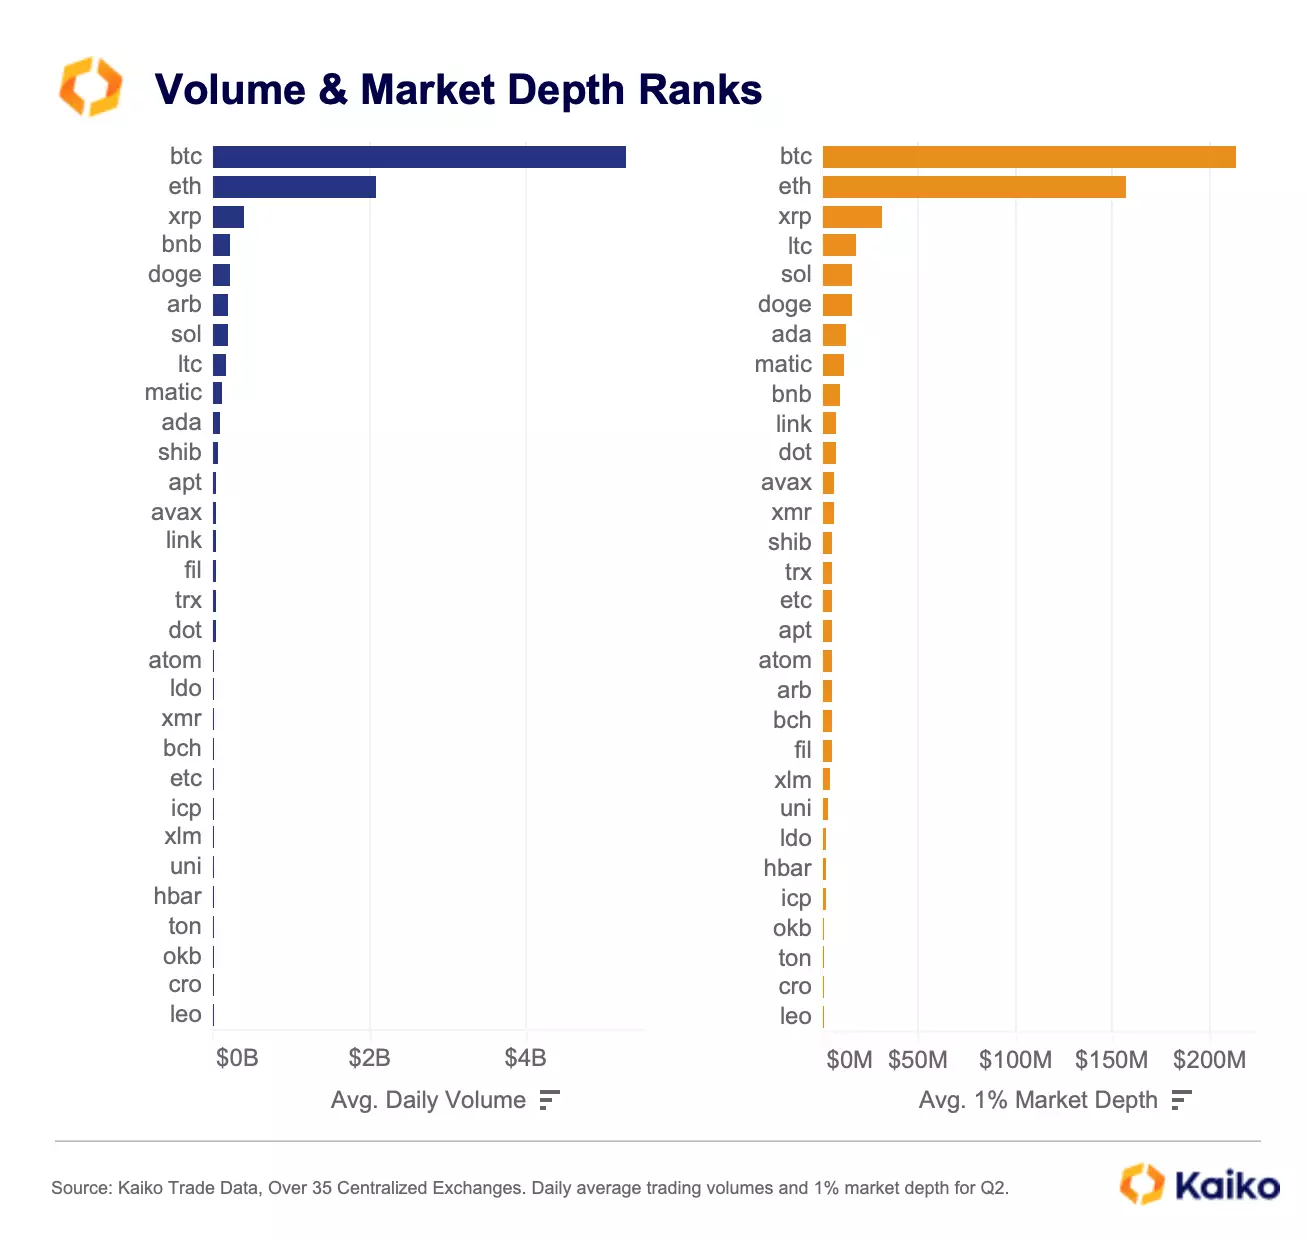
Volumes are strongly correlated to order book liquidity measures such as market depth and spread. Tokens that have higher trade volumes typically have deeper order books, which enables traders to trade an asset with limited impact on price. But, in crypto markets there can be discrepancies in this correlation. For example, wash trading or other types of market manipulation can make a token appear very liquid without having deep order books, which means that trade volume alone is not adequate to fully assess liquidity.

The standout tokens this quarter for volumes were:

  • XRP ranks third in volumes, up two places from last quarter as investors start to position themselves for the ruling in the SEC v Ripple case that is expected imminently. The token also saw a surge in volume on Korean exchanges.
  • ARB, the native token for the Layer 2 rollup Arbitrum, ranks 6th in volumes this quarter ahead of several Layer 1s. ARB ranking so high is particularly notable as it was a new entry to the liquidity ranking this quarter after its market cap pushed it into the top 30 tokens.
  • BCH (Bitcoin Cash) stands out for a lack of volumes, ranking 21st, particularly in light of the recent news that EDX, an exchange backed by Fidelity, Charles Schwab and Citadel Securities, named it as one of four tokens it will list on its exchange alongside BTC, ETH and LTC. BCH looks to be the odd one out from a volume standpoint.

2) Market Depth

Market depth considers the overall level and breadth of open orders and is calculated from the number of buy and sell orders at various price levels on each side of the mid price. In this analysis, 1% market depth is taken.

In the first iteration of the ranking system last year I used 2% depth, however when digging a bit deeper into market depth metrics I found evidence that some exchanges/tokens were purposely gaming the 2% depth figure. Some exchanges were clearly inflating the level of orders at that level, likely because big ranking websites started listing a 2% depth column. I found 1% to be a more accurate representation of depth with far less irregularities.

If market depth is “deep” for a given token, this means that there is sufficient volume of open orders on either the bid or ask side, which ultimately makes it easier to exchange the asset at prices reflecting its intrinsic value. The weaker a market’s depth, the easier it is for larger market orders to move the price.

The standout tokens above for market depth are:

  • FIL depth has been drastically reduced this quarter after being named as a security in the SEC lawsuit. Last quarter, it ranked 8th for market depth. This quarter it ranked a dismal 21st.
  • ATOM has suffered a similar fate after being named a security by the SEC, falling from a depth ranking of 13th last quarter, down to 18th this quarter.
  • Market makers continue their reluctance to offer depth for BNB, despite it being the native token of the most liquid exchange. BNB ranks 9th despite being the third largest non-stablecoin token by market cap.

Total Liquidity Score

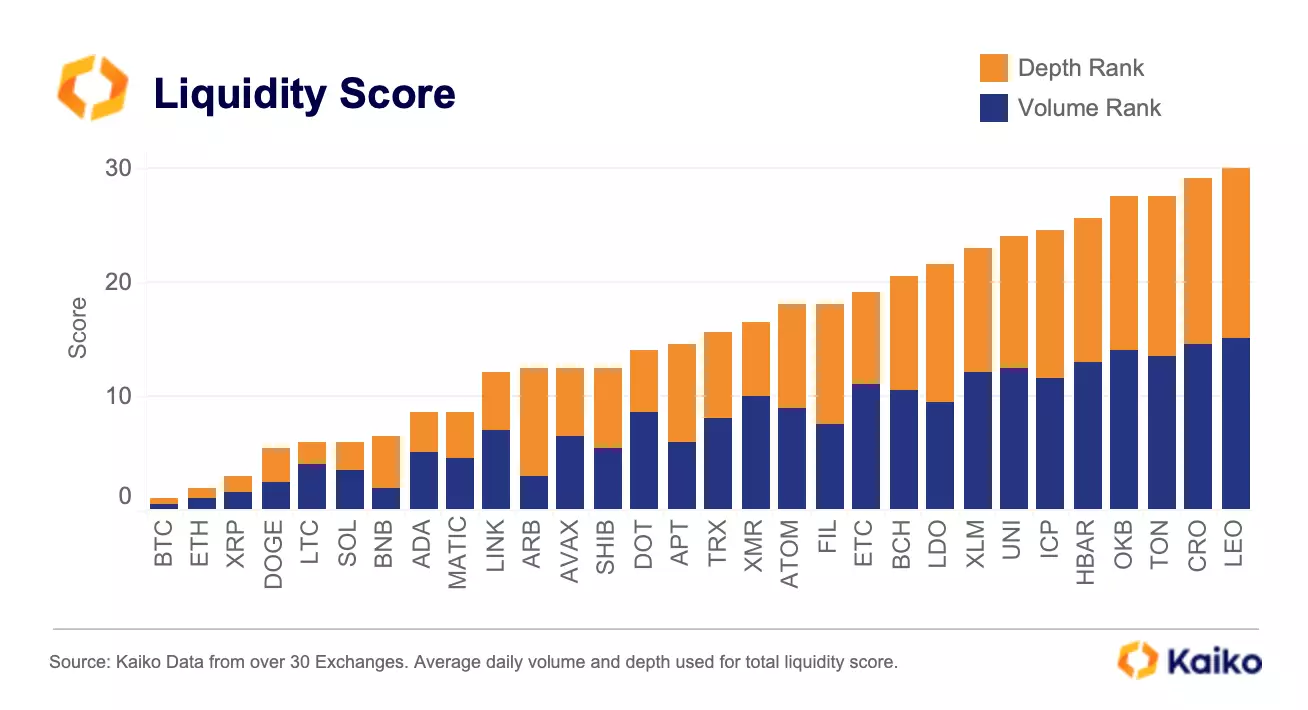
Combining the two key metrics for liquidity and getting an average rank across the two provides us with a liquidity score for each asset. The smaller the contribution of a metric towards its score the better its liquidity. The results are below:

For example, ARB scored well in its volume ranking with a small contribution to its overall score, however it was let down by its poor depth ranking.

Biggest Movers since Q1

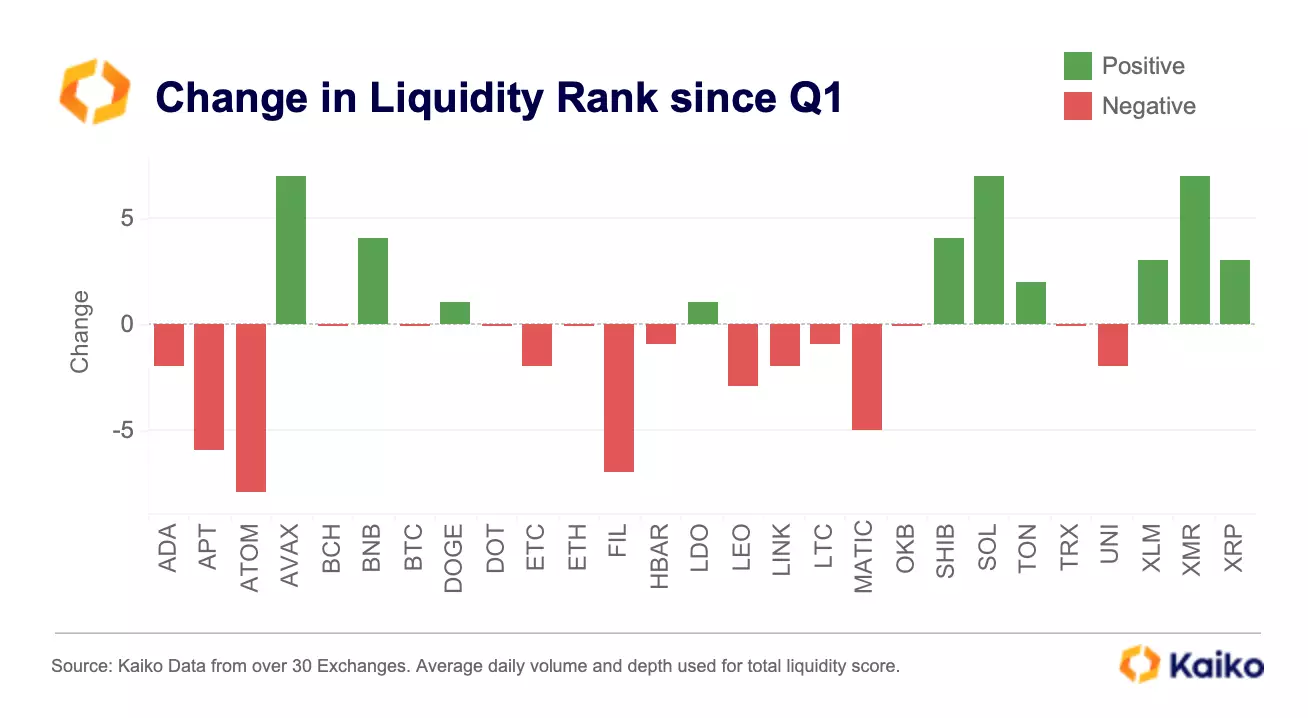
It’s important to look at the biggest changes to each asset’s liquidity score since Q1, in either direction.

Improved Liquidity:

  • AVAX liquidity rank improved 7 spots this quarter, up from 19th last quarter. AVAX seems to have avoided being listed as a security in the SEC lawsuits which has seen its liquidity improve relative to other tokens who may have been named.
  • SOL moved up 7 places as well, up from 13th last quarter to 6th this quarter in an impressive jump for a token the SEC alleged is a security.
  • XMR (privacy coin) was also up 7 spots from 24th to 17th thanks to a big improvement in its depth ranking since last quarter.

Worsening Liquidity:

  • ATOM had a big drop in liquidity rank, ranking 18th in both volumes and spreads as market makers react to it being named as an alleged security by the SEC .
  • FIL has also been impacted by SEC lawsuits, losing 7 spots in its liquidity ranking since last quarter with a marked decrease in depth.
  • MATIC, the native token of the Layer 2 Polygon network, was another victim of the SEC lawsuit after ranking an impressive 3rd in our ranking last quarter. MATIC moved down 5 spots to 8th over the quarter.

Liquidity Rank vs. Market Cap

Now, tying this all together, we arrive at the first chart I included in this article, comparing each asset’s liquidity rank to its market cap rank. The below chart visualizes this another way, showing the difference between the two ranks.

Notable Outliers:

  • APT, the native token of the Aptos blockchain network, again has liquidity that far exceeds its market cap. This time, however, it is edged out by the new entry to the ranking, ARB, in terms of liquidity relative to its size. We can conclude ARB and APT are two of the most liquid tokens for their size and should benefit from less volatility as a result.
  • LEO, TON, TRX and OXB performed poorly yet again with no improvement in liquidity. These are some of the most misleading tokens for investors who might assume their market cap is correlated to their liquidity – exchange tokens consistently seem to be the most misleading.

Takeaways

I’ve said the same thing for the last three liquidity ranking updates: simply assuming a token is as liquid as its market cap suggests is lazy and negligent. This liquidity ranking hopefully serves as a first step in rectifying some of the incorrect mental models investors use when assessing token risk. As we have seen from LEO, TON, OKB and TRX, there are some huge outliers that can mislead investors who use market cap as a proxy for liquidity. These outliers highlight the need for investors to incorporate liquidity management as part of their investment process, particularly in the low liquidity environment in which we find ourselves now.

Data Used In This Analysis

More From Kaiko Research

  • Memecoins

    18/11/2024 Data Debrief

    Attention Shifts to Meme Tokens

    Bitcoin maintains a strong momentum despite whipsawing either side of $90k over the weekend, after briefly surpassing $93K last week. Meanwhile, Bitwise filed for a multi-crypto ETF and SEC Chair Gary Gensler hinted at resigning.

  • Bitcoin

    14/11/2024 Deep Dive

    The path to $100k for Bitcoin

    This week, we’re diving into the anatomy of BTC’s latest rally and its broader market implications. On Wednesday, BTC surged past $93K as post-election momentum gained traction. Meanwhile, memecoins are booming following the announcement of the creation of D.O.G.E., the U.S. Department of Government Efficiency.

  • Bitcoin

    11/11/2024 Data Debrief

    Bitcoin Breaks Above $80K

    Bitcoin broke above $80K over the weekend after Donald Trump’s U.S. election win last week spurred a broad market rally. ETH is also up by over 30% since November 5, outpacing BTC for the first time in months. Meanwhile, a consortium of crypto companies launched a USD-backed stablecoin, and the U.S. SEC delayed its decision on spot ETH ETFs options.

  • Bitcoin

    04/11/2024 Data Debrief

    2024 US General Election Special

    Ahead of the US election, this week we’re revisiting the topic as a follow-up to our Deep Dive coverage from last week. We’ll examine key metrics to monitor as the election night approaches and explore the following: