Join us for our latest webinar in collaboration with Cboe
Q1 Liquidity Ranking For Crypto Assets
Welcome to Deep Dive!
This week we are providing a Q1 update to our Liquidity Ranking Model for Crypto Assets, highlighting the winners and losers along the way.
-
DOGE volumes and liquidity pick up
-
BTC and ETH remain most liquid with biggest market caps
-
DOT volumes remain remarkably low in Q1
-
BNB depth is lower relative to market cap rank
Last quarter I published the first liquidity ranking system for crypto assets, comparing each asset’s liquidity ranking to its market cap and investigating which token’s market cap is the most misleading from a liquidity standpoint. Liquidity has arguably never been at more of a premium than right now in crypto, with USD payment rails being shut down and market makers pulling orders from exchanges. With market depth at 10 month lows, price volatility has picked up and so it is essential investors can accurately evaluate the liquidity of each individual asset to gain an understanding of how much short term volatility to expect. In this article, I’ll provide an update to the liquidity ranking model, highlighting any big movers from last quarter in the process.
As always, before diving into each liquidity metric, the below chart offers an overall look at each asset’s liquidity rank (orange) compared to its market cap rank. If a token’s liquidity rank is to the right of center, it has a worse liquidity rank relative to market cap, and vice versa.

Never miss an analysis.
Subscribe to our free weekly Data Debrief email, or learn more about our premium research subscriptions here.
The Data
29 tokens were ranked by market capitalization, excluding stablecoins and wrapped tokens. For volume and market depth, data was aggregated across all active USD, BUSD, USDT, and USDC-denominated pairs on 11 of the most liquid centralized exchanges. This encompasses a majority of market activity.
For spreads, only data from Binance is used, which is the most liquid exchange across the widest range of markets. This is due to the problems that outliers can cause when taking an average spread. For example, just one illiquid market would cause the average spread to skyrocket, which wouldn’t reflect the token’s true liquidity.
As a final note, this liquidity analysis is still in its early iterations, and we are open for feedback. The following three criteria were used to arrive at a liquidity rank for each token:
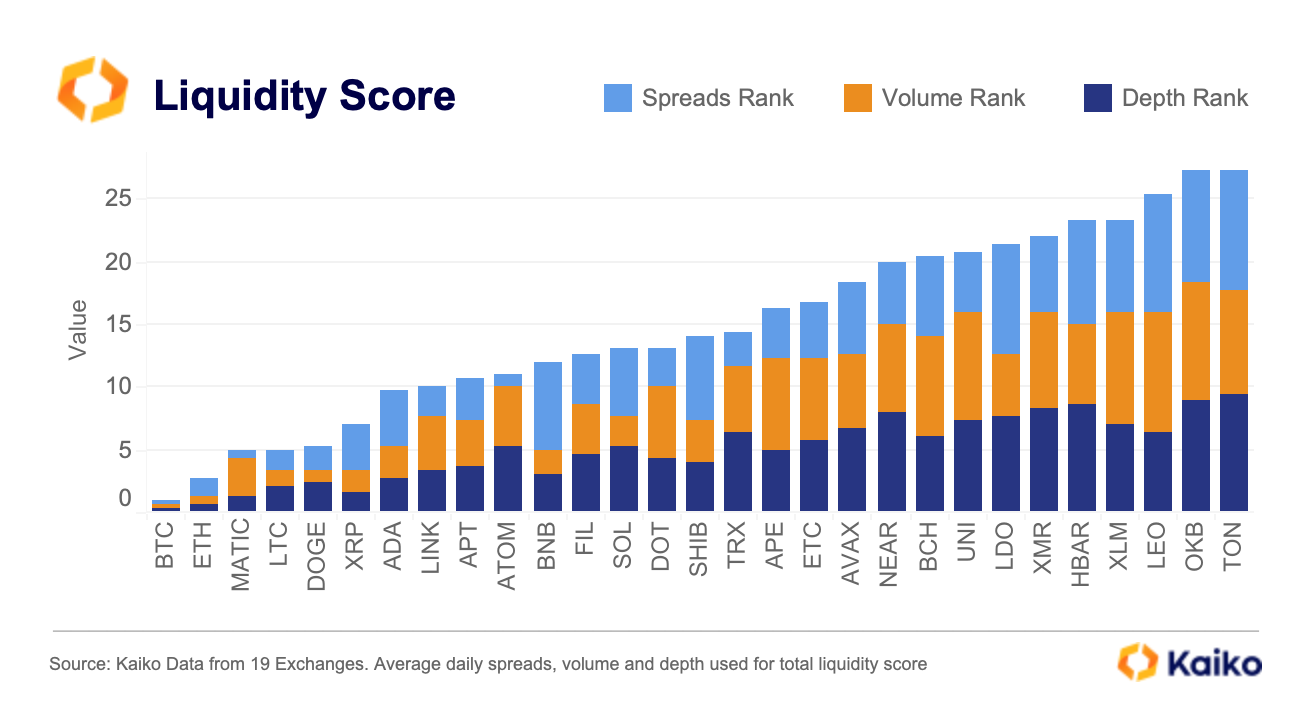
1) Volumes
Volumes are strongly correlated to order book liquidity measures such as market depth and spread. Tokens that have higher trade volumes typically have deeper order books, which enables traders to trade an asset with limited impact on price. But, in crypto markets there can be discrepancies in this correlation. For example, wash trading or other types of market manipulation can make a token appear very liquid without having deep order books, which means that trade volume alone is not adequate to fully assess liquidity.
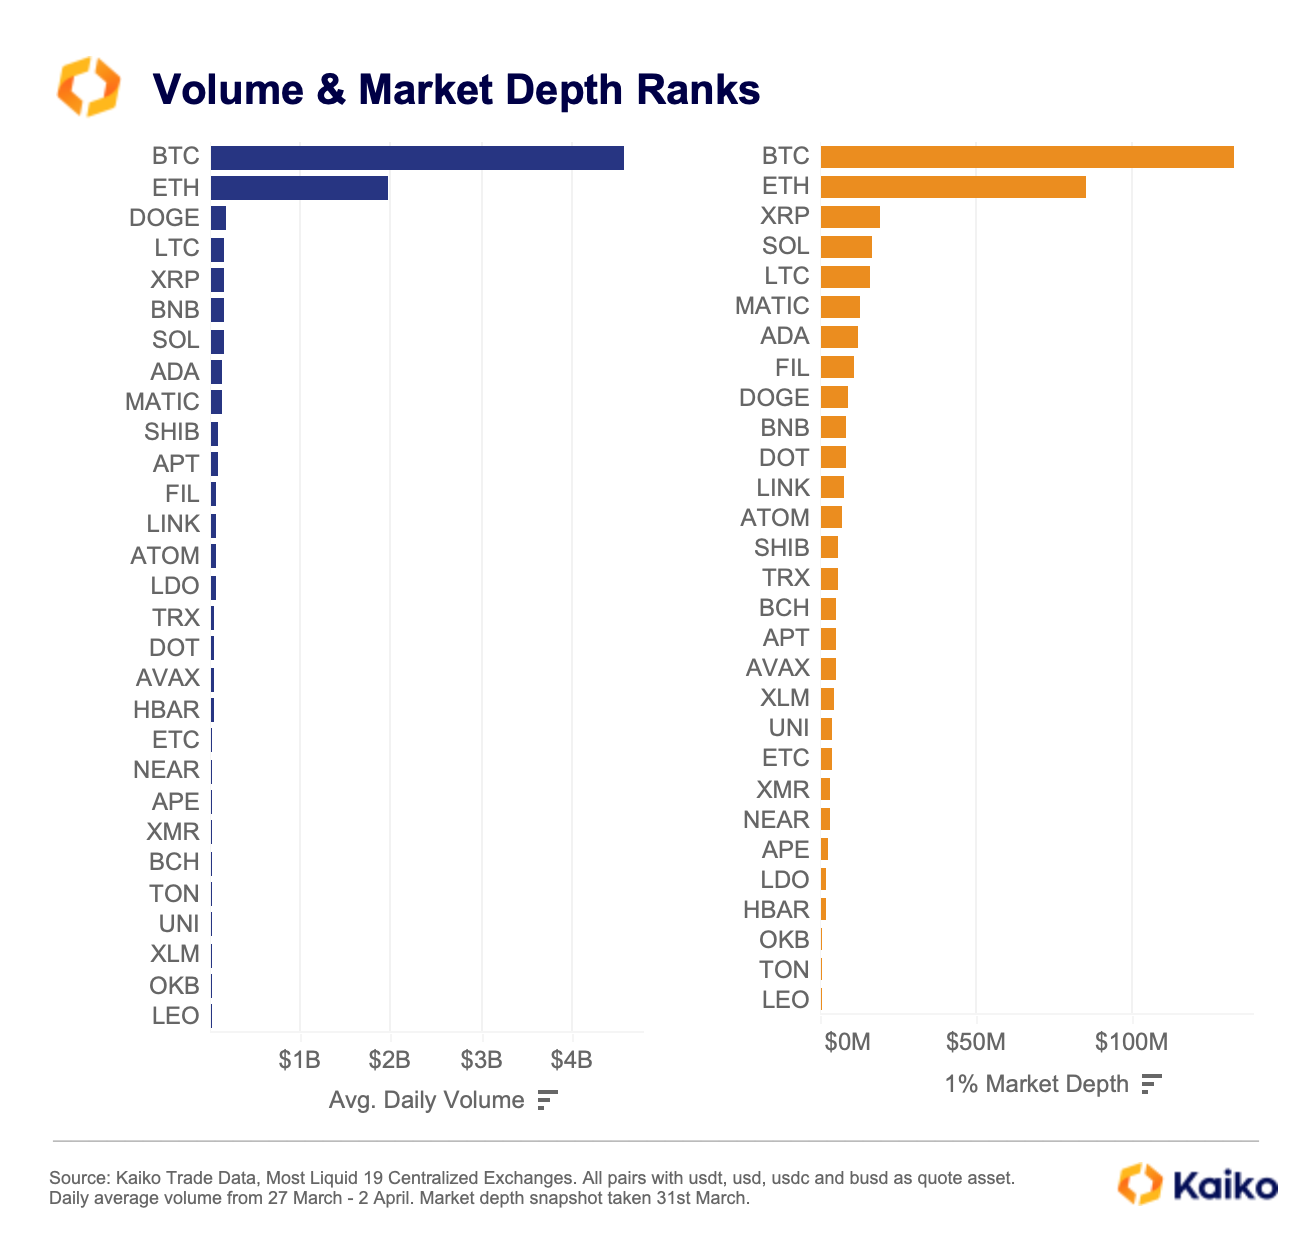
The standout tokens this quarter for volumes were:
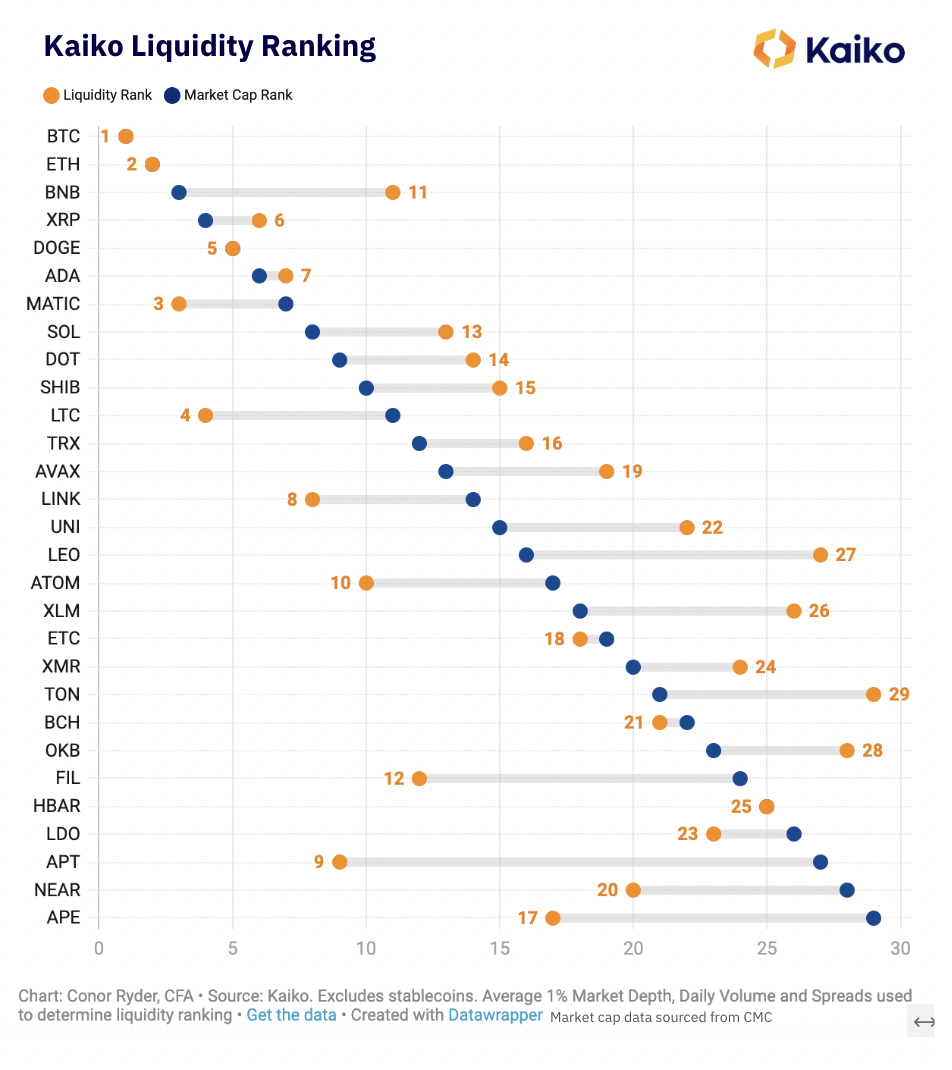
- DOGE volumes picked up to start 2023 and rank in an impressive third ahead of several larger cap tokens.
- LTC volumes also impress, ranking fourth despite having a market cap ranking of 11, excluding stablecoins. The cautionary note with LTC volumes is that earlier this year I found some examples of LTC wash trading on Bitforex so the volume figure alone is not enough to conclude that LTC is particularly liquid.
- DOT volumes were remarkably low in the first quarter of 2023 compared to some of its competitors of a similar size market cap. DOT ranked 17th in volumes.

2) Market Depth
Market depth considers the overall level and breadth of open orders and is calculated from the number of buy and sell orders at various price levels on each side of the mid price. In this analysis, 1% market depth is taken.
Last quarter I used 2% depth, however when digging a bit deeper into market depth metrics I found evidence that some exchanges/tokens were purposely gaming the 2% depth figure, inflating the level of orders at that level, likely because big ranking websites started listing a 2% depth column. I found 1% to be a more accurate representation of depth with far less irregularities.
If market depth is “deep” for a given token, this means that there is sufficient volume of open orders on either the bid or ask side, which ultimately makes it easier to exchange the asset at prices reflecting its intrinsic value. The weaker a market’s depth, the easier it is for larger market orders to move the price.
The standout tokens above for market depth are:
- SOL depth improved relative to other tokens since last quarter. In our last ranking, SOL ranked 9th in market depth. This month, SOL comes in at an impressive 4th.
- BNB depth is surprisingly low again, considering it is the native token of the most liquid exchange, remaining in tenth despite being the third largest non-stablecoin token.
3) Spreads
In traditional finance, the bid-ask spread is the most frequently used indicator when assessing a market’s liquidity. The spread is calculated by taking the difference between the best bid and the best ask on an asset’s order book at a moment in time. Spreads in cryptocurrency markets are more fragmented as each exchange offers different incentives to liquidity providers which impact the spreads offered. As a result, I have taken Binance as a barometer for overall market spreads. This month, we had a significant shift in market structure on Binance with the removal of zero fees for all BTC pairs except TUSD, which we wrote about in some detail recently.
Typically, the smaller the spread the more liquid the market. Wide spreads indicate that liquidity is weaker for an asset, and that it will be more difficult to exchange the asset at stable prices, making it an important metric when assessing the overall liquidity of an asset from an investment standpoint.
Despite the removal of fees on Binance and resulting change in spreads, only BTC was impacted, which already ranked first even before the change.

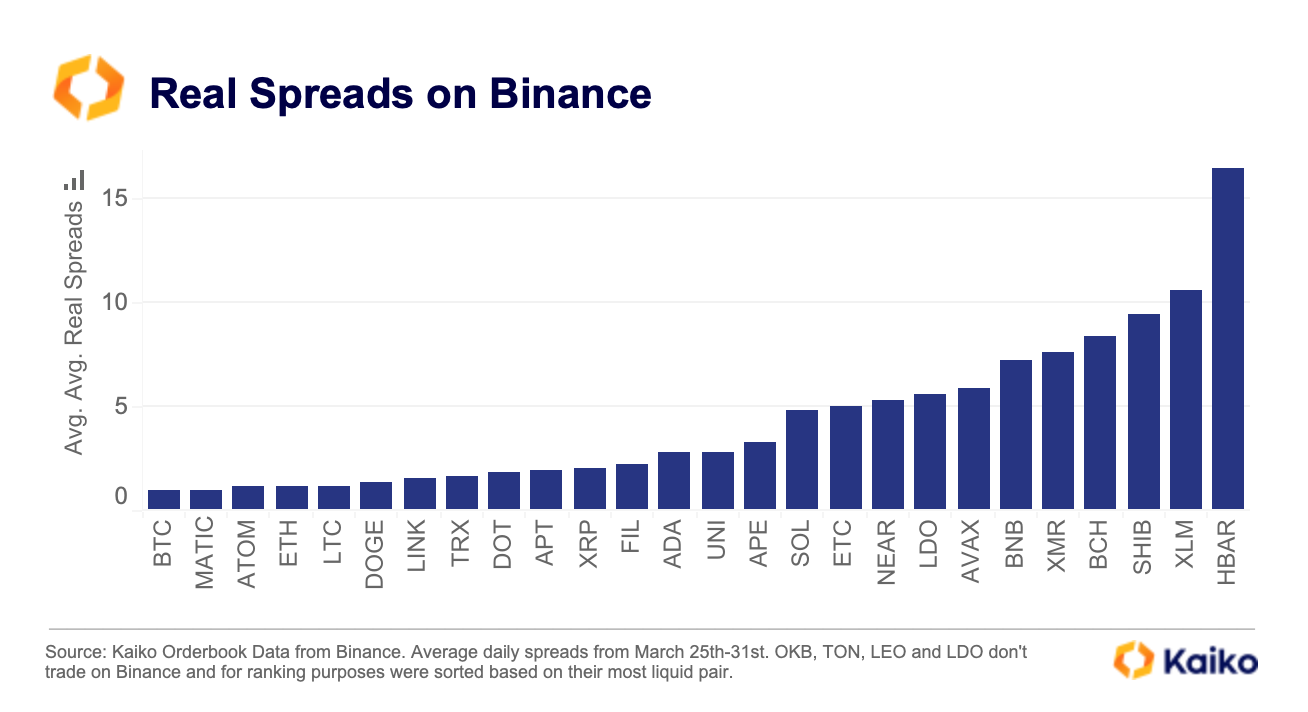
The standout tokens from a spreads point of view are:
- MATIC impresses again from a liquidity standpoint, ranking second in spreads moving up from fourth last quarter.
- BNB disappoints again, ranking a dismal 21st in spreads on its own exchange.
- SOL spreads also underwhelm, ranking 16th despite being the 8th largest non-stable token by market cap.
Total Liquidity Score
Combining the three metrics for liquidity and getting an average across the three provides us with a liquidity score for each asset. The smaller the contribution of a metric towards its score the better its liquidity. The results are below:

For example, XRP scored quite well in both volumes and depth, but was let down by a higher (worse) spread ranking. ATOM performed average in volumes and depth but was helped by its third place ranking in spreads.
Biggest Movers
As it is the first update to the liquidity ranking, we have some movers in both directions. |

Improved Liquidity:
|
Worsening Liquidity:
|
Liquidity Rank vs. Market Cap
Now, tying this all together, we arrive at the first chart I included in this article, comparing each asset’s liquidity rank to its market cap rank. The below chart visualizes this another way, showing the difference between the two ranks. |

Notable Outliers:
- APT liquidity far exceeded its market cap, implying that it is one of the most liquid tokens relative to its size and should benefit from less volatility as a result.
- LEO & BNB are raising some more concerns about exchange tokens, with far outsized market caps relative to their liquidity – a similar situation to FTT who’s illiquidity played a role in the collapse of FTX.
Takeaways
As I said last quarter, simply assuming a token is as liquid as its market cap suggests is lazy and negligent. This liquidity ranking shows us some major outliers where tokens can be far less liquid than their size implies, and in some cases can be surprisingly liquid for their size. While not completely foolproof, as evidenced by potential LTC and FIL wash trading on Bitforex, this liquidity ranking is the first step in a much needed robust liquidity analysis for crypto assets. With liquidity being more in demand than it has been in a long time, liquidity metrics are only becoming more relevant for investors. Outliers such as DOT, BNB, and LEO highlight the need for investors to carefully consider the liquidity of their holdings as part of both the investment process and ongoing risk management of positions.
Data Used In This Analysis
More From Kaiko Research
Derivatives
22/12/2025 Data Debrief
Crypto in 2026, What Breaks, What Scales, What ConsolidatesCrypto markets enter 2026 in a markedly different position than in prior cycle transitions. Rather than resetting after a speculative peak, the market appears to be progressing through a phase of institutional consolidation.
Written by Thomas Probst
Year in Review
01/12/2025 Data Debrief
Kaiko Research's Top 10 Charts of 2025In this report, we look back on 2025 and the key forces that shaped markets. From BTC record highs and fleeting altcoin rallies to major liquidation events and evolving regulation, we examine what shaped a seminal year for crypto.Written by Adam Morgan McCarthy
Stablecoin
24/11/2025 Data Debrief
MiCA's Impact on Crypto in EuropeEurope is progressing with a conservative structured crypto framework that leans towards regulating innovation.Written by Adam Morgan McCarthy
Macro
17/11/2025 Data Debrief
Navigating Fed Fears & AI Bubble BurstingGiven the current macroeconomic context, we are seeing the emergence of two major risks likely to have a decisive impact.
Written by Adam Morgan McCarthy