New Report: LATAM's rise in global crypto markets

How to Spot Artificial Volume

Welcome to Deep Dive!
Often times investors are left scratching their heads when they see a small exchange high up the volume ranking on certain websites. The assumption is that some, or a significant amount of these volumes figures are artificially inflated by wash-trading on that exchange. This week, we present a framework that can be used to spot cases of wash-trading, pointing out potential examples of our own on the way.
-
Presenting four tools to spot wash trading
-
Market/Depth Ratio can be used to spot red flags and fake volumes
-
Tick trade analysis used to spot potential wash trading on Bitforex
-
Wide spreads can help identify pairs with fake liquidity
Wash trading was at one point a pervasive problem in cryptocurrency markets. Today, most major exchanges have strict anti-wash trading measures, which has drastically reduced the problem since the ICO-led trading boom of 2017–18. Yet, due to the relatively low barriers to entry for launching an exchange, this type of market manipulation is far from eradicated on lesser-known, unregulated venues.
In this article I’ll present some shortcuts for identifying artificial volumes that can hopefully help investors better understand the venues they use.
Never Miss a Deep Dive.
Why Wash Trade?
Wash trading is the process of artificially boosting volumes by buying and selling an asset at the exact same time on an exchange. So why would an exchange or token project want to artificially boost volumes?
Ranking websites like Coinmarketcap and CoinGecko are widely used in crypto and are often the first place investors go to find volume figures for a token or an exchange. Even the most crypto-savvy people are often left stumped by some of the exchange names that can appear at the top of volume ranks.
An exchange that appears high on ranking sites thanks to volumes will appear to be more successful and trustworthy, attracting not only more users, but also more tokens looking to list on an exchange. Token listing fees paid to exchanges are not cheap and have been known to be in the millions. In a bear market, these fees can be significant for smaller exchanges who are struggling to earn revenues via trading fees.
While an exchange has a responsibility to ensure this type of behavior doesn’t happen on their platform, token projects are also incentivized by high volumes for similar reasons. A token ranked highly by trade volume could entice more investors.
The good news is that most ranking websites have implemented exchange rankings and data reliability scores, which has protected countless traders. Nonetheless, when you filter on trade volume, you still get unexpected results.
Now, let’s zoom in on a few metrics for assessing the quality and reliability of exchange volume data.
1) Volume/Depth Ratio
The first port of call for spotting suspicious volume activity should be a ratio using volumes and market depth. In my research, this is one of the fastest ways to spot any red flags for high asset volumes on an exchange. As I’ll discuss shortly, this isn’t a foolproof indicator as some high volume pairs can be driven by organic demand, but it does help us to spot any potential red flags that warrant further investigation.
Market depth is the number of bids and asks placed on an exchange’s order book within a certain percentage of the price, representing actual liquidity sitting ready to be filled on an exchange. Due to the fact some exchanges are prone to inflating volumes, market depth is a far more reliable proxy for true liquidity. By using it in a ratio with volumes, we can spot any outliers that have outsized volumes compared to depth on an exchange, indicating that true liquidity for that pair is lower than volumes imply. This allows us to quickly identify any exchanges we should have on our radar for suspicious data.
Before we dive into these ratios, it is worth noting that I used 1% market depth here for a very important reason. The aforementioned ranking websites recently published 2% depth metrics alongside volumes in their rankings. When I looked into liquidity for some exchanges that caught my eye, I noticed that 2% market depth was a particularly liquid figure, with 0.5% and 1% being far less liquid. And when I say far, I mean not even close. The below was the difference in depth at various levels for the doge-usdt pair on Bitforex.
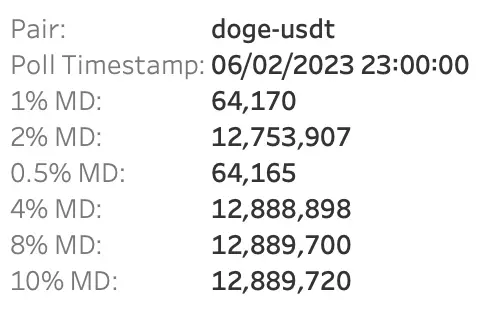
These figures are far from what we would come to expect on exchanges with more robust controls. The below are the same depth figures for doge-usd on the regulated exchange Coinbase, which show a more gradual increase up through the ranges of market depth.
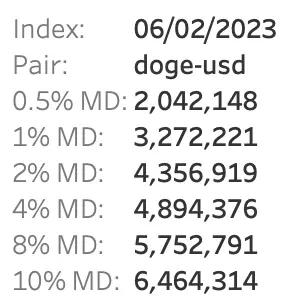
This makes me believe that some exchanges have adapted to anti-manipulation measures that ranking websites have implemented, and are gaming the 2% market depth figure, giving the impression that they have the liquidity to match their volumes, purely because the ranking sites display 2% depth. Looking at the 1% level allows us to lift the veil here and really dig deeper into fake volumes on exchanges.
One caveat is that volume and market depth can be influenced by the trading fees on an exchange, which in turn would impact ratios. Also, the data examined covers January 2023, in which market conditions caused a certain number of tokens to organically soar, which would result in a large ratio for these pairs. Thus, the ratios themselves are not an indicator, but can rather serve to raise a red flag which can then be further explored.
Now that’s dealt with…
The below was the result of using the average daily volume in 2023 for the highest volume pairs so far this year, divided by the average 1% daily market depth in 2023. Note Binance pairs were excluded here in order to focus on smaller exchanges.
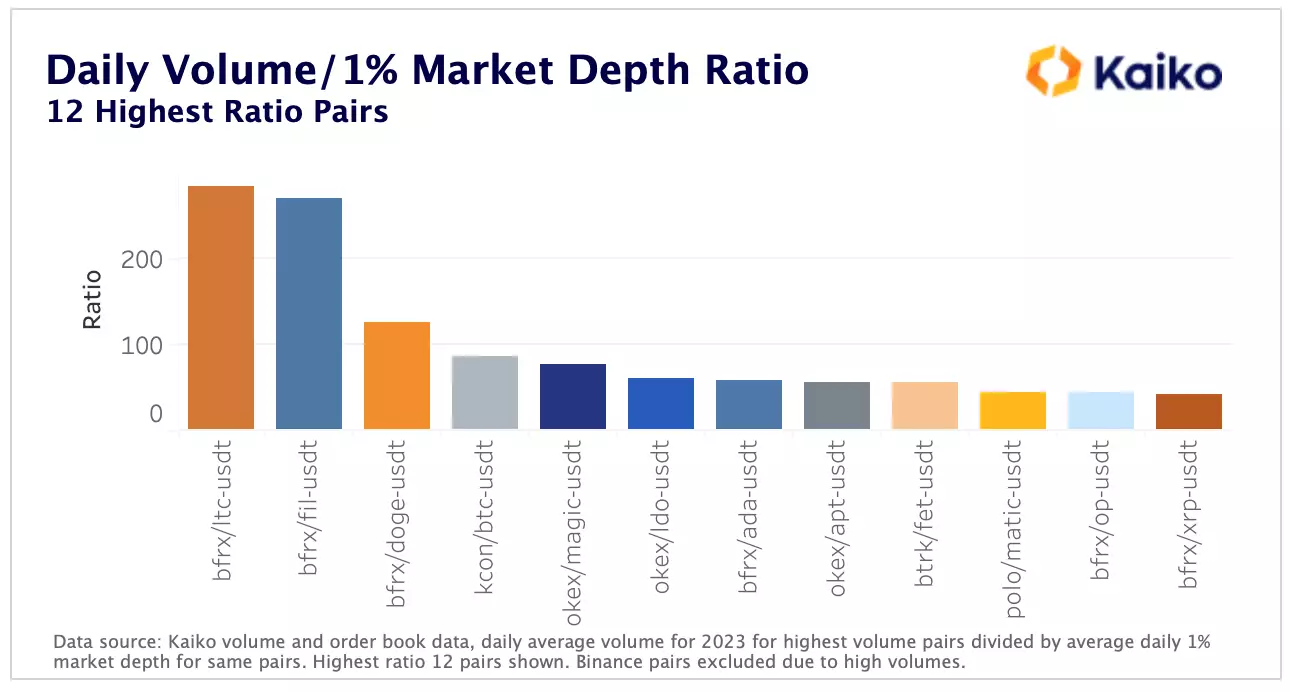
As we can see, Bitforex stands out as having the highest number of pairs with outsized volumes relative to their depth. 6 of the top 12 pairs with questionable ratios belong to Bitforex and this was the first indication to me that these pairs should be looked into further. Using a ratio like this allows us to hone in on potentially suspect volume figures and look at the trade dynamics for that pair on the exchange. At the exchange level we can get an average ratio for each of the pairs chosen to spot those that may warrant further investigation.
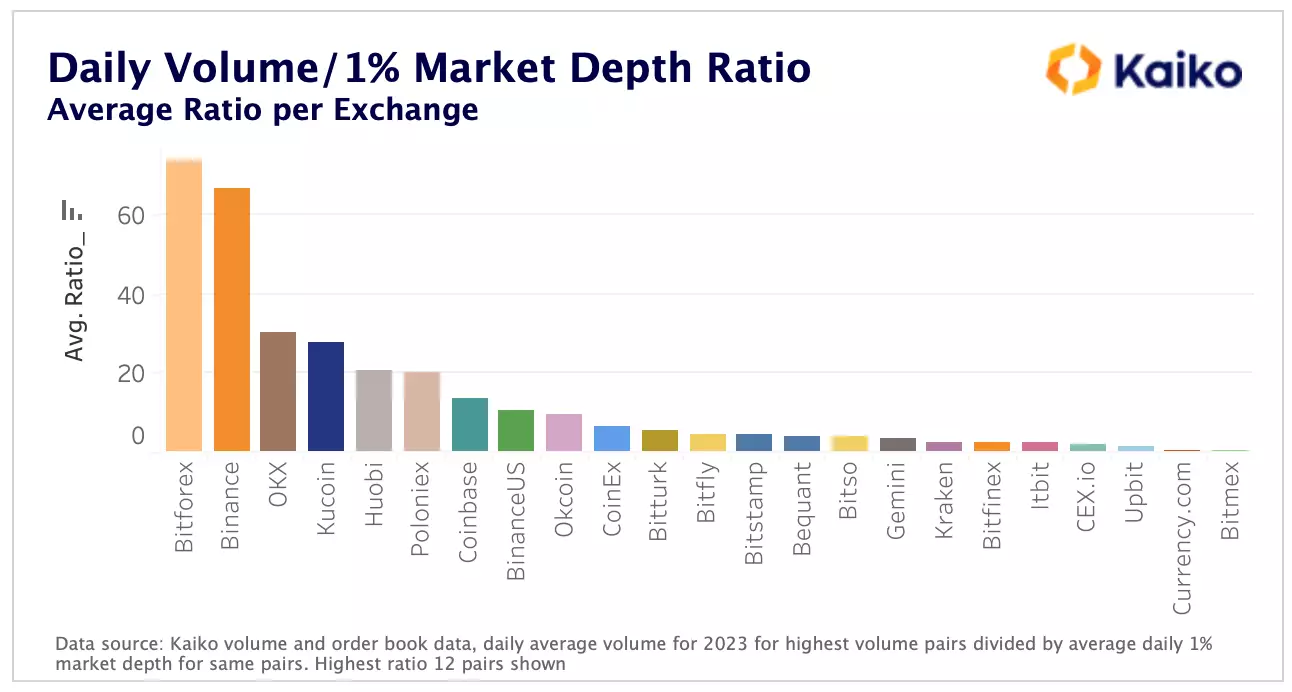
Binance ranks particularly high, in part because they eliminated trading fees for BTC pairs, in addition to having dominant volumes which makes it hard for market depth to keep pace. While there is of course still a risk that wash trading occurs on Binance, particularly for their zero fee pairs, the focus of this analysis is on smaller exchanges where volumes are more drastically suspicious and warrant further investigation. Bitforex leads the average volume/depth ratio across the highest volume pairs of 2023 and so we have used them as the focus of our analysis throughout this article.
2) Tick Trades
Using Kaiko’s tick trade data, I was able to chart each individual order for the pairs with the most suspect volume figures. What I was looking out for was any buy and sell orders that would occur at the exact same time for the exact same amount — a surefire indication of wash trading.
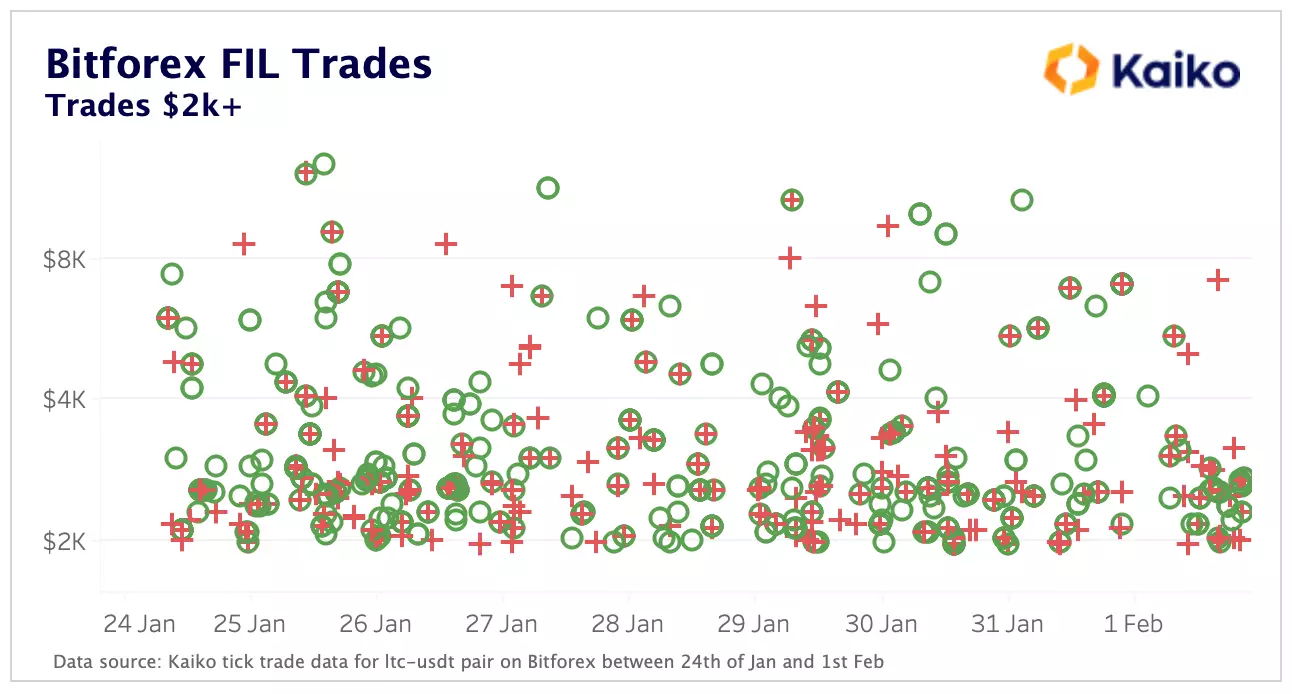
While I had my suspicions after seeing the ratios, I was pretty taken aback with how clear the artificial orders were on Bitforex in particular. Firstly, below are the tick trades for the highest ratio pair, ltc-usdt on Bitforex, with reported volumes coming in 280x higher than market depth. According to the volume figures Bitforex are reporting, they have the second highest volume figures for LTC across all exchanges, ahead of Coinbase and OKX.
The artificial orders are those that have a cross (sell trade) within a circle (buy trade), forming a crosshair, indicating a buy and sell order occurred at almost the exact same time for the exact same amount. For visualization purposes, I’ve split the charts in two depending on trade size.
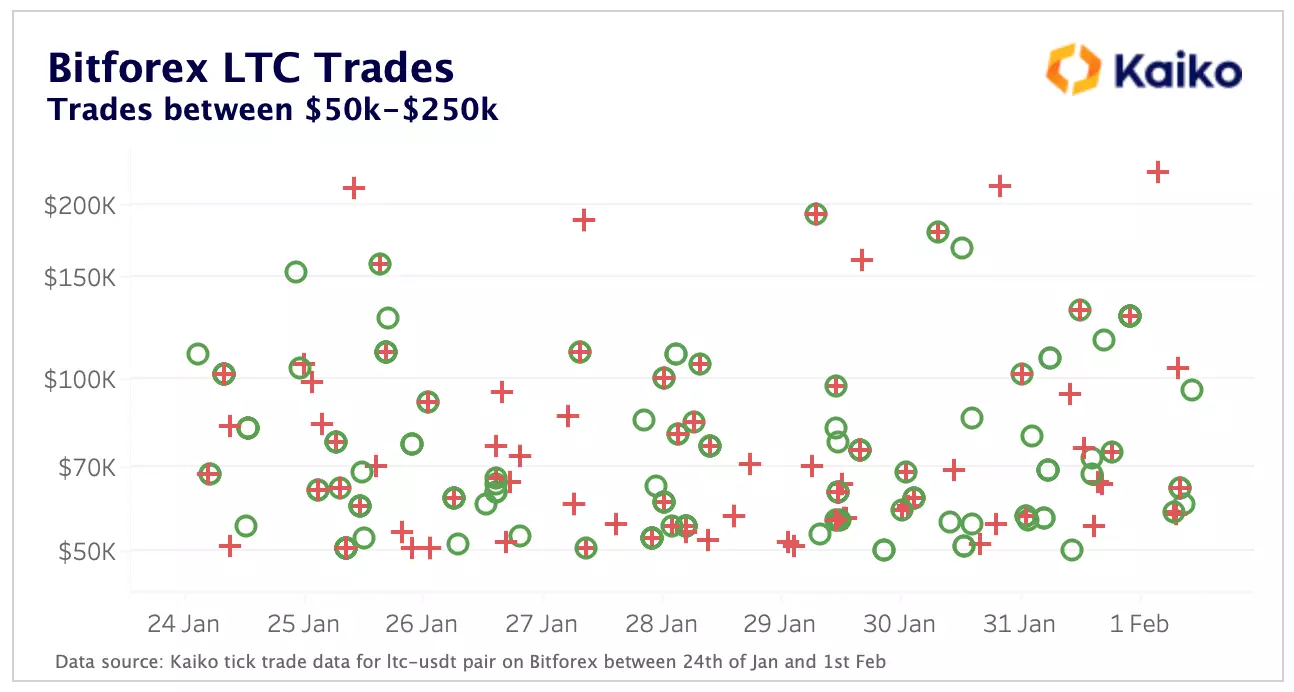
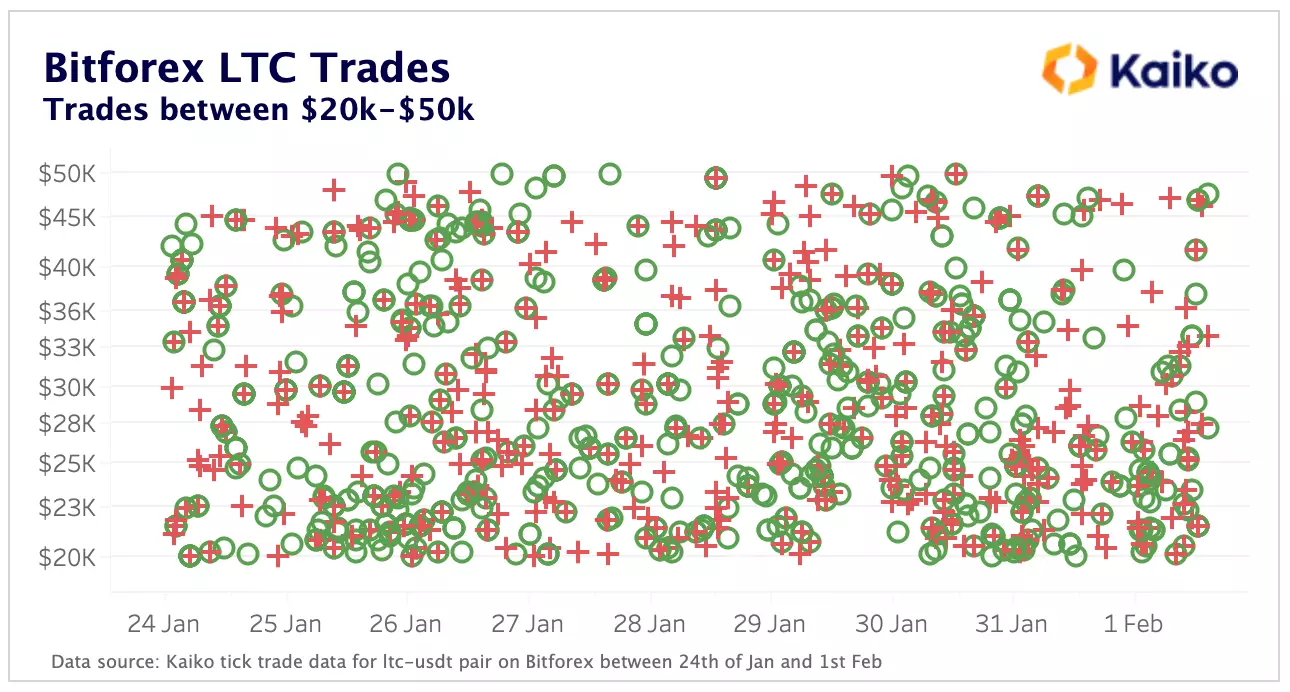
This analysis strongly suggests that there may be wash trading occurring on the LTC pair on Bitforex. To confirm this view, let’s take a look at a more regulated exchange like Coinbase and examine trade data for the LTC pair.
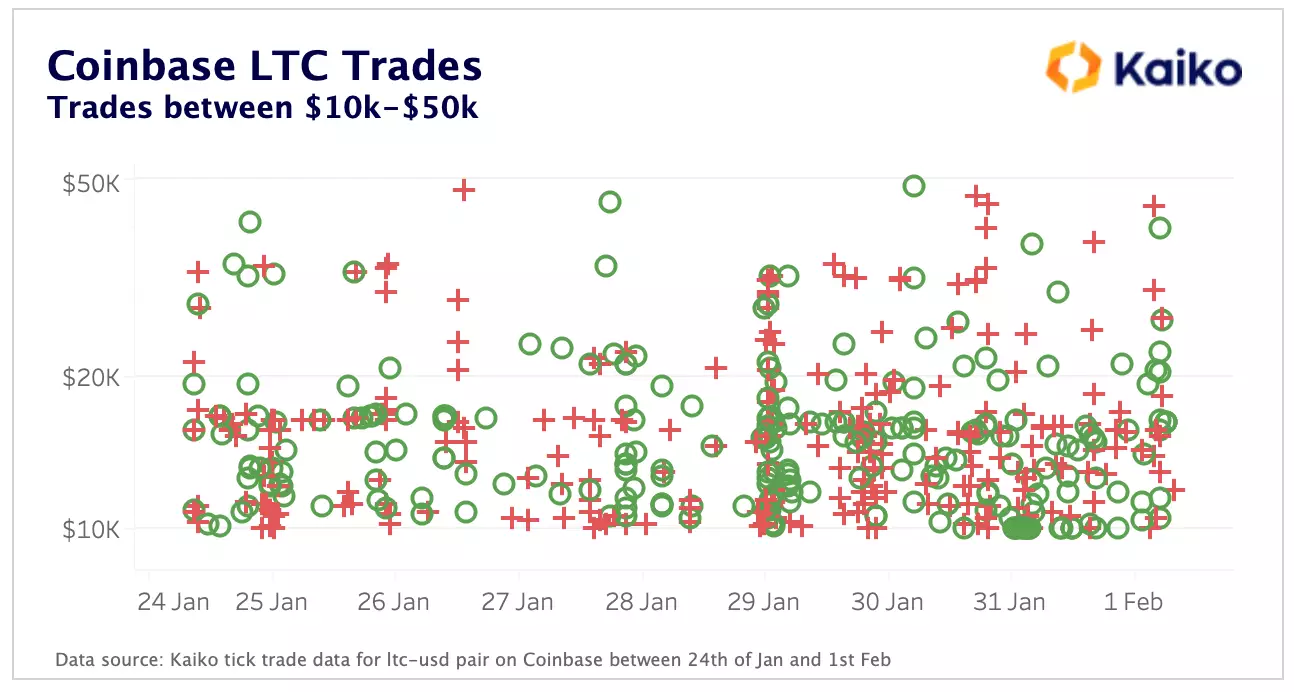
We can see from the Coinbase trade data for LTC that there are virtually no crosshairs, indicating that most of this volume for LTC is likely organic at a glance.
Now let’s look at the second highest ratio pair, FIL-USDT, a smaller market on Bitforex but one that has 270x the volumes than 1% market depth and displays similar trends to Bitforex LTC markets.
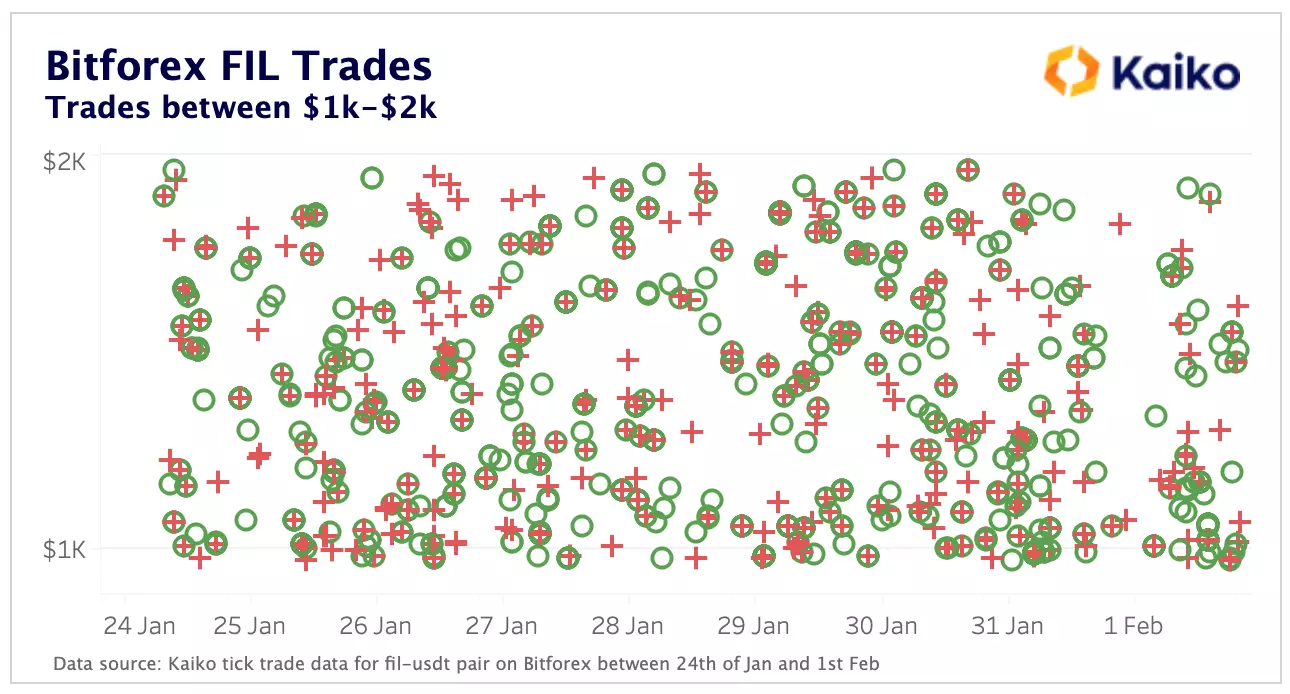
While the volume figures here are lower, there’s evidence that would suggest wash trading is occurring here too. Using a volume/depth ratio combined with tick level trades is a very powerful tool to spot wash trading and deduce how close the reported volumes are to the real figure.
3) Volume Patterns
The crypto market is quite broadly correlated, and accordingly volumes between exchanges tend to mirror one another through all market cycles. However, one easy way to spot exchanges where volumes are increased artificially is by examining the pattern of those volumes. If they differ significantly from the standard trend seen on other exchanges, it’s likely there’s something amiss.
One way in which volumes on suspect exchanges can differ is via less spikes and more consistently flat volumes, no matter the market trend. Let’s take Bitforex again and compare it to Coinbase and Binance, which are more representative of the wider industry.
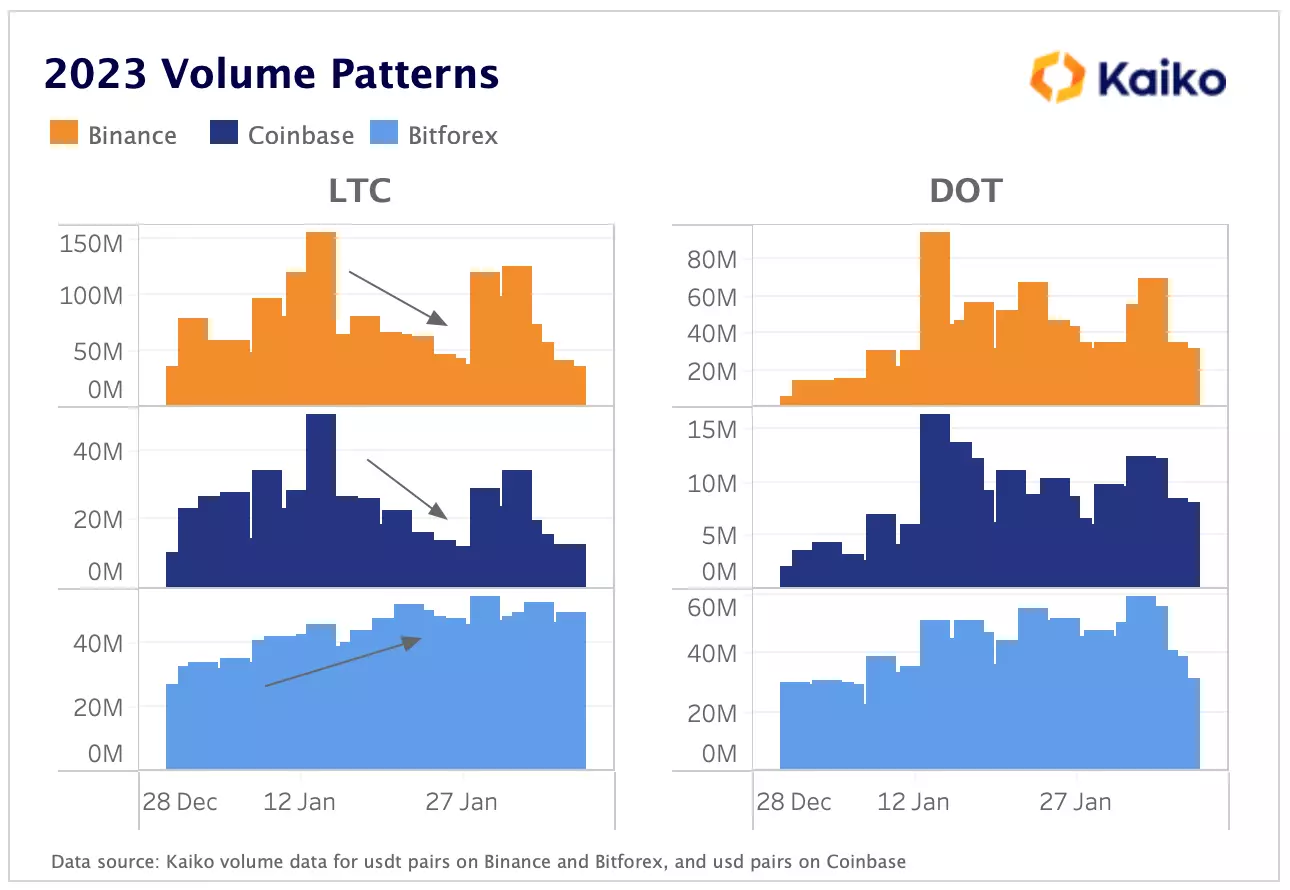
We can see that for all the assets chosen, LTC and DOT, the trading patterns on Bitforex do not match the trend on Binance and Coinbase. We saw similar patterns in FIL markets too. Bitforex has less extreme spikes and dips in volume, with a much flatter pattern across the board. Bitwise published a full report, using Kaiko data, on fake volumes, where this concept of flat volumes was singled out as a red flag for wash trading.
As a sense check on volumes, we can use other useful metrics such as web visits or employee count to gauge the veracity of volume claims. For instance, Bitforex claims to have more LTC and DOT daily volumes than Coinbase, so let’s compare the two exchange’s number of website visits to see if that sounds right.
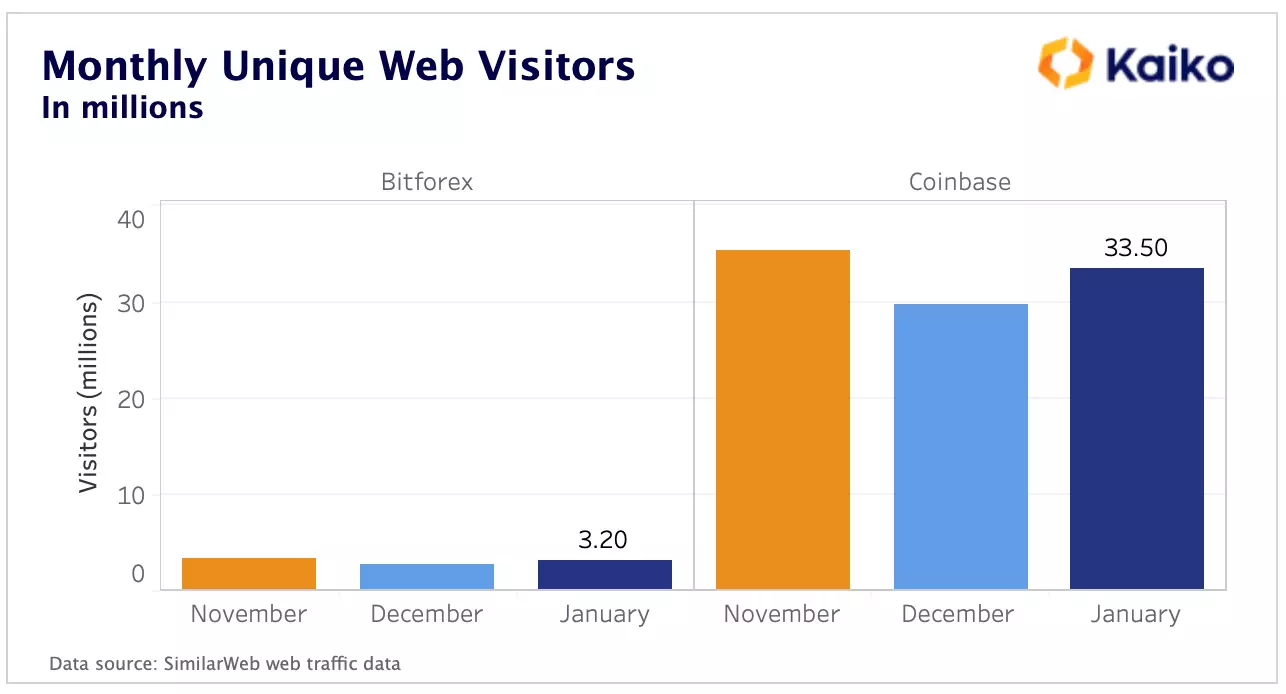
While not the most important metric, when other signals are pointing towards artificial volumes, web traffic can be another factor to drive that point home. Here we can see that Coinbase has over 10x the monthly web visitors as Bitforex, despite Bitforex claiming to have more volumes in some markets.
4) Spreads
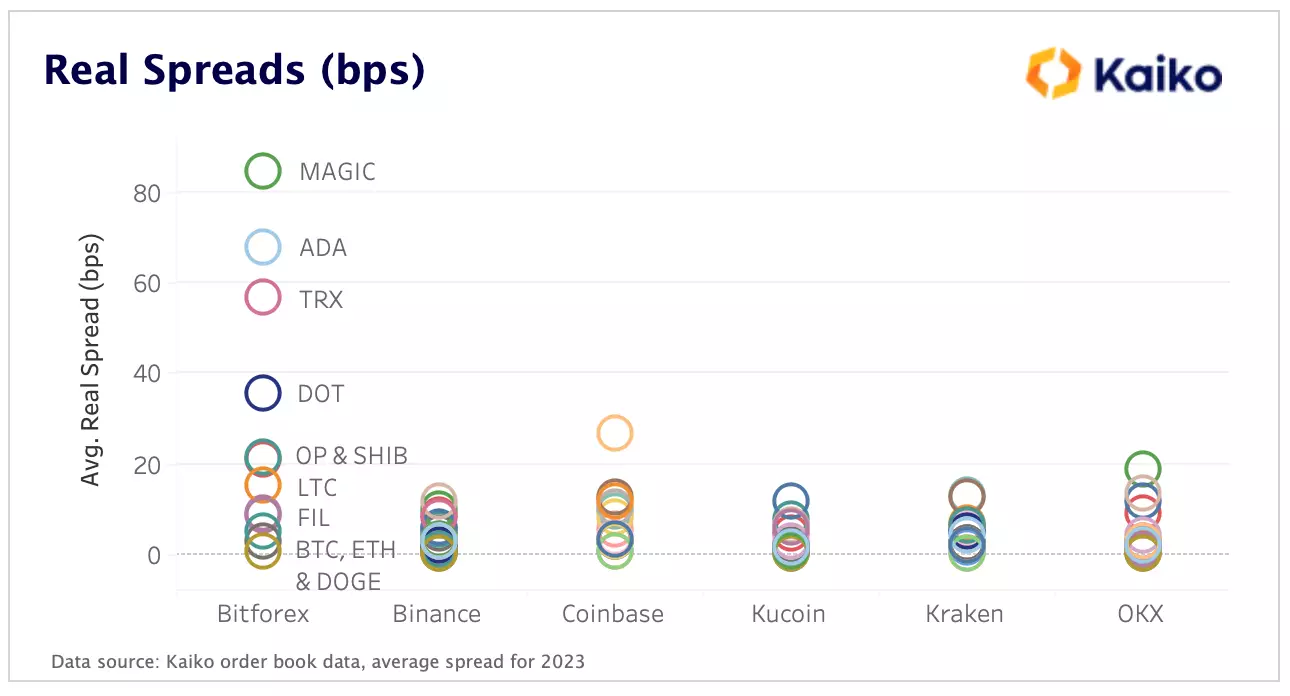
Another red flag for artificial volumes is when an exchange purporting to have high volumes, also has high spreads. High spreads are found in thinly traded, illiquid markets — not those with high volumes. If an exchange has a consistently high spread, that is usually a sign that the market is a lot less liquid than implied by the volumes. On the top exchanges we see spreads close to zero, and approaching zero for the most liquid pairs. Using Bitforex as an example again, we see spreads across all pairs that are far above those offered on some of the top exchanges, despite Bitforex claiming to have more volume on certain pairs.
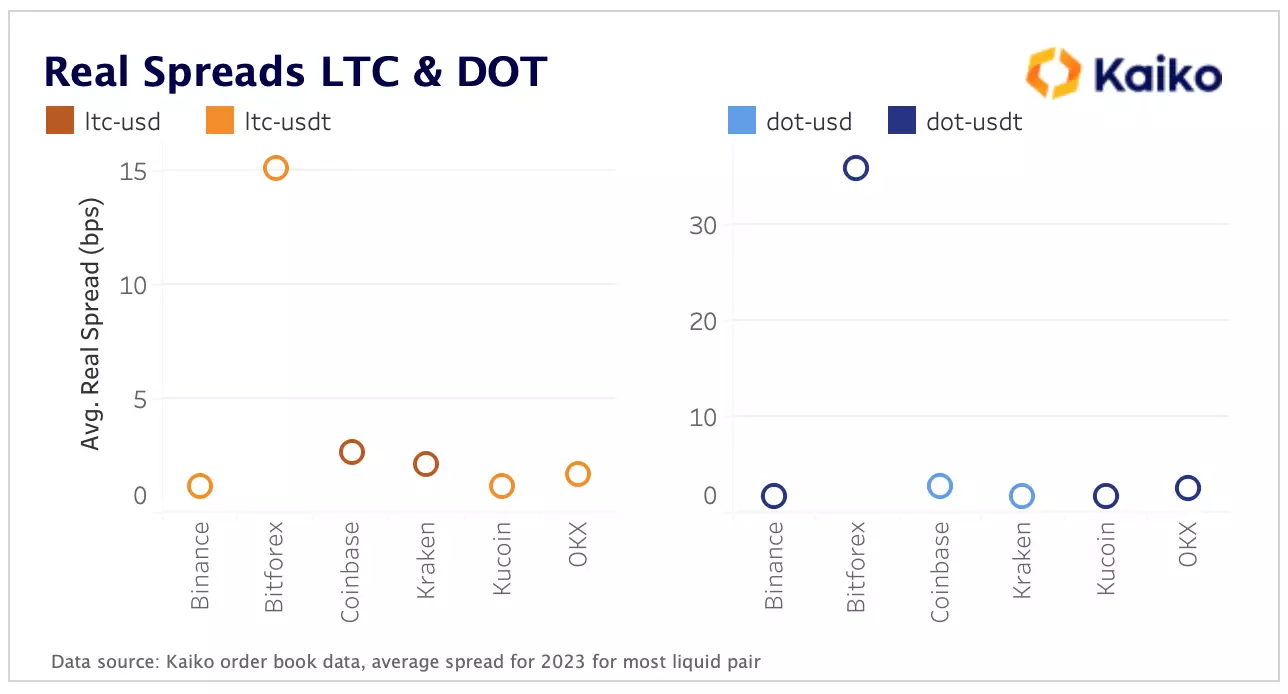
Zooming in on LTC spreads, despite claiming to have more LTC volume than Coinbase, Bitforex spreads are over 6x higher than those on Coinbase for their most liquid LTC pair. Meanwhile, Bitforex reports having the highest DOT volumes of any exchange for their most liquid pair, higher than even Binance. We can see this isn’t reflected in the spreads and when combined with the irregular volume patterns we saw for DOT earlier, we must question the reliability of the volumes reported.
Conclusion
Using the methods in this analysis we were able to spot suspicious patterns of volume on Bitforex for certain pairs, but it’s highly likely that this type of behavior can be found on other smaller exchanges as well. Investors need to be skeptical of smaller exchanges reporting higher volumes, particularly when the exchanges they are overtaking are regulated or industry leaders.
Perhaps a large portion of the onus falls on regulators who need to establish proper regulation for exchanges to cut out wash trading. Or maybe responsibility lies with the exchanges to have better controls in place to prevent artificial trades. One could even make the case that ranking sites like Coinmarketcap can make more of an effort to display metrics like normalized volumes, excluding potentially artificial trades from volume figures.
I have a bit of sympathy for ranking sites due to the fact crypto is still a relatively immature asset class and ranking exchanges and tokens is not an easy task, particularly without a consensus framework for doing so. However, volumes are an important metric when it comes to exchange trustworthiness and being able to identify the artificial figures will help the industry as a whole. This is why data providers are so important, allowing investors to apply their own framework. At the end of the day, it’s important we can spot suspicious trading patterns for ourselves, taking note of the repeat offenders so we have an idea of the exchanges we can trust going forward.
Data Used In This Analysis

More From Kaiko Research
![]()
Bitcoin
14/07/2025 Data Debrief
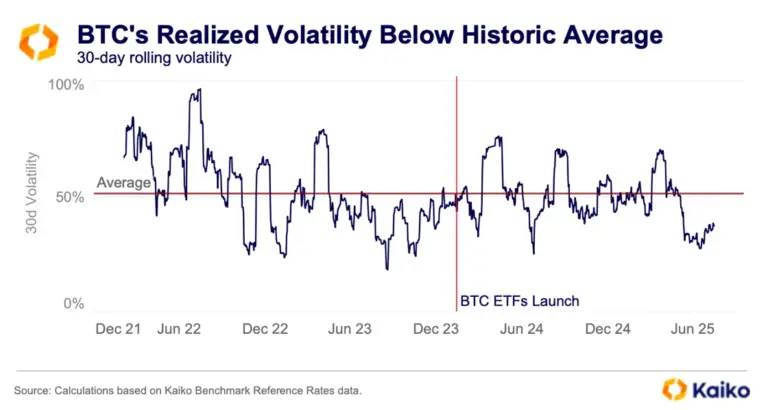
Bitcoin Booms in Low-Risk EnvironmentBitcoin topped $123k for the first time on Monday as last week’s rally extended into a second week. Today we’re going to explore the latest all-time highs in the context of portfolio risk, focusing on how BTC has consistently set highs during low volatility periods in recent months.
Written by The Kaiko Research Team![]()
USDC
07/07/2025 Data Debrief
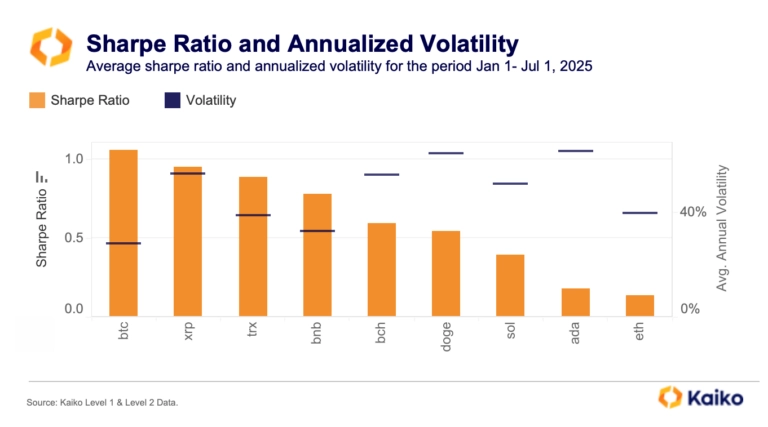
Gap grows between Bitcoin and altcoins.Bitcoin came close to a new all-time high last week before strong U.S. jobs data dented rate-cut hopes and pulled markets lower. Yet momentum remains intact, driven by institutional demand and a clear shift toward Bitcoin over altcoins. This week, we explored the structural shifts that may be laying the groundwork for a breakout.
Written by The Kaiko Research Team![]()
USDC
30/06/2025 Data Debrief
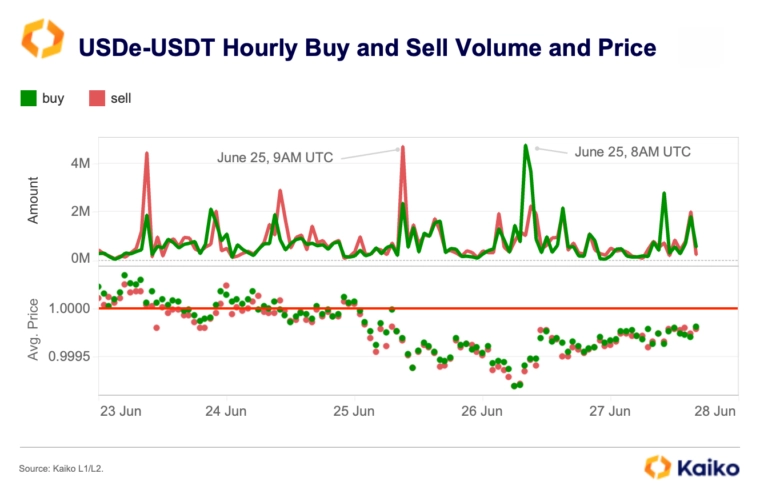
USDe faces regulatory setback in Europe.This week we’re diving into Ethena’s USDe, a stablecoin that’s quickly captured market share and regulatory attention. As global rules tighten and stablecoins become more integrated into mainstream finance, can USDe keep its momentum? We break down the data and the latest headlines.
Written by The Kaiko Research Team![]()
USDC
16/06/2025 Data Debrief
The data behind Circle’s $18B Valuation.Circle’s IPO debut on the New York Stock Exchange on June 5th captured market attention, with shares surging well beyond expectations and outperforming other major crypto listings. This special edition of our Data Debrief examines the on- and off-chain data signals that set the stage for this blockbuster launch and help explain the drivers behind Circle’s remarkable valuation.
Written by The Kaiko Research Team


