New Report: LATAM's rise in global crypto markets


How to Spot Artificial Volume
Written by Conor Ryder, CFA
09/02/2023

Welcome to Deep Dive!
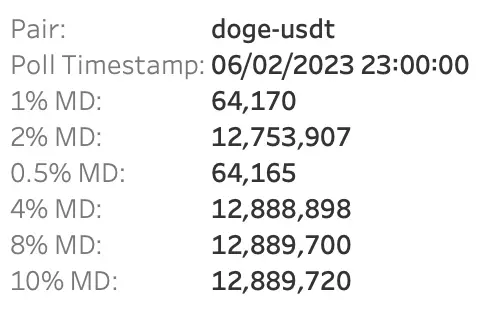
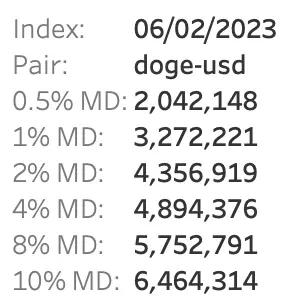
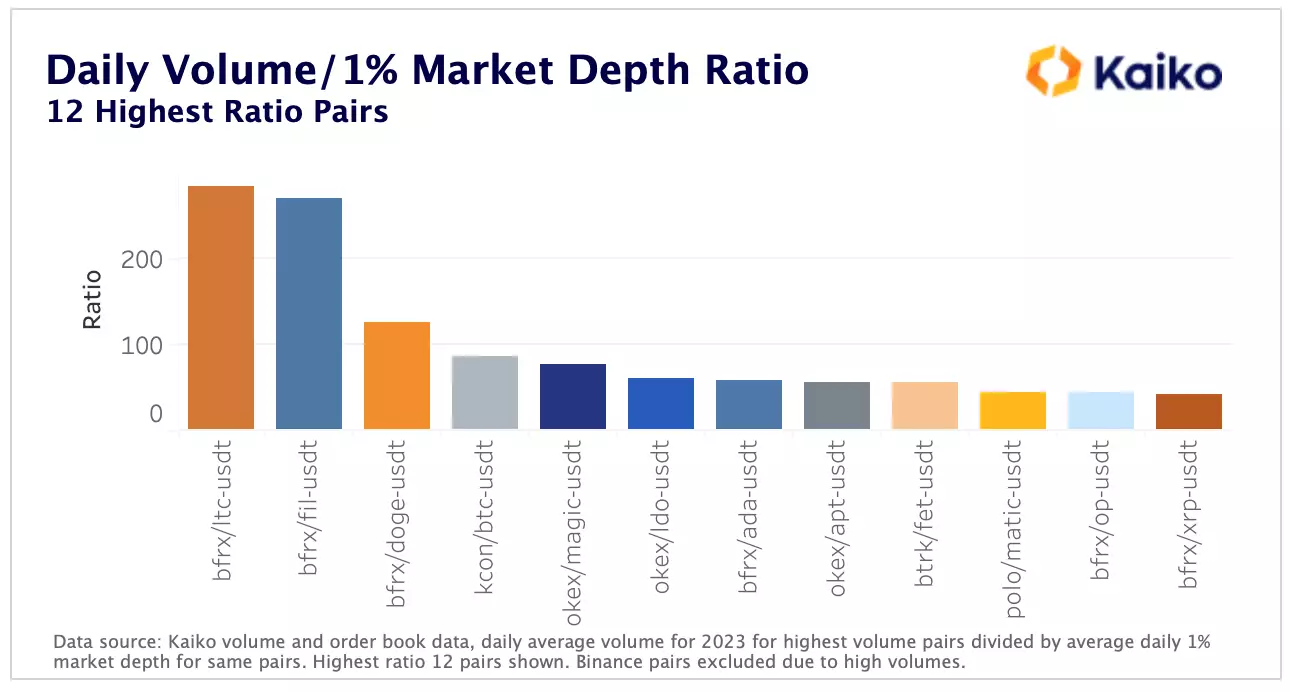
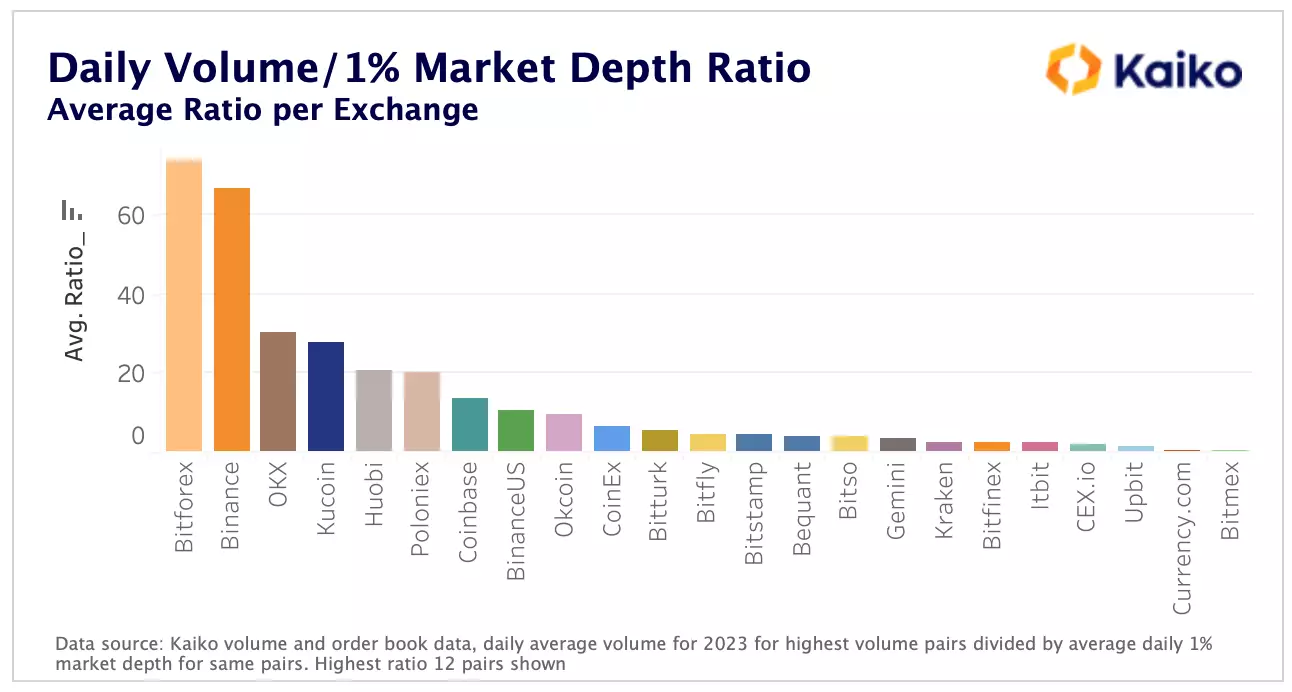
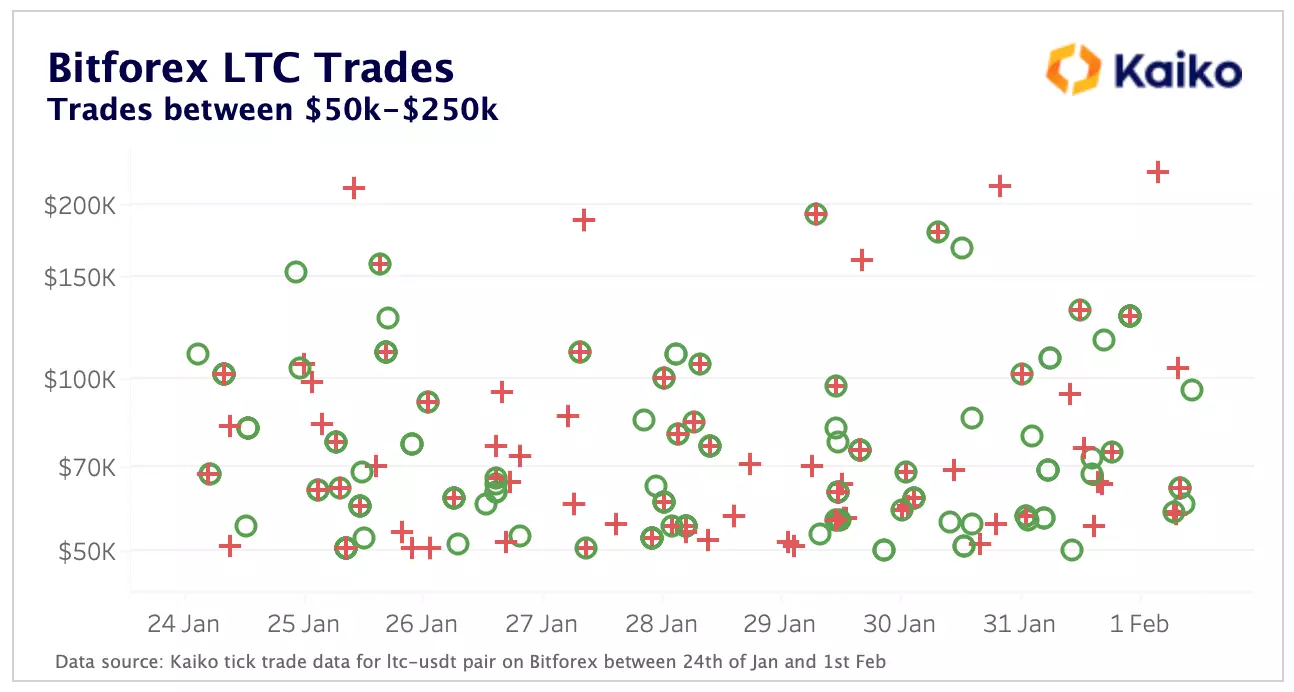
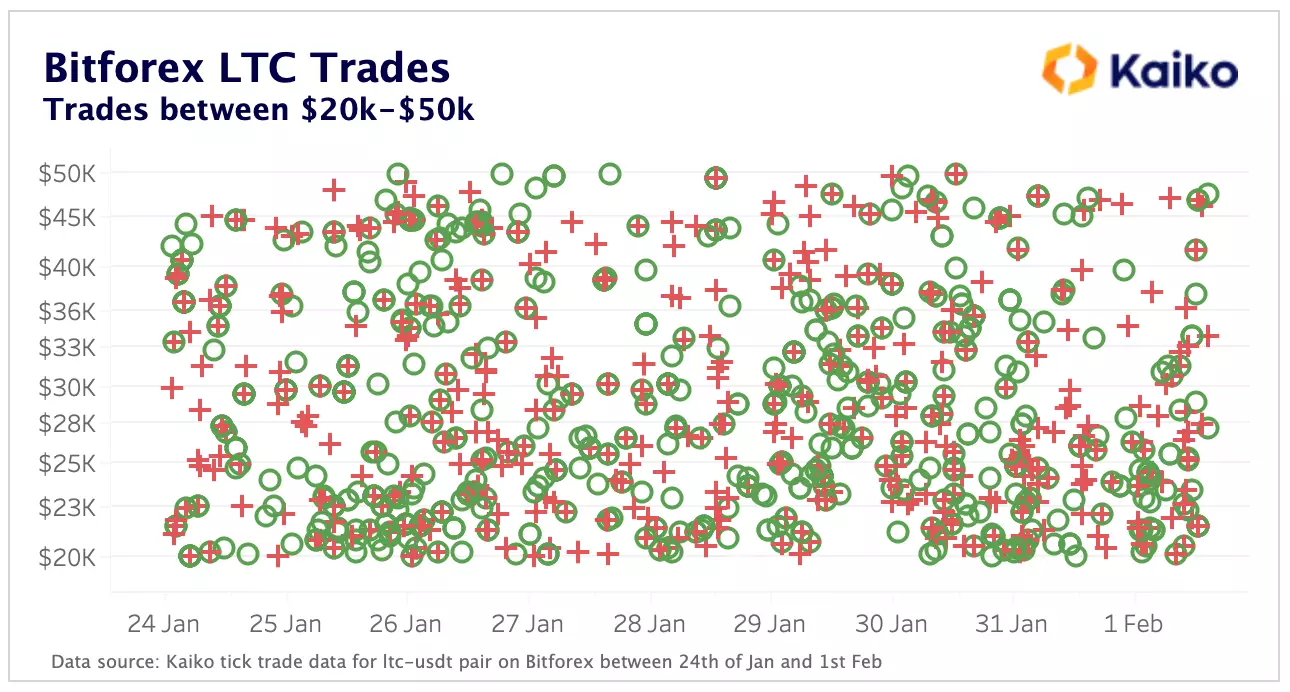
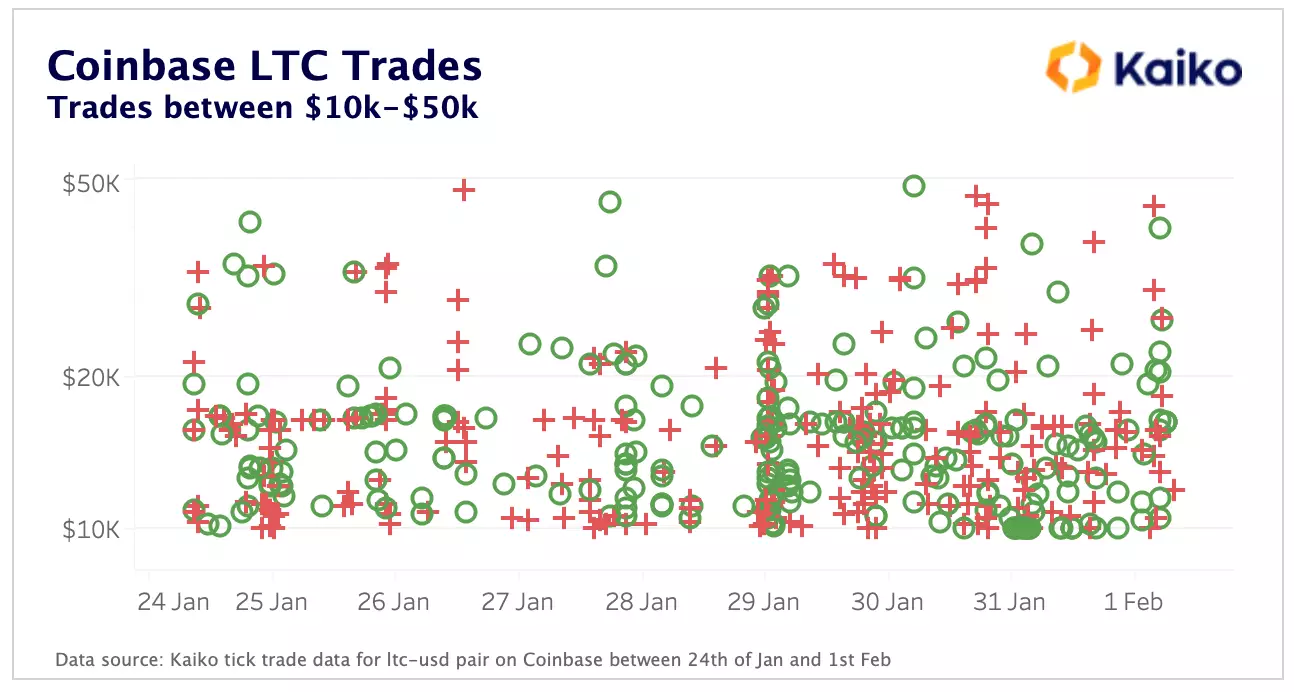
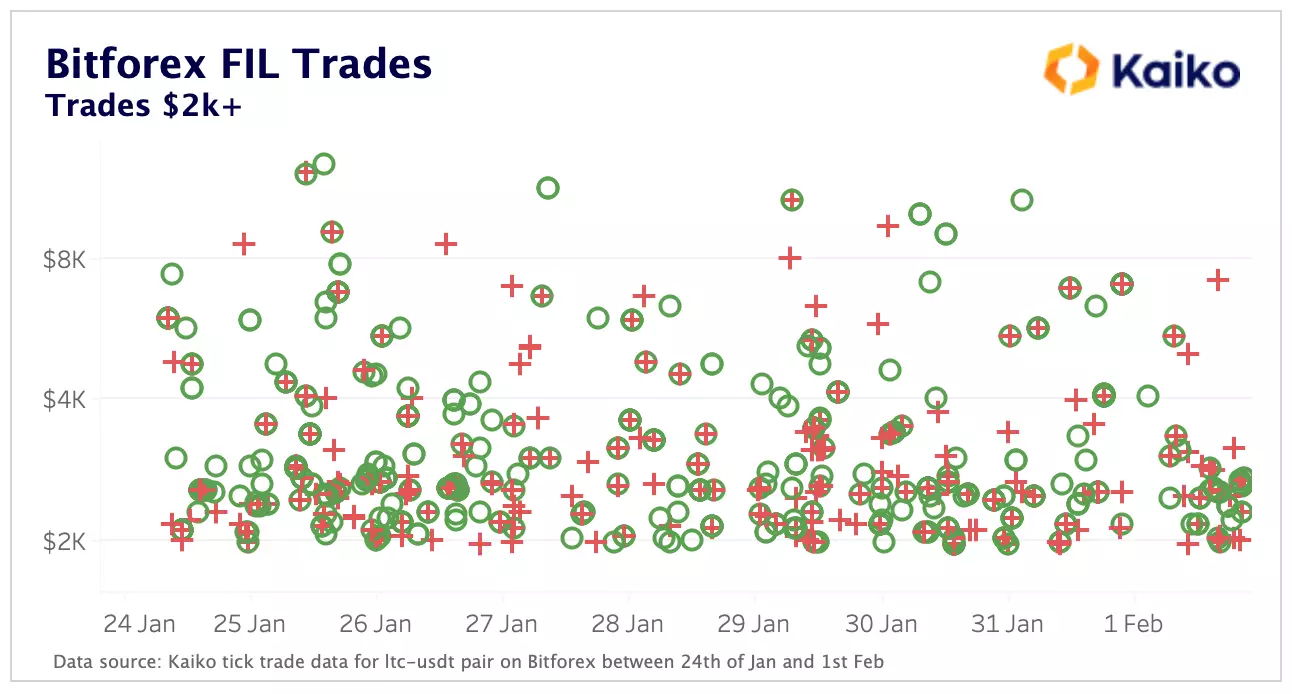
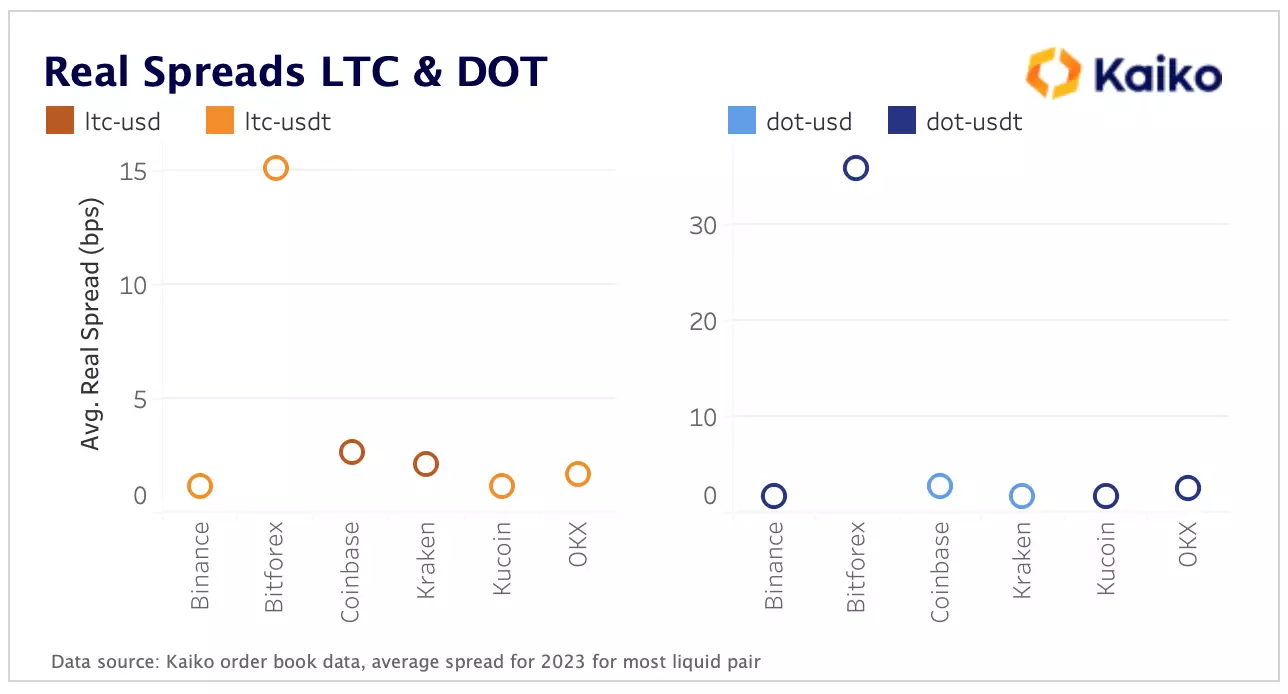
Often times investors are left scratching their heads when they see a small exchange high up the volume ranking on certain websites. The assumption is that some, or a significant amount of these volumes figures are artificially inflated by wash-trading on that exchange. This week, we present a framework that can be used to spot cases of wash-trading, pointing out potential examples of our own on the way.


More From Kaiko Research
![]()
Bitcoin
14/07/2025 Data Debrief
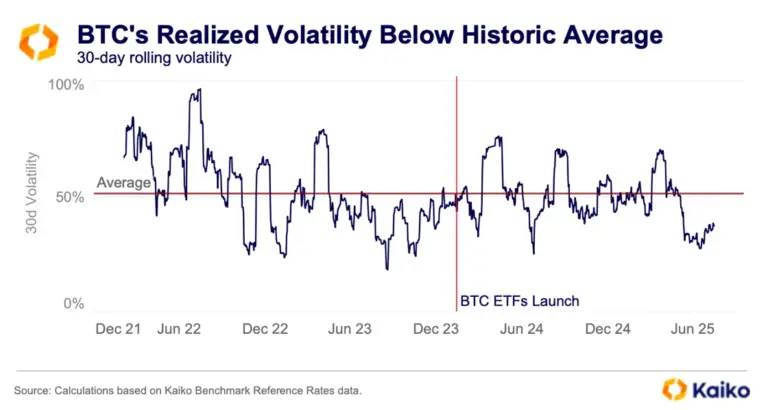
Bitcoin Booms in Low-Risk EnvironmentBitcoin topped $123k for the first time on Monday as last week’s rally extended into a second week. Today we’re going to explore the latest all-time highs in the context of portfolio risk, focusing on how BTC has consistently set highs during low volatility periods in recent months.
Written by The Kaiko Research Team![]()
USDC
07/07/2025 Data Debrief
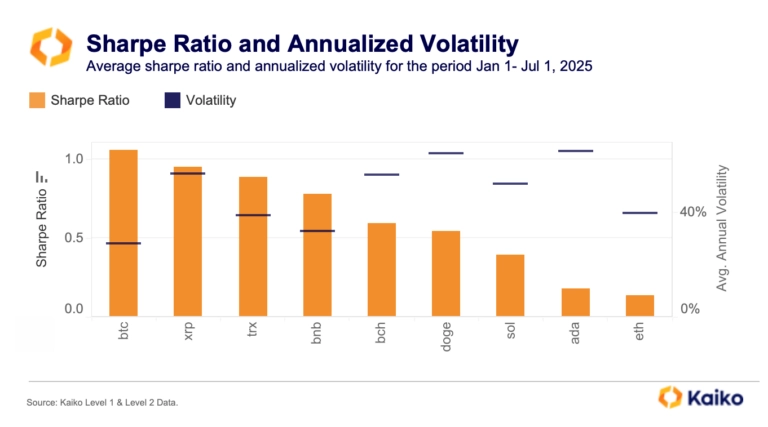
Gap grows between Bitcoin and altcoins.Bitcoin came close to a new all-time high last week before strong U.S. jobs data dented rate-cut hopes and pulled markets lower. Yet momentum remains intact, driven by institutional demand and a clear shift toward Bitcoin over altcoins. This week, we explored the structural shifts that may be laying the groundwork for a breakout.
Written by The Kaiko Research Team![]()
USDC
30/06/2025 Data Debrief
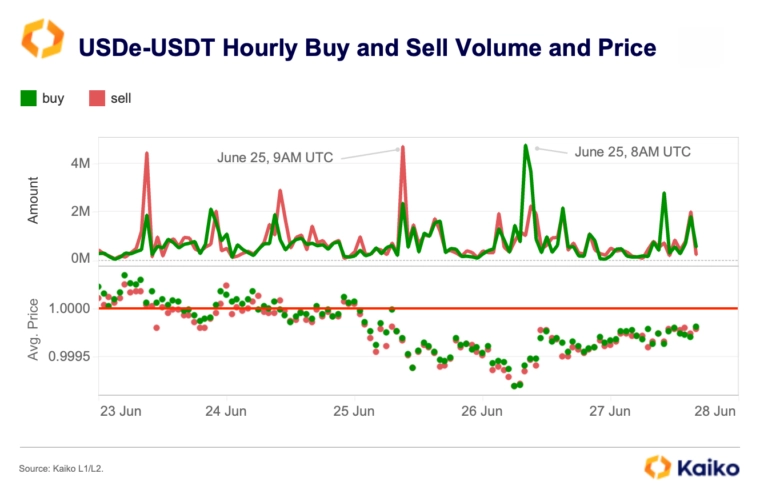
USDe faces regulatory setback in Europe.This week we’re diving into Ethena’s USDe, a stablecoin that’s quickly captured market share and regulatory attention. As global rules tighten and stablecoins become more integrated into mainstream finance, can USDe keep its momentum? We break down the data and the latest headlines.
Written by The Kaiko Research Team![]()
USDC
16/06/2025 Data Debrief
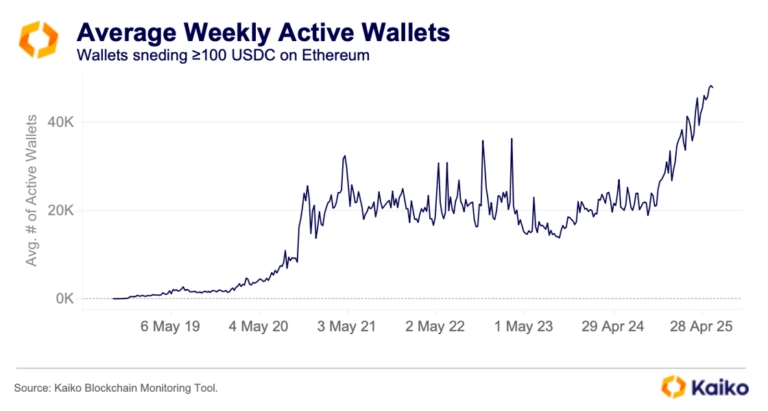
The data behind Circle’s $18B Valuation.Circle’s IPO debut on the New York Stock Exchange on June 5th captured market attention, with shares surging well beyond expectations and outperforming other major crypto listings. This special edition of our Data Debrief examines the on- and off-chain data signals that set the stage for this blockbuster launch and help explain the drivers behind Circle’s remarkable valuation.
Written by The Kaiko Research Team