Data Points
$750bn worth of liquidity has flowed through the top Uniswap pool this year.
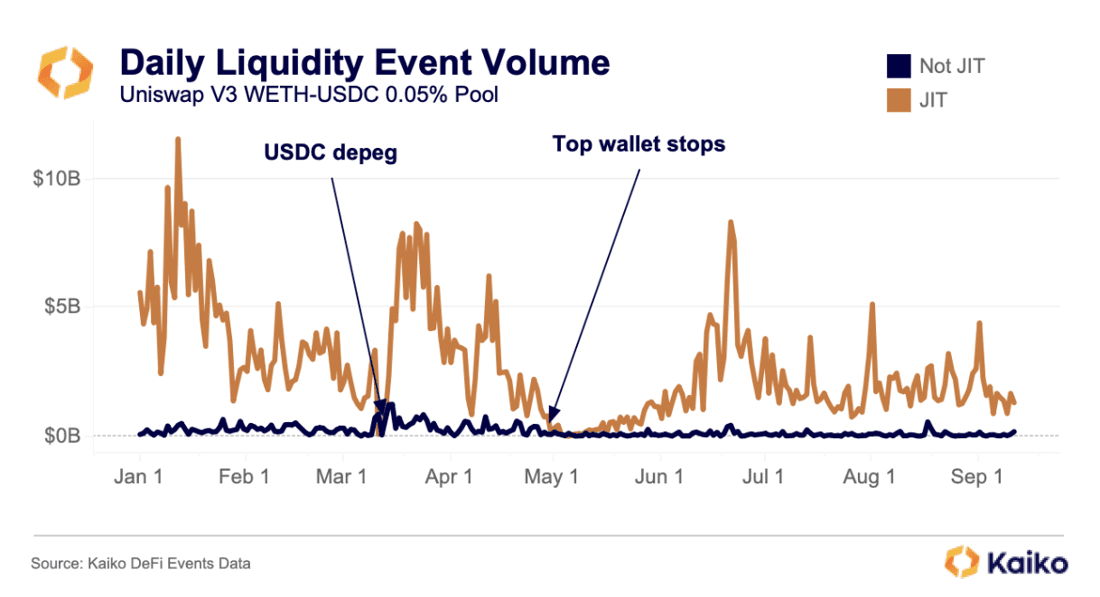
Uniswap V3’s innovations – namely concentrated liquidity – brought with it the phenomenon of just-in-time (JIT) liquidity. JIT liquidity involves a liquidity provider adding and removing a large amount of liquidity in a single block to receive a share of swap fees while minimizing the risk of impermanent loss. We first covered this under-researched topic back in February, finding that it was an imperfect science dominated by a few participants. Last week, we updated this report, exploring more nuances of JIT liquidity, including the idea of “portfolio change” profits, which can actually be greater than fee profits. We also explored the most active JIT addresses; the top address left the market in late April and activity has been much slower since.
View Deep Dive
Binance.US exodus continues.
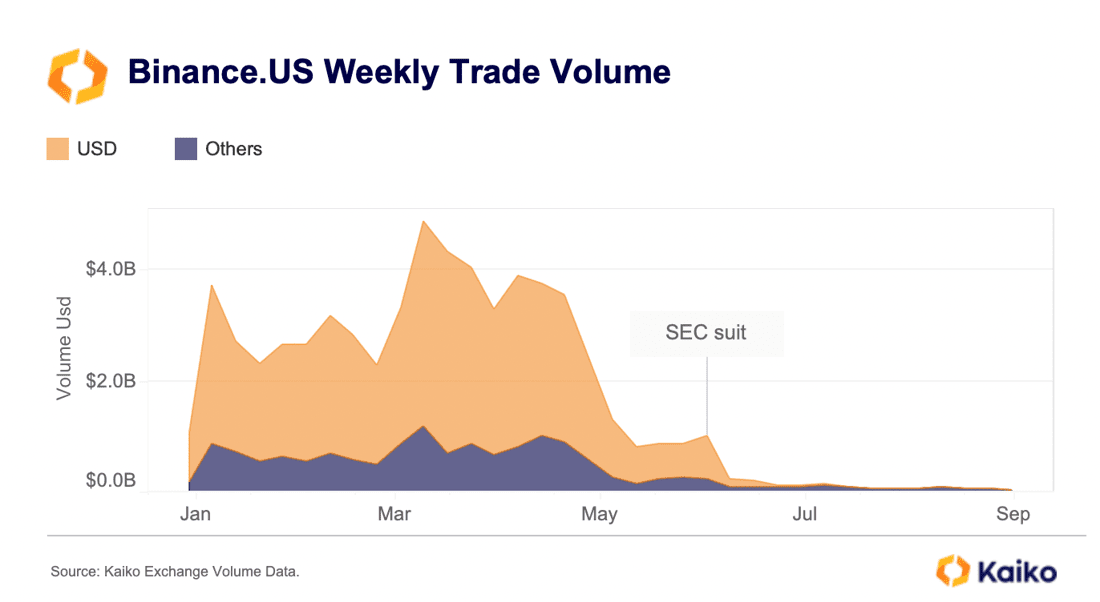
Binance.US saw a new wave of executive departures last week, boosting fears about the exchange’s future. Both trade volume and liquidity on the exchange have fallen significantly as traders and market makers left en masse after the SEC filed a lawsuit in June alleging violations of securities laws.
Weekly trading volume collapsed to about $40mn from an average of more than $4bn at the start of the year. The exchange also lost its banking partner and switched to a crypto-only platform. Interestingly, the decline in trading volume began in May, a month before the SEC officially filed charges.
CoinEX volume remains stable despite $54mn hack.
 Last week, Hong Kong-based crypto exchange CoinEX suffered a multi-million-dollar exploit, thought to be perpetrated by North Korea’s Lazarus Group. The exchange revealed that ETH, SOL, MATIC, TRX and other tokens were stolen from one of its hot wallets used to temporarily hold users’ tokens. Despite the hack, daily trade volumes on the exchange remained lackluster at around $20mn. Trade volumes fell in June after CoinEX agreed to a $1.8mn settlement with the New York Attorney General and began winding down its U.S. operations.
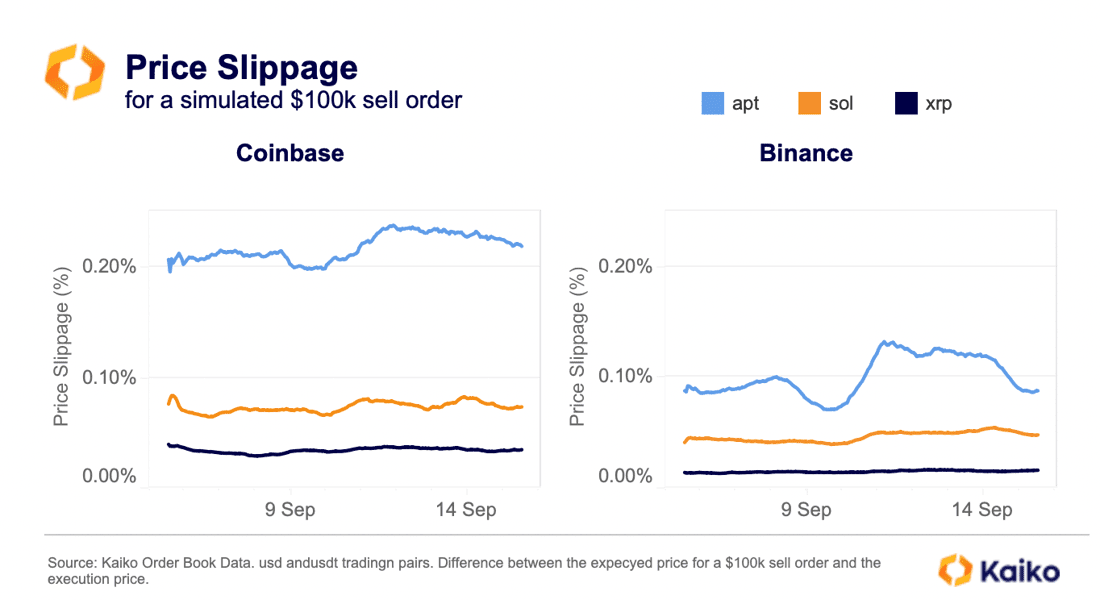
XRP liquidity surges after landmark court ruling.
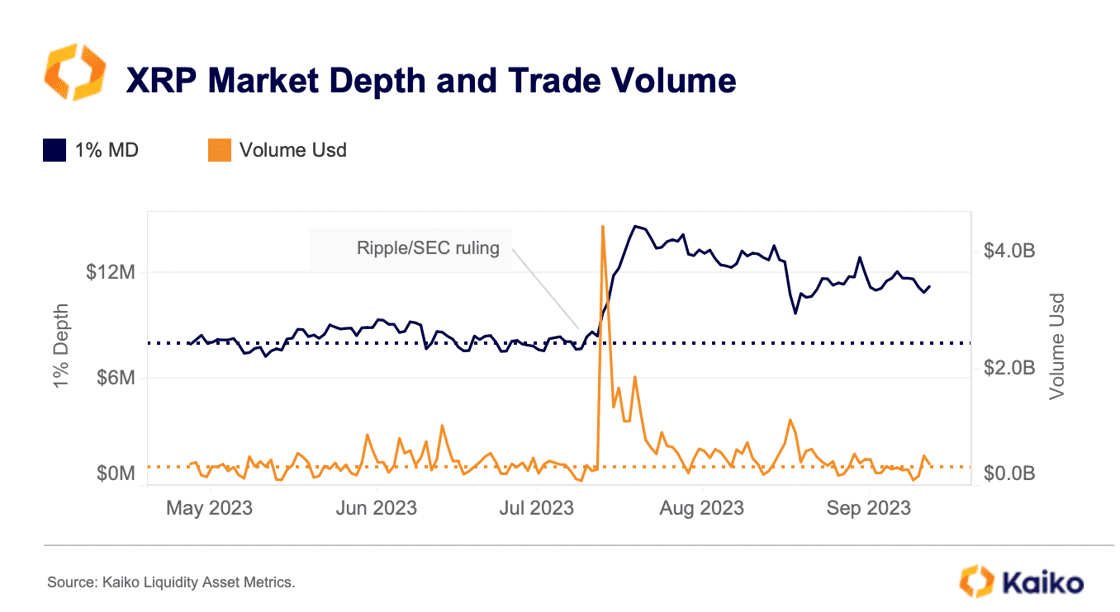
XRP liquidity has improved significantly after July’s court ruling in the Ripple/SEC case. The aggregated 1% market depth across all trading pairs and exchanges in Kaiko’s coverage rose from an average of $8mn in June to $12mn in early September. It is notable that liquidity remained robust even though XRP has lost most of its price gains and trade volumes have declined in August. The trend could suggest that the outlook for the token has improved after the ruling, with more market makers willing to provide liquidity. Several U.S. exchanges re-listed XRP after the ruling. The share of U.S.-available exchange volume has risen to 11% in August from 6% in April 2023.
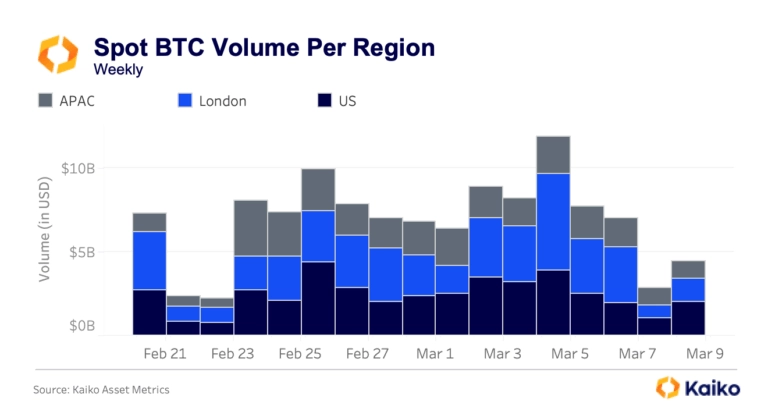
BTC dominance is on the rise.
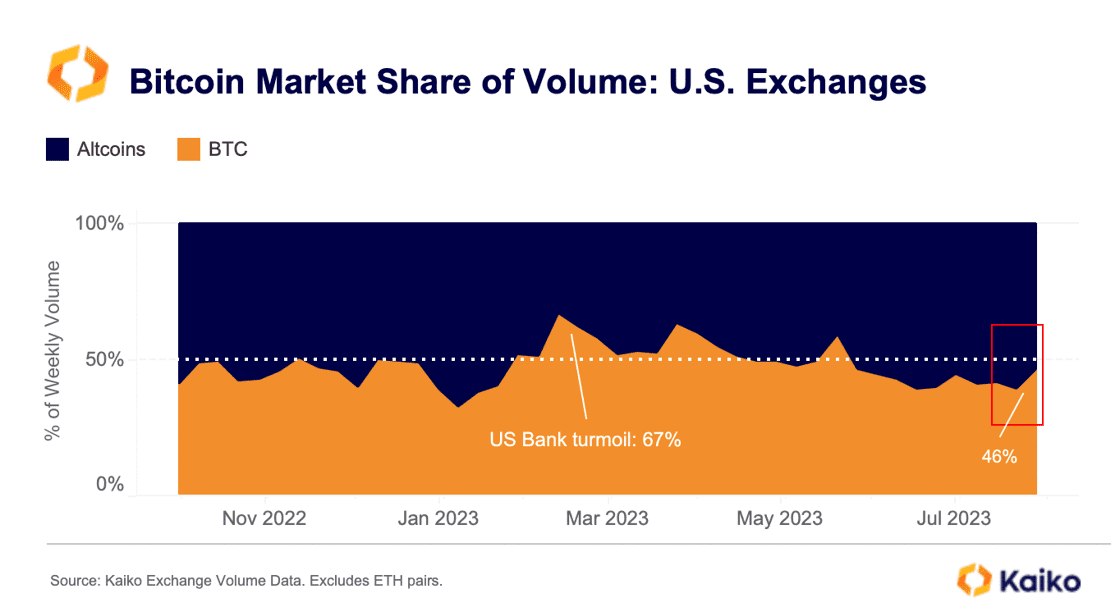
The share of BTC traded on U.S.-available exchanges has increased from 39% to 46% in early September, marking a reversal from the mostly downward trend observed since mid-June. The increase comes after the Grayscale ruling heightened the likelihood of a BTC spot ETF approval and was driven by Coinbase and Kraken. Rising BTC dominance on U.S. exchanges typically correlates with periods of strong institutional demand. However, despite the recent uptick, BTC market share remains well below its multi-year high of 67% hit during the U.S. banking turmoil in March, while trade volumes are still muted, suggesting limited market participation.
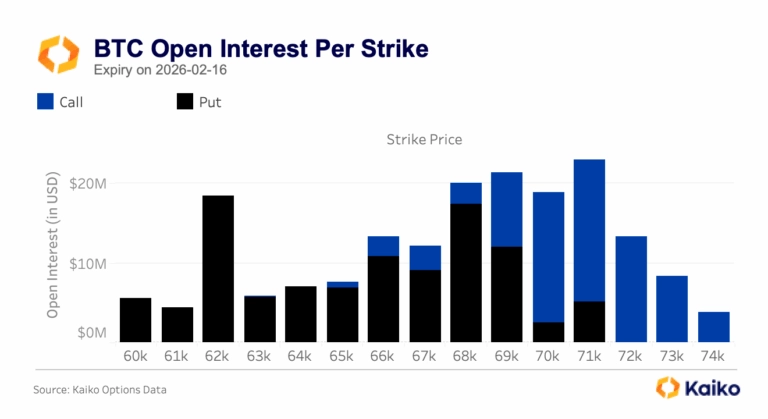
Bitcoin put option market share at 7-month high.
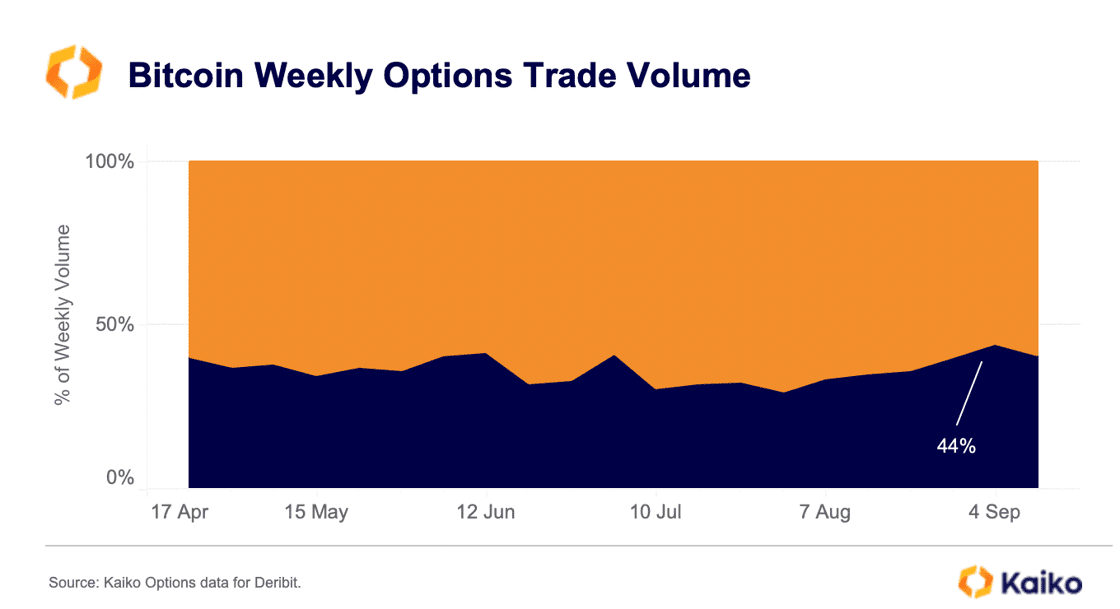
The share of Bitcoin puts options volume (bearish bets) has increased in early September to its highest level since February. Implied volatility has also rebounded from mid-summer lows suggesting traders expect volatility ahead. Despite retreating from August highs, Bitcoin weekly option volume remains above the summer months average, suggesting options demand is strengthening.
Fed balance sheet declines to lowest level since 2021.
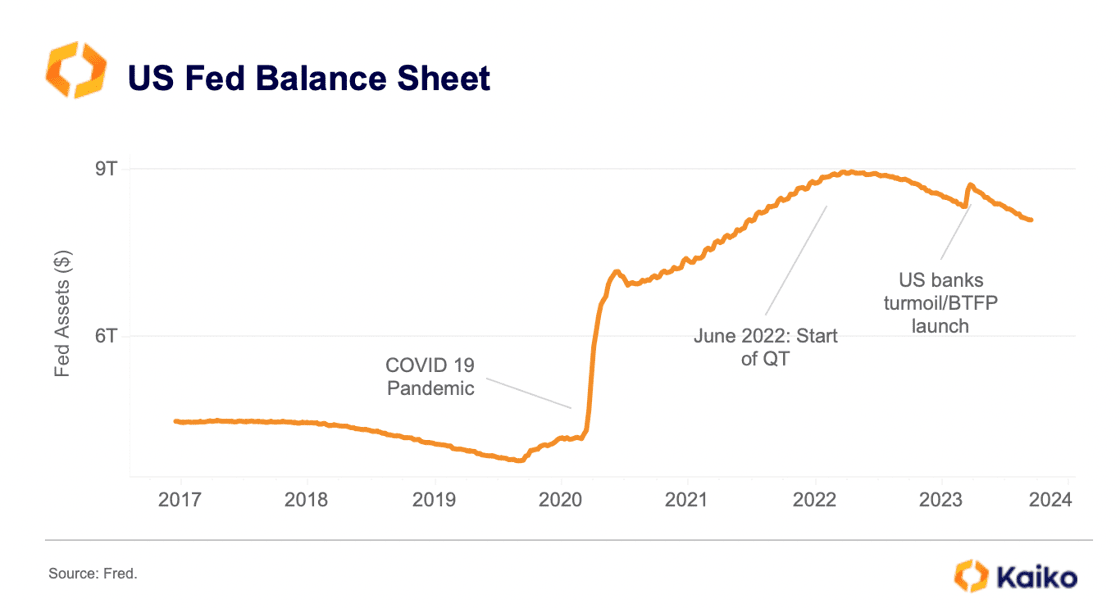
The U.S. central bank is widely expected to hold rates unchanged this week and is nearing the end of its hiking cycle. However, the process of balance sheet reduction, also known as quantitative tightening or QT has accelerated over the past year. Last week the Fed’s total assets fell to $8.1tn, their lowest level since mid-2021. This could weigh on risk assets especially as the U.S. Treasury has boosted bond issuance to replenish its account at the Fed (TGA) after a debt ceiling deal was finally reached in early June.