Throughout 2023, Kaiko Research published more than 800 charts exploring the highs and lows of crypto. Today, we take a look back at 10 charts that we believe define the year.
1. Bitcoin led the rally amid ETF hype.
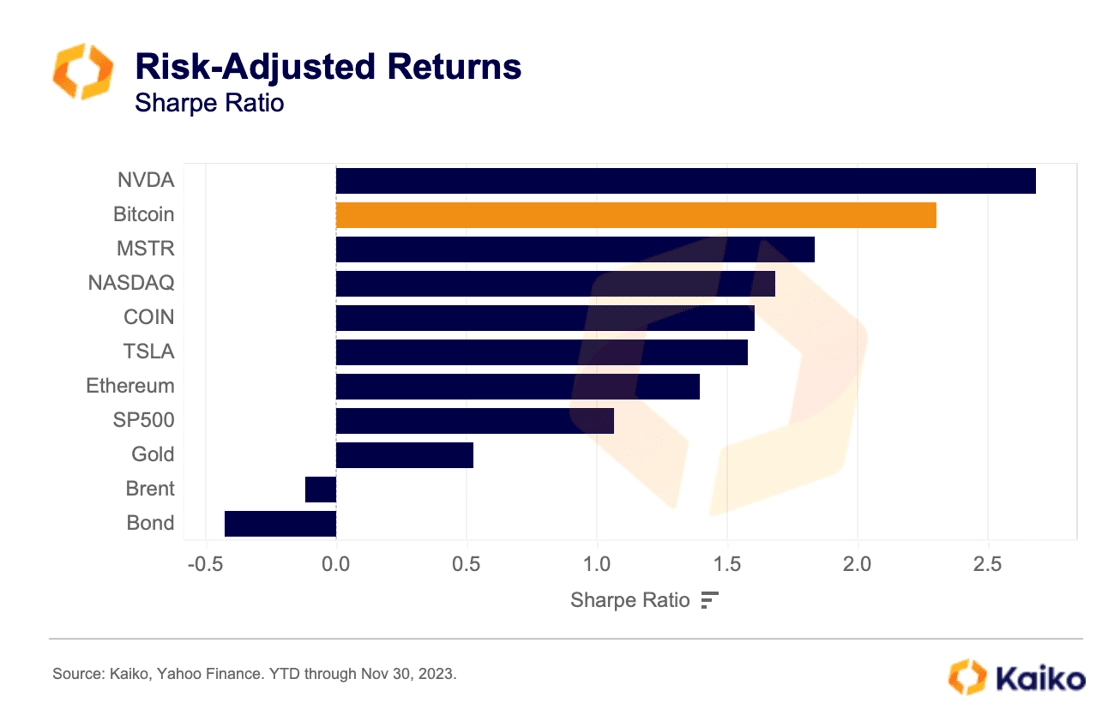
Bitcoin is set to close the year as one of the best performing assets, up more than 160% and outperforming all major traditional assets even in risk-adjusted terms. This year’s bitcoin price action can largely be broken down into three stages: the early rally from cycle lows, the mid-year stall, and the end of year rally, which is prompting calls for a new bull market.
The mid-year stall was a strange time; from March until October, BTC was almost always trading between $25k and $30k. This summer, volumes reached multi-year lows as it seemed that all of the enthusiasm had left the market. Then, optimism about a spot BTC ETF began to grow after BlackRock filed, and then a mistaken tweet from a crypto publication stating that the ETF had been approved seemed to break the floodgates open.
Since then, BTC has rallied from $28k to nearly $45k. So, despite a somewhat boring middle of the year, BTC has one of the best Sharpe Ratios of any major assets this year, second only to semiconductor giant Nvidia, whose stock more than doubled from January to May on AI excitement.
2. Binance’s tough year ends on a positive note.
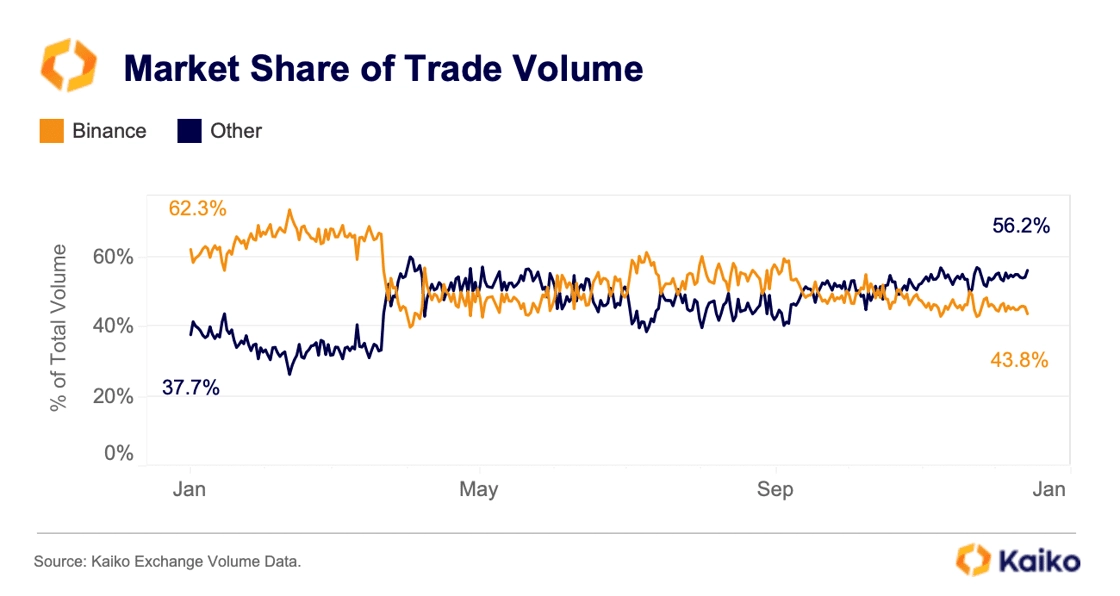
Binance began the year in its most dominant position ever, holding close to 70% of the spot volume market share amongst all centralized exchanges. However, it’s important to note that the exchange had several zero-fee pairs, significantly boosting volumes. These trading promotions ended in March, directly leading to a 50% drop in market share (we wrote a Deep Dive exploring the impact of zero-fee trading here).
Today, Binance offers zero-fee trading on its BTC-FDUSD instrument, but its market share has failed to recover due to a series of major legal setbacks.
In late March, Binance was charged by the CFTC, who alleged that the exchange had sought to move high-volume U.S.-based traders from Binance.US to Binance. The SEC charged Binance and Binance.US in June, with similar allegations as the CFTC, while also alleging that entities related to the exchange had wash traded on Binance.US.
These charges did serious damage to Binance.US, causing massive outflows of liquidity and dropping its market share to nearly 0. Finally, in November, Binance settled with the DOJ for violating anti-money laundering rules; Binance reached an agreement with the CFTC at the same time. Notably, its battle with the SEC is ongoing.
Despite the large $4bn fine, markets treated the settlement news as bullish, with the exchange allowed to continue to operate.
3. The Alameda Gap persists.
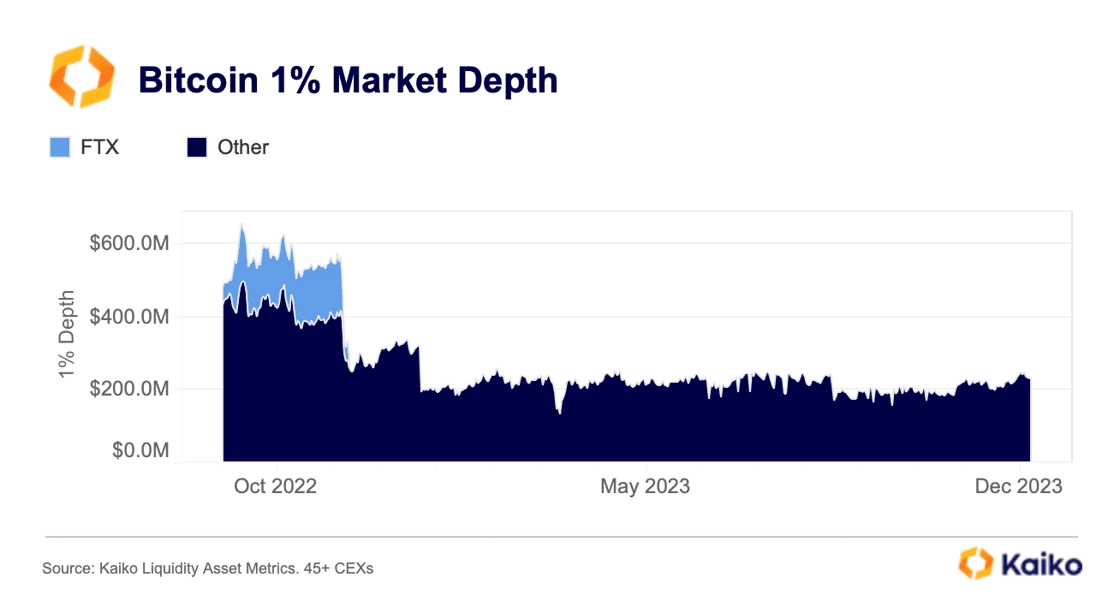
The Alameda Gap was coined by Kaiko Research last November as FTX collapsed, and more than a year later it is still relevant. 1% market depth – the USD value of bids and asks within 1% of a token’s mid-price – is still 50% lower than it was before FTX and Alameda collapsed. FTX’s liquidity (in light blue) is obviously gone, but the liquidity that vanished from other exchanges (in dark blue) has still not returned, even as prices and volumes have rallied. Much of this gap can be attributed to institutions and market makers that took significant losses in the collapse and either folded or became more careful with their funds.
4. Liquidity is increasingly concentrated.
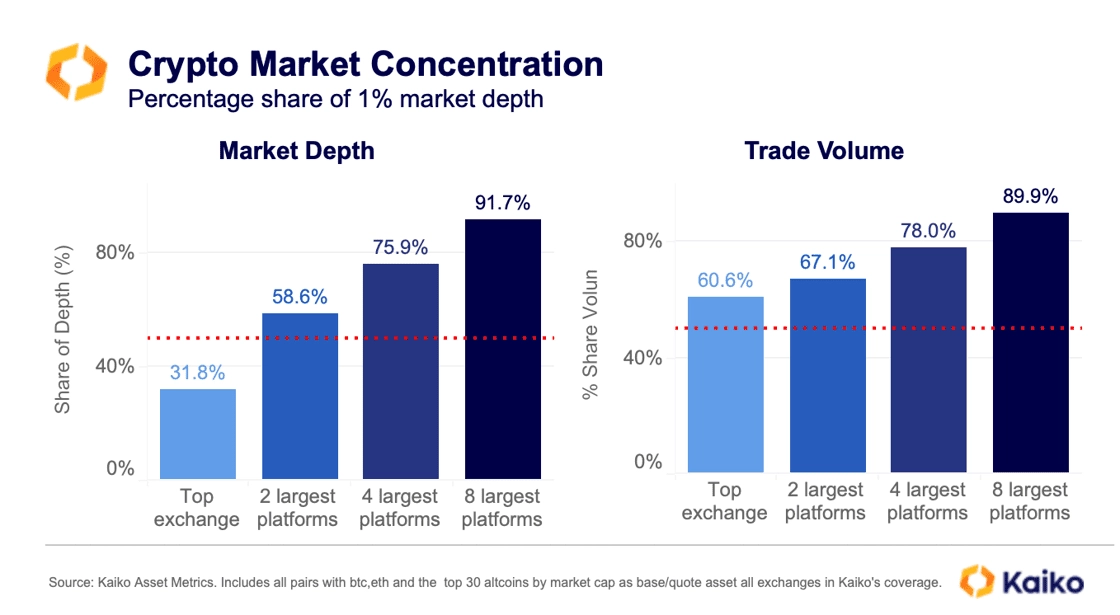
In a new liquidity analysis published this fall, we found that the majority of both volume and market depth is concentrated on just a handful of exchanges. The top 8 exchanges account for 91.7% of market depth and 89.9% of volume, with a plurality of liquidity concentrated on the top exchange, Binance.
Highly-concentrated crypto markets are both a good and bad thing. There is undoubtedly a shortage of liquidity, which when spread thin across many exchanges and trading pairs can exacerbate volatility and disrupt the price discovery process. Natural market forces have inevitably led to increasing concentration of this liquidity on a handful of platforms, which benefits the average trader.
However, highly-concentrated crypto markets can create points of failure for the industry (ex: the FTX collapse). Many centralized exchanges still lack basic protections for traders in case of failure, hacks, or market manipulation.
5. Bitcoin is less correlated to traditional assets.
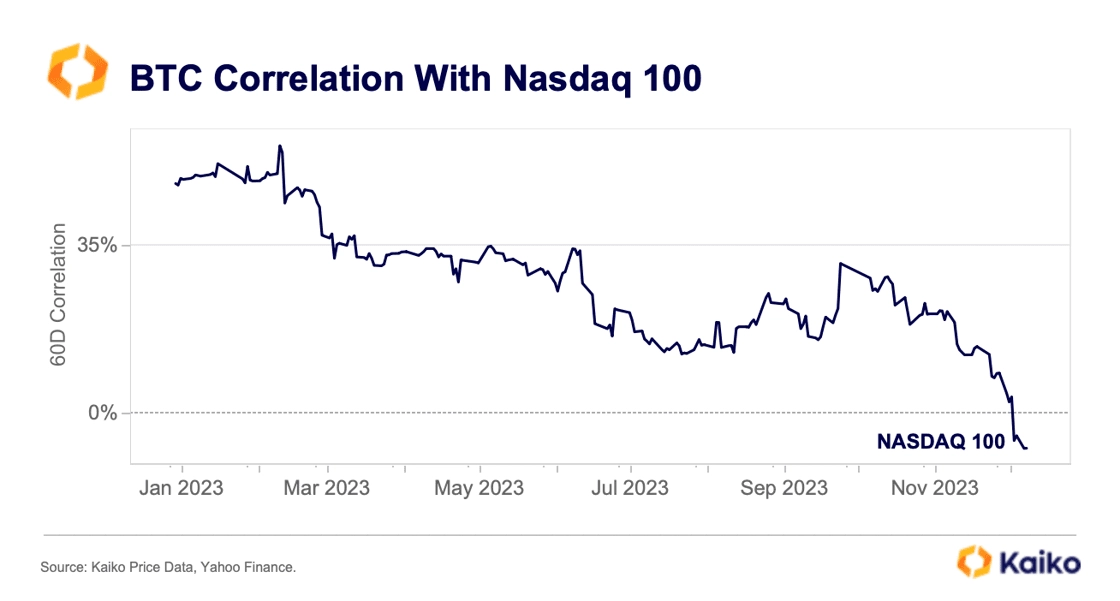
Bitcoin has long been touted as an inflation hedge, a digital alternative to gold, or an entirely new asset. But for much of its recent history, its price has largely been tied to macro conditions, the strength of the dollar, and equities. This trend began to reverse this year, with a consistent downtrend from January to July as BTC rallied and a reversal in late summer as it stalled under $30k. The most rapid decorrelation came recently, as BTC broke $40k. It remains to be seen whether this decorrelation will continue, as equity indexes – including the Nasdaq 100 – continue to break all-time highs.
6. Solana is back.
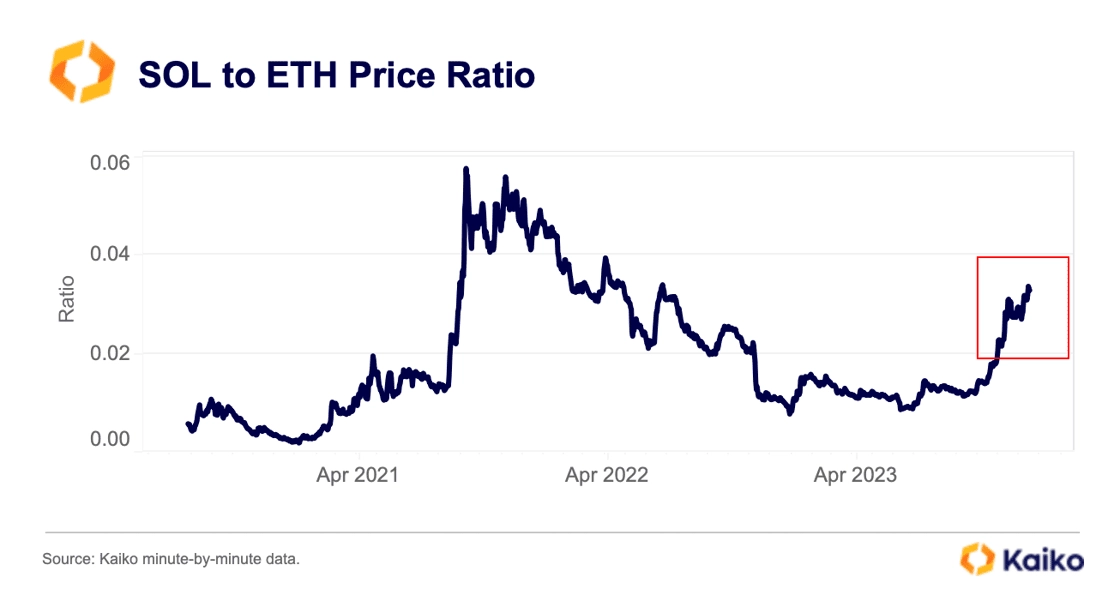
Following the collapse of FTX, some presumed that Solana, the chain backed by FTX and SBF, would die out. But instead of going away, Solana has thrived. It is most frequently compared to Ethereum, and relative to ETH it has significantly outperformed, moving from a 0.01 price ratio to a 0.03 ratio, with the majority of gains coming in the last couple of months. Solana has captured much of the market’s attention, in part on the success of its airdrops, first PYTH and later JTO. Both tokens have performed relatively well since their launches and have inspired new waves of airdrop farming, helping to boost activity on the network.
7. Stablecoin depeggings are increasingly common.
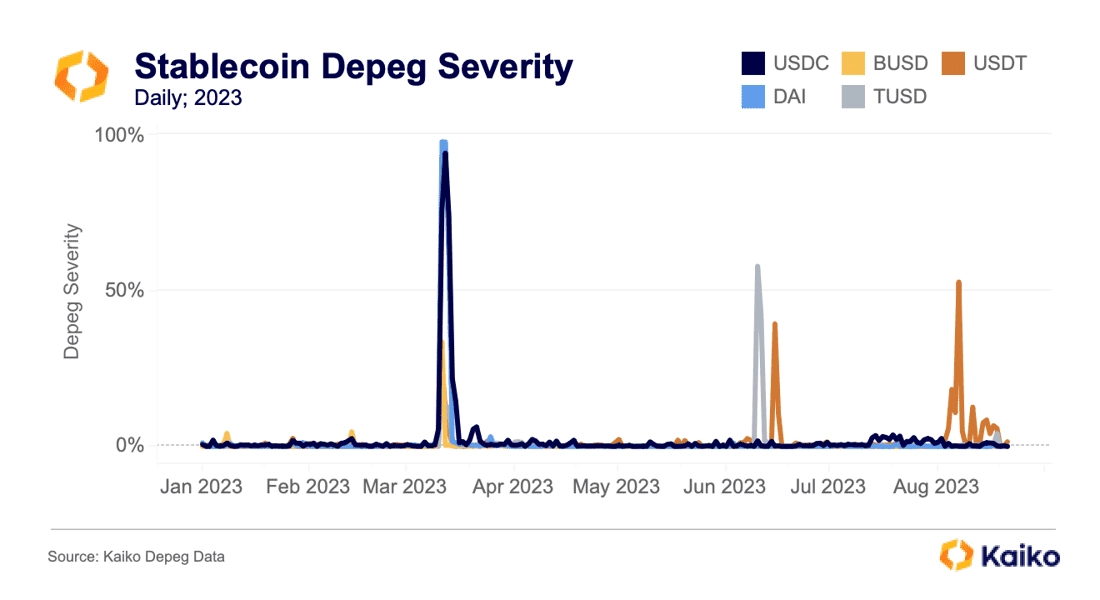
The March banking crisis may now seem like a distant memory, but it highlighted the fragility of crypto markets and their reliance on stablecoins. During the crisis, USDC experienced a severe depeg that threatened the entire DeFi ecosystem, which relies heavily on the stablecoin in lending protocols and DEXs. Then, over the summer, Tether started trading at a discount for unclear reasons, highlighting the often mysterious forces that determine the market price of stablecoins.
The term “depeg” has never been successfully defined and is consistently either over- or under-used. In a Deep Dive, we created a new methodology which examines USDC, BUSD, USDT, DAI and TUSD to understand the severity of de-pegs since the start of 2023, finding that while they were common in 2023, true “depegs” are far rarer.
8. FTX tokens rallied, reversing the estate’s fortunes.
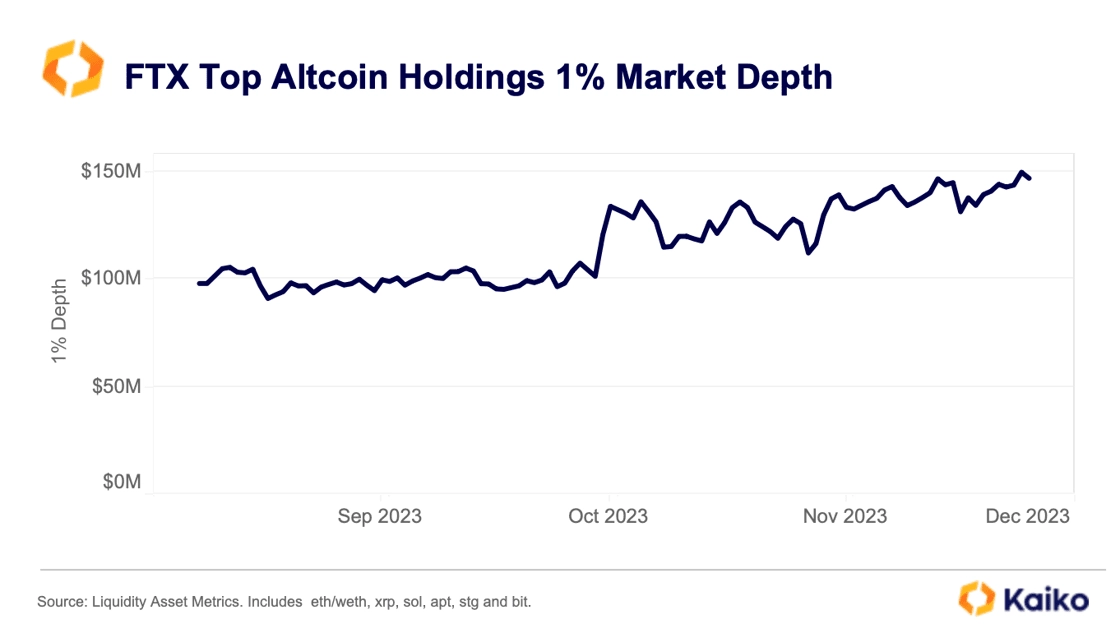
The shadow of FTX loomed large over the crypto industry as bankruptcy proceedings continued and SBF was found guilty in a dramatic trial. Yet, The recent bull rally has completely altered bankruptcy proceedings, with a real possibility that claims holders could recoup a much more significant proportion of losses than originally thought, leading to a surge in claims trading.
FTX holds billions of dollars in crypto assets that have undergone a big increase in value since September. It helps that SOL is the exchange’s top crypto holding. In the chart, we show that liquidity for the altcoins held by the exchange has increased significantly, meaning that when liquidations start, price impact could be minimal. The exchange has said they will liquidate holdings to return cash to claims holders.
9. Curve suffered a crisis of trust.
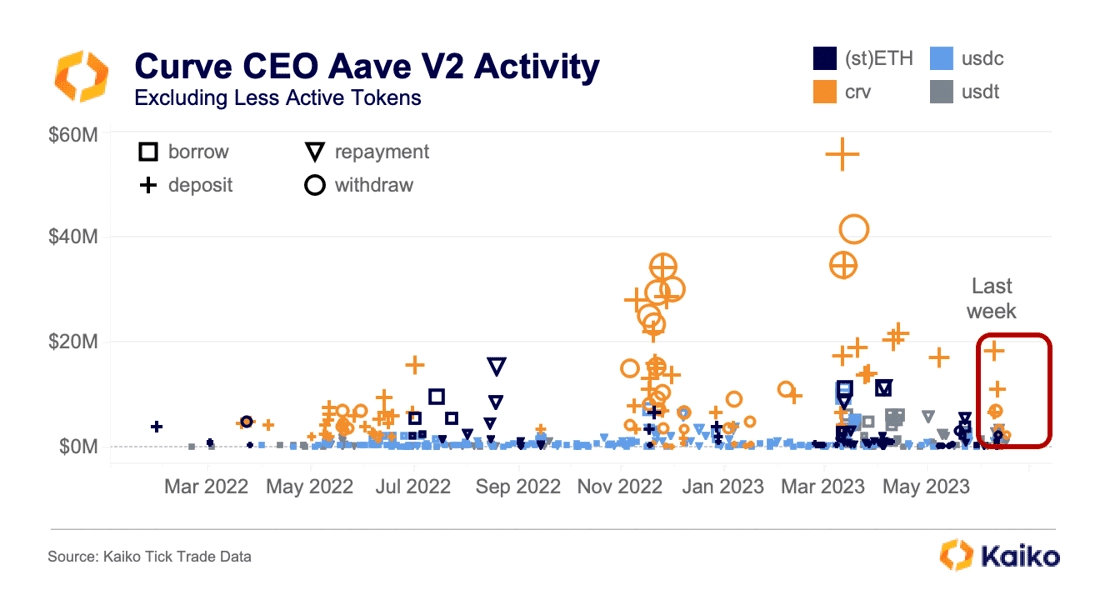
Curve Finance is one of the largest decentralized exchanges and has long been one of the primary markets for stablecoin swaps, beloved by DeFi whales and an important source of USDT, USDC and DAI liquidity. Yet, the protocol suffered a number of crises over the year amid a wider downturn in DeFi activity, contributing to an exodus of liquidity.
First, Curve’s founder Michael Egorov got into hot water in June after Twitter users noticed he had $200mn of CRV deposited on Aave to take out a $60mn USDT loan. This spurred speculation he was cashing out of the protocol, and if a liquidation threshold were hit for his loan, it would have caused widespread chaos in DeFi. The chart depicts the frequent lending positions the CEO took over a year.
Then, in August the protocol suffered a $70mn exploit, which threatened the price of the protocol’s native CRV token, which could have caused problems with Egorov’s loan.
Egorov has since settled his Aave loan, but Curve liquidity remains well below previous highs. The protocol is still an important source of liquidity and one of the largest DEXs.
10. stETH liquidity dried up.
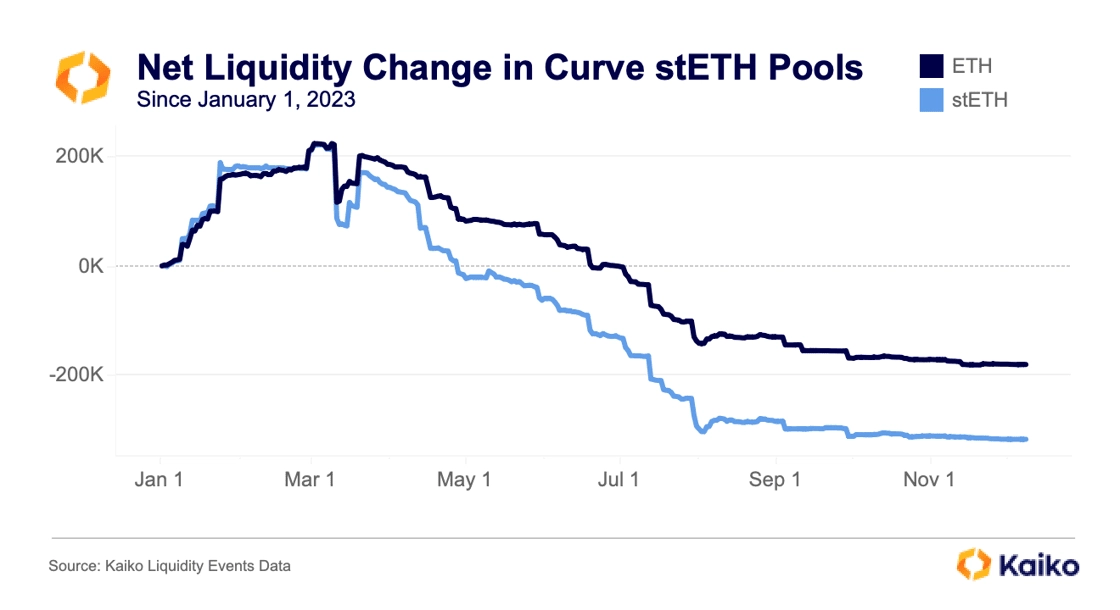
Lido Staked Ether (stETH) continued its run as, by far, the most dominant ETH liquid staking derivative. This has generated concern among Ethereum devotees regarding Lido’s influence over the network since the Shapella upgrade. There is also growing concern around stETH liquidity in secondary markets, which has plunged since the start of the year.