New Report: Bybit’s Post-Hack Liquidity Comeback

Stablecoin Liquidity: Diving Into the Data


Stablecoin

Tether

USDC

Written by Clara Medalie

30/05/2023

This analysis is powered by Asset Metrics, the most comprehensive liquidity data in the crypto industry. Asset Metrics aggregates trade and market depth information across all instruments and all exchanges.


Stablecoin Trade Volume

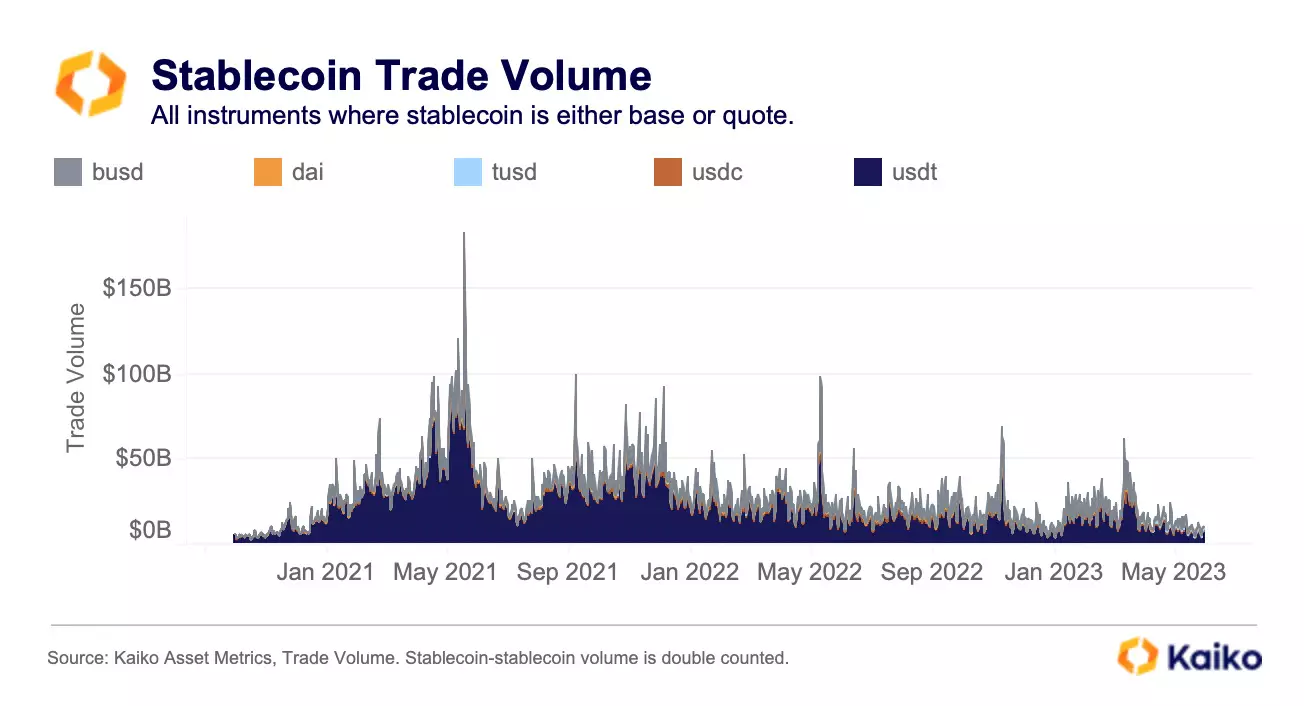
Every day, between $10-20 billion dollars worth of crypto transactions are conducted using a stablecoin on both centralized and decentralized exchanges.

This volume hit an all time high during 2021 bull run, but since then has trended downwards. Nonetheless, these markets are massive.

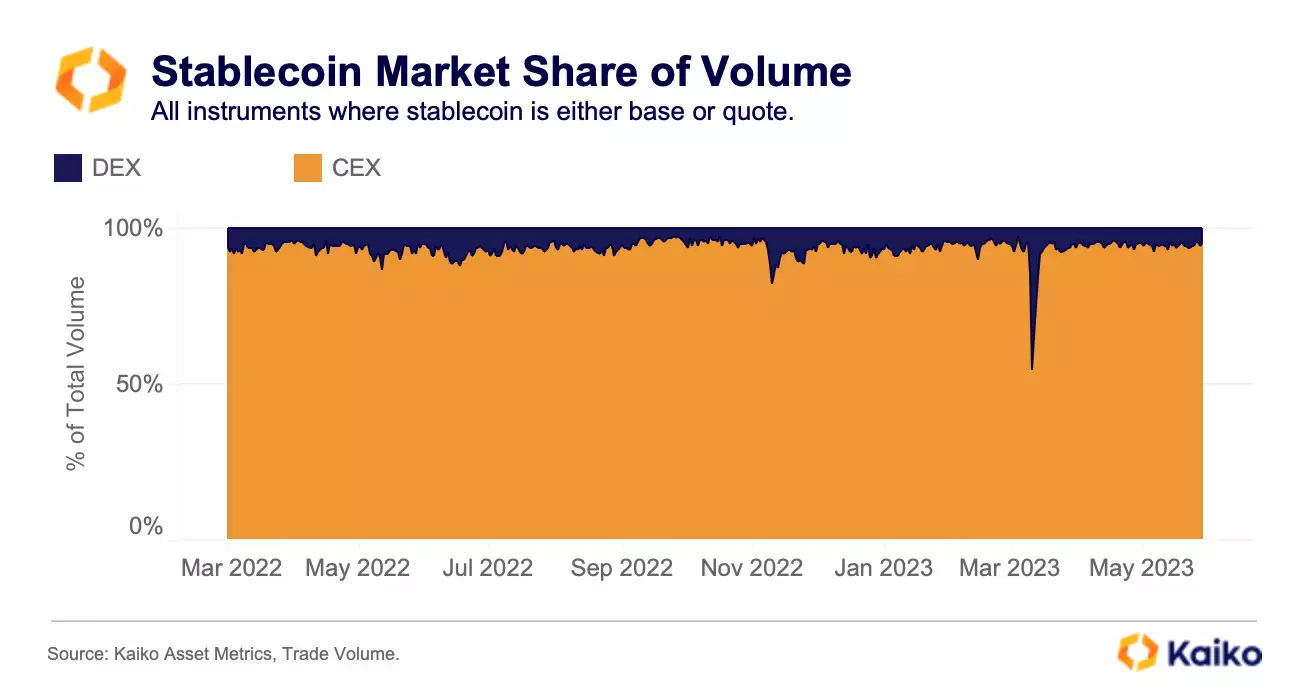
For the 5 stablecoins analyzed, the vast majority of market activity happens on centralized exchanges (94%) relative to decentralized exchanges (6%).

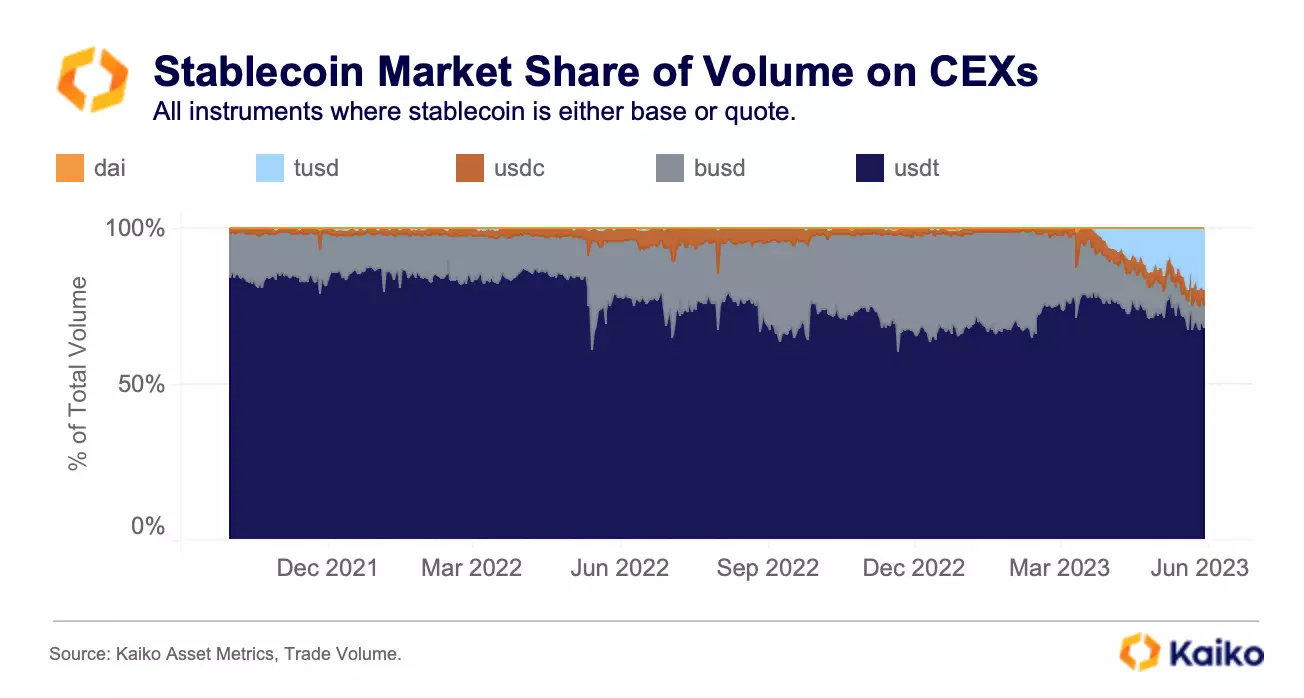
On centralized exchanges, Tether dominates market activity, possessing 68% market share. Ever since Binance’s BUSD stablecoin was effectively shut down, its market share has fallen to a mere 6.8%. Ever since, the exchange has heavily promoted the TUSD stablecoin, which was virtually unknown a few months prior.

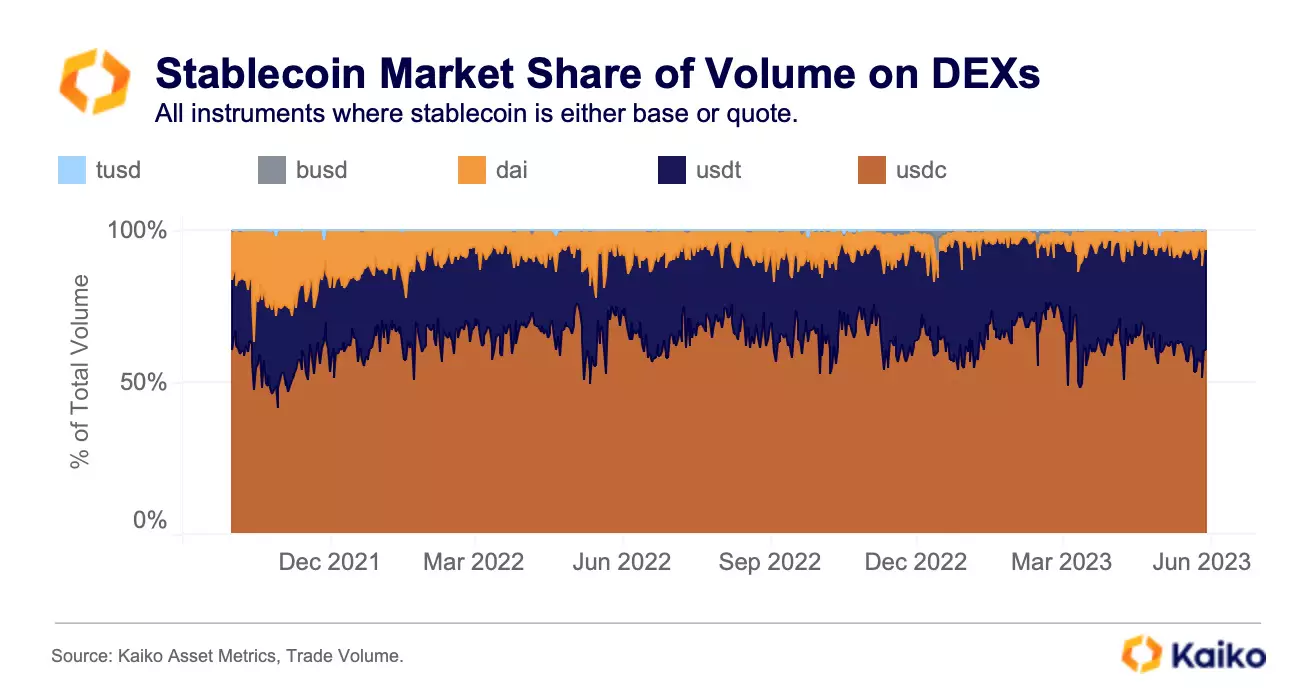
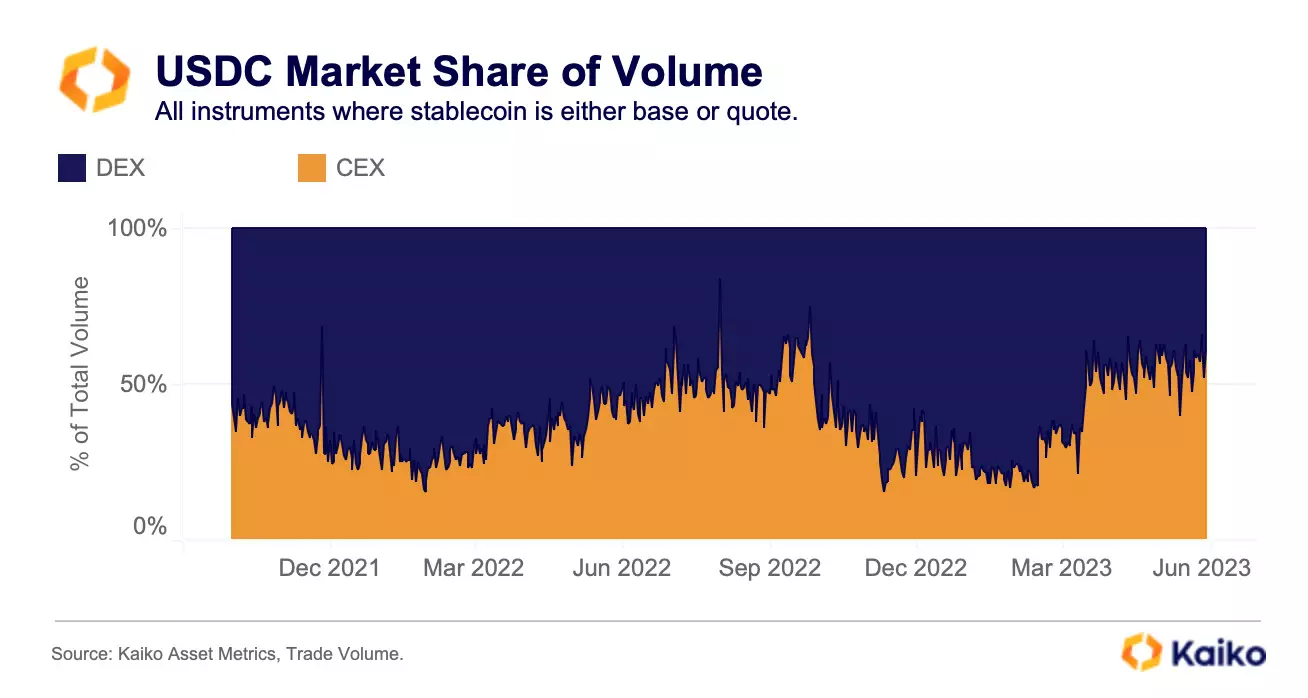
On DEXs, USDC dominates, with 60% market share. DAI used to be one of the largest stablecoins in DeFi, but its share has fallen from 25% to just 6%. Tether accounts for just 33% of market share, with 10% growth since 2021.

USDC

USDC dominates DEX activity but its activity on centralized exchanges has seen a recent surge. 60% of all activity for USDC now happens on CEXs, with just 40% on DEXs. CEX markets are magnitudes larger than DEX markets, which explains the trend.

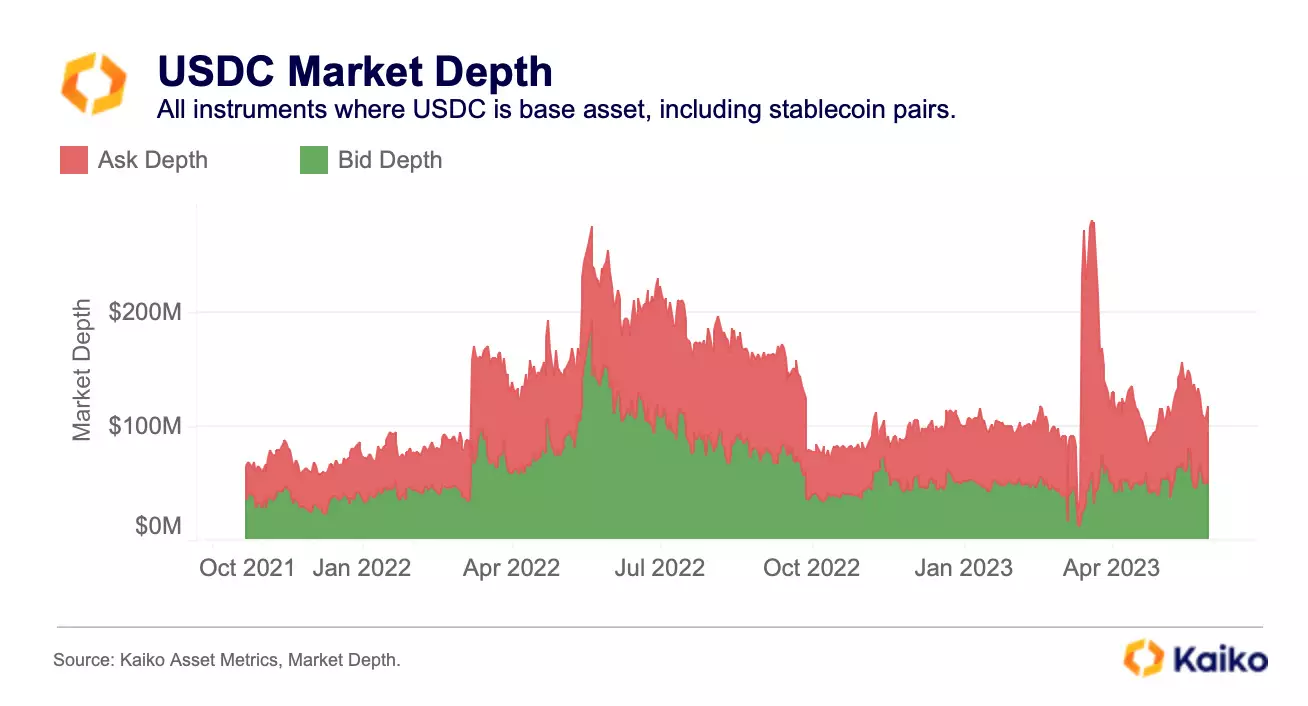
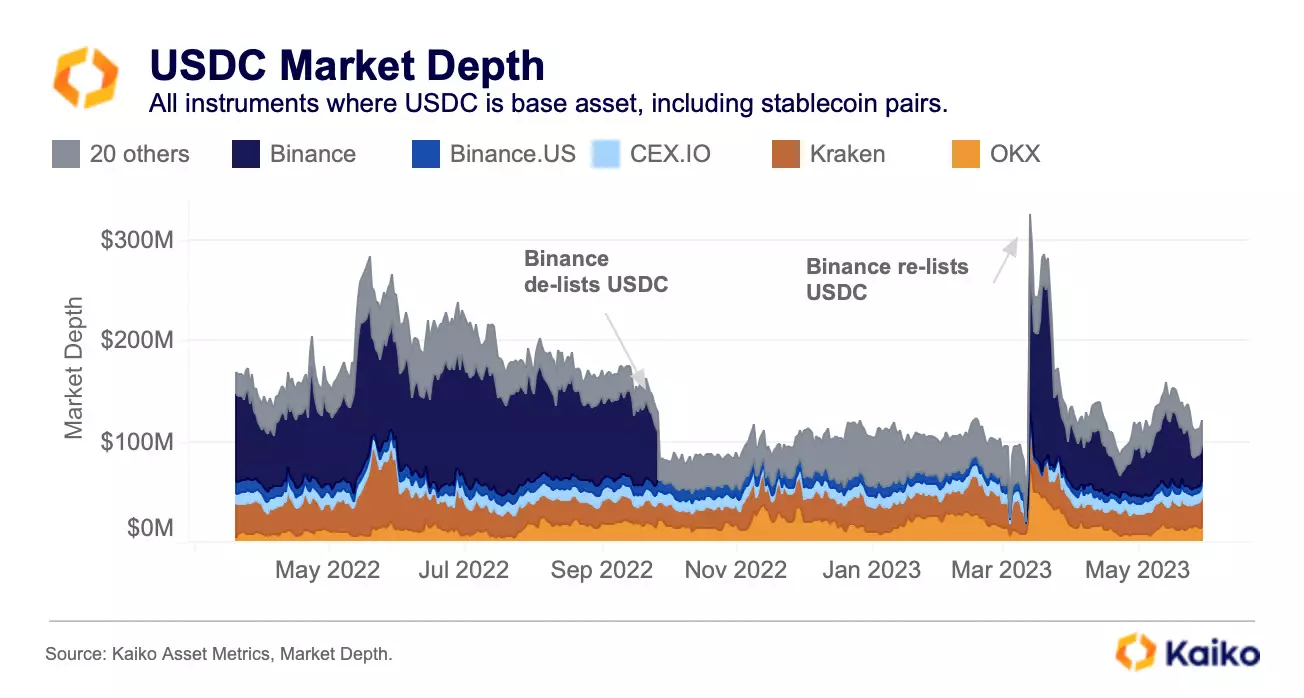
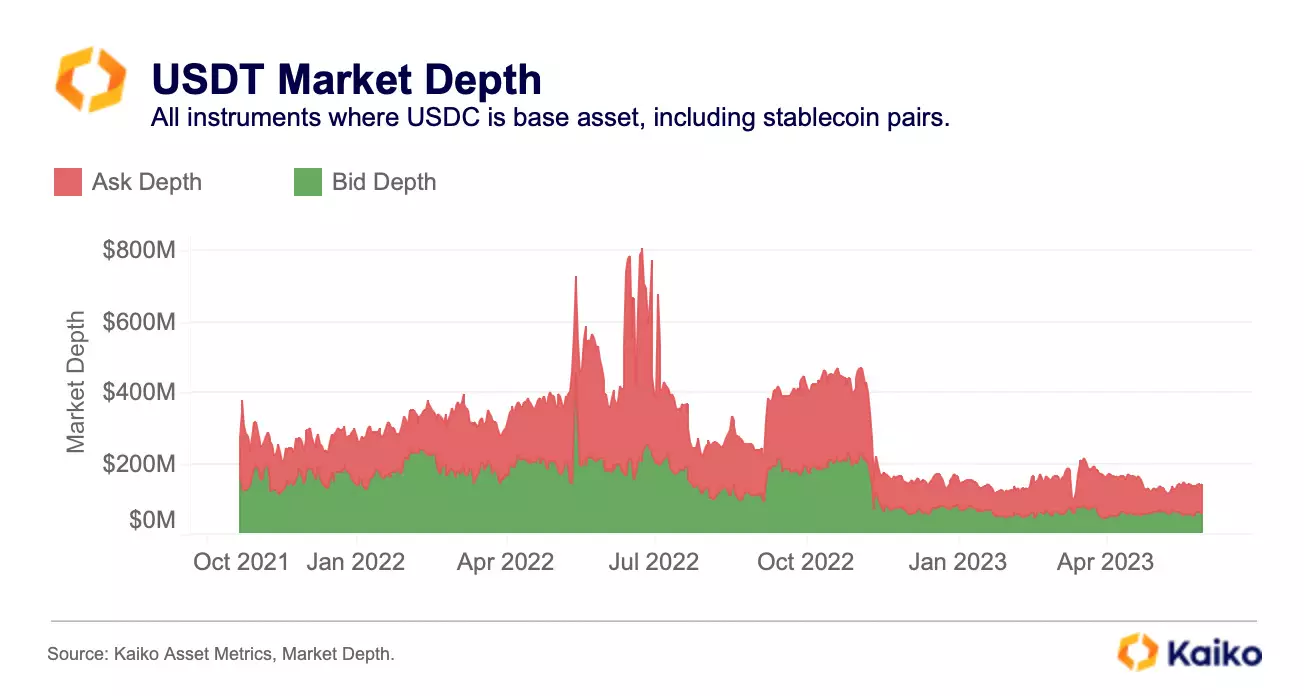
On centralized exchanges, market depth for all USDC pairs that include the stablecoin as a base asset is around $100mn within 1% of the mid price. USDC markets are important because these are the first to see activity during a de-pegging event or price volatility as traders offload USDC for USDT or USD.

USDC markets enable price discovery to happen for the stablecoin. Today, most of this liquidity is concentrated on Binance, Binance.US, CEX.IO, Kraken and OKX.

USDT

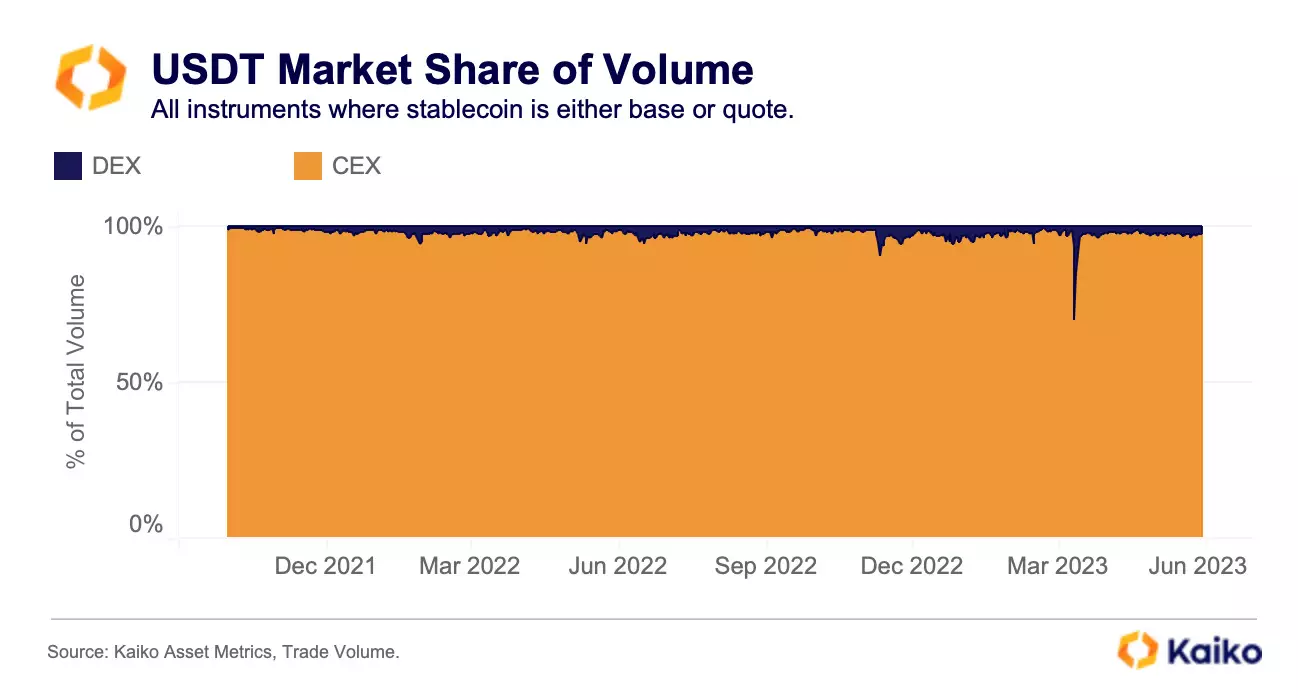
USDT trade volume is heavily concentrated on centralized exchanges, which today accounts for 97% of volume.

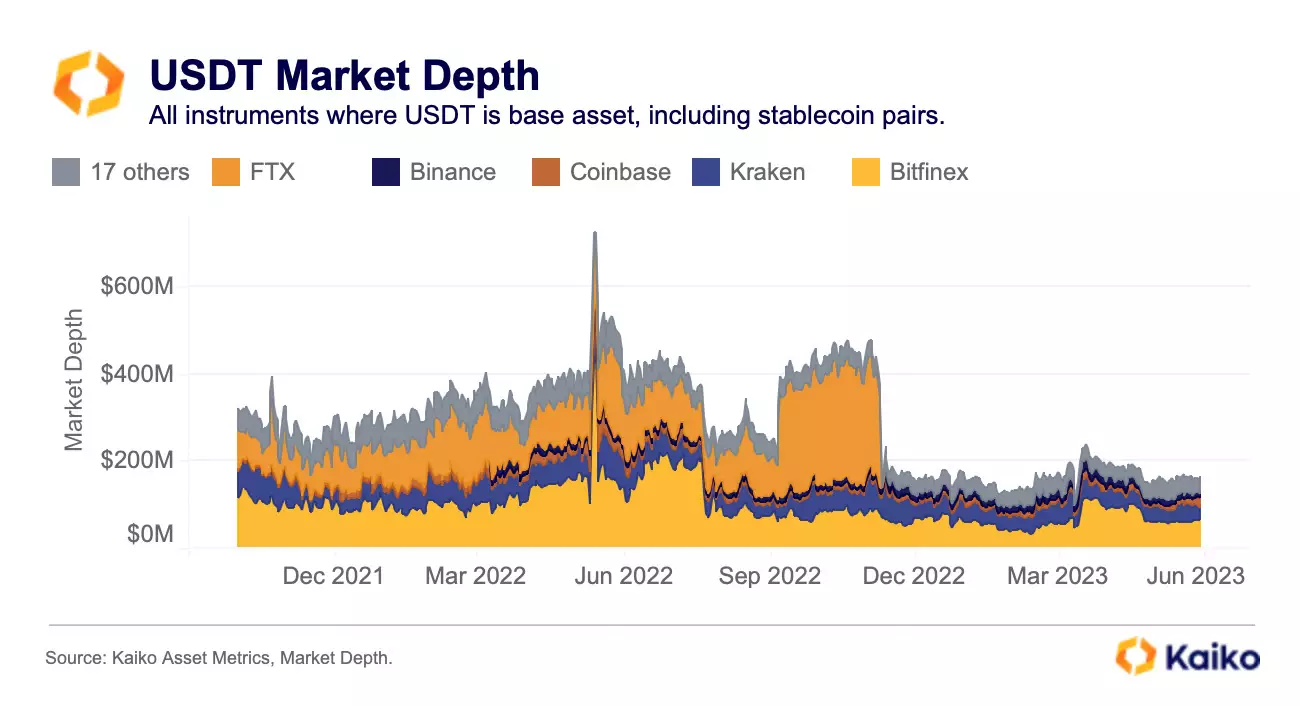
Despite having the highest trade volume, 1% market depth for USDT trading pairs is about equal to market depth for USDC, at around $200mn on both the bid and ask side.

Liquidity is concentrated mostly on Bitfinex, Kraken, Coinbase, and Binance. USDT lost a lot of liquidity with the collapse of FTX. Interestingly, USDC trades on more exchanges that offer a pair including the stablecoin as a base asset compared with USDT, enabling more opportunities for price discovery.

BUSD

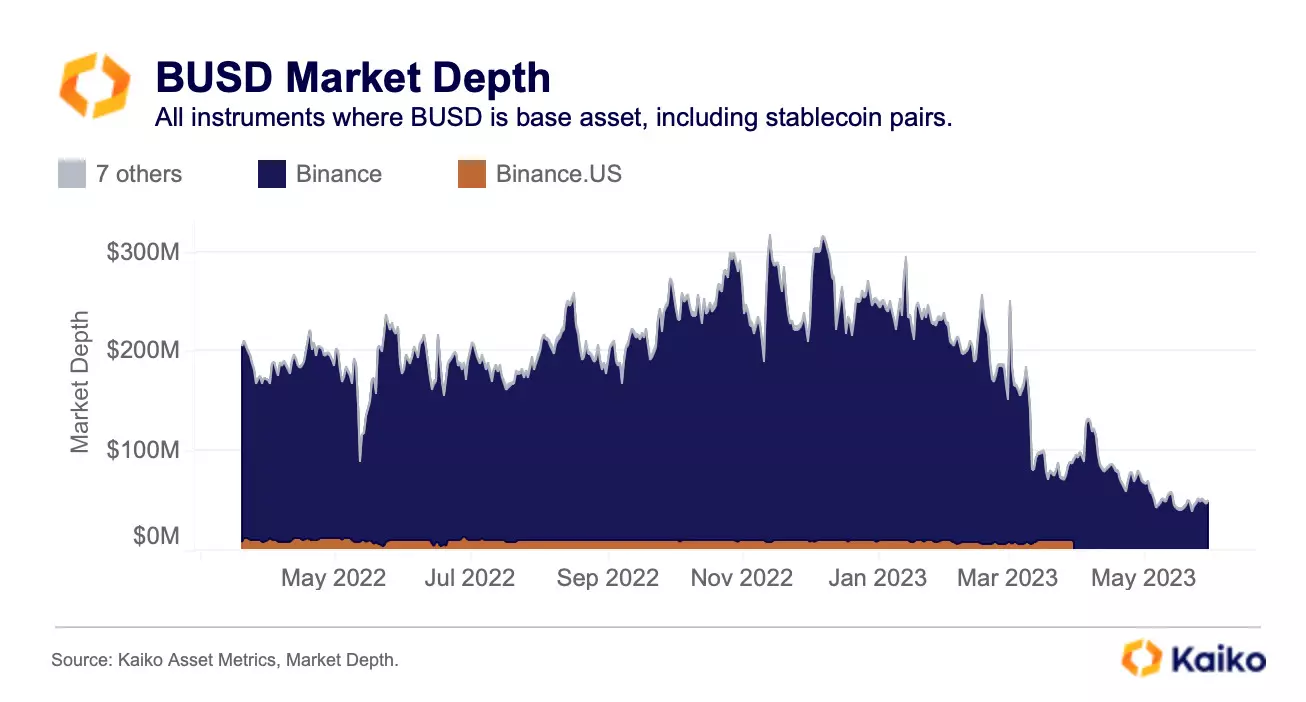
BUSD will soon cease to exist after Paxos was forced to halt issuance, and since then market depth has plummeted from a high of $300mn to just $50mn.


The Data

This analysis leverages Kaiko’s Asset Metrics, which aggregates data across all instruments and all exchanges.

Trade volume takes the total sum of volume for all pairs that include the asset as either the base or quote. For example, volume includes both USDC/USD + BTC/USDC trade volume.

Market depth data aggregates bids and asks across markets that include the asset as the base. For example, market depth includes just USDC- pairs, not -USDC pairs. Kaiko offers instrument-level market depth data that can be used in a separate analysis of -USDC market depth.

Asset Metrics:

The Ultimate Liquidity Toolkit

Asset Metrics provides information and liquidity metrics at the asset level. Aggregating data across all pairs and exchanges, this product gives you a global understanding of an asset’s market structure. 

  • Trading activity: global volumes for thousands of instruments

  • Liquidity: market depth from .01% to 10% aggregated across order books

  • Addresses: distribution of an asset’s supply across a network

  • Coverage: all assets and exchanges covered by Kaiko

Never Miss an Analysis

More From Kaiko Research

  • Bitcoin

    26/05/2025 Data Debrief

    Bitcoin's Latest Record Move in 10 Charts

    Bitcoin hit a new all-time high last week, but sentiment remains cautious beneath the headline gains. In this week’s Debrief, we break down what’s driving the move in ten charts. Macro uncertainty, particularly around the U.S. fiscal outlook, is still weighing on risk appetite. While retail participation remains muted, institutional demand is growing, supported by ETF flows, corporate accumulation, and renewed momentum on the regulatory front.

  • Liquidity

    19/05/2025 Data Debrief

    A Summer of Uncertainty Ahead?

    Bitcoin barely moved, holding near $103K on Monday after Moody’s stripped the U.S. of its last triple-A rating amid mounting debt. Meanwhile, Coinbase entered the S&P 500, but the euphoria was short-lived. The exchange revealed that client information was stolen as hackers sought to blackmail the firm, with costs related to the incident expected to reach $400 million.

  • Ethereum

    12/05/2025 Data Debrief

    Could Pectra reset ETH’s bull case?

    Ethereum surged by nearly 40% last week, outperforming BTC after its largest upgrade to date. Meanwhile, Coinbase made headlines with its $2.9 billion acquisition of Deribit, and New Hampshire became the first U.S. state to approve a crypto reserve law.

  • USDC

    05/05/2025 Data Debrief

    USDC Outpaces Rivals.

    Bitcoin held near $95K on Monday as markets brace for this week’s Fed meeting. Last week’s U.S. data showed the economy losing steam despite solid job growth—Q1 GDP contracted as importers raced to stockpile goods ahead of tariffs, while consumer sentiment continued to slide. Meanwhile, Tether posted$1B in Q1 profits, and Arizona’s governor vetoed a bill that would have let the state hold Bitcoin.