September Analyst Call: Breaking Down the Summer Sell-Off

Market Makers Continue to Reduce Liquidity

Binance

Bitcoin

Liquidity

15/05/2023

Welcome to the Data Debrief!

BTC and ETH erased most gains as the Dollar made a strong comeback. In industry news, the Ethereum network suffered technical issues, U.S.-based Bakkt de-listed 25 tokens under regulatory pressure, and Binance.US is reportedly trying to cut CZ’s dominant stake in the exchange.

  • The state of U.S. exchange liquidity.

  • Turkish crypto activity amid a highly contentious election.

  • Binance derivatives volume 45 days after the CFTC lawsuit.

  • Bitcoin intraday volatility.

Trend of the Week

Jump and Jane Street scale back market making.

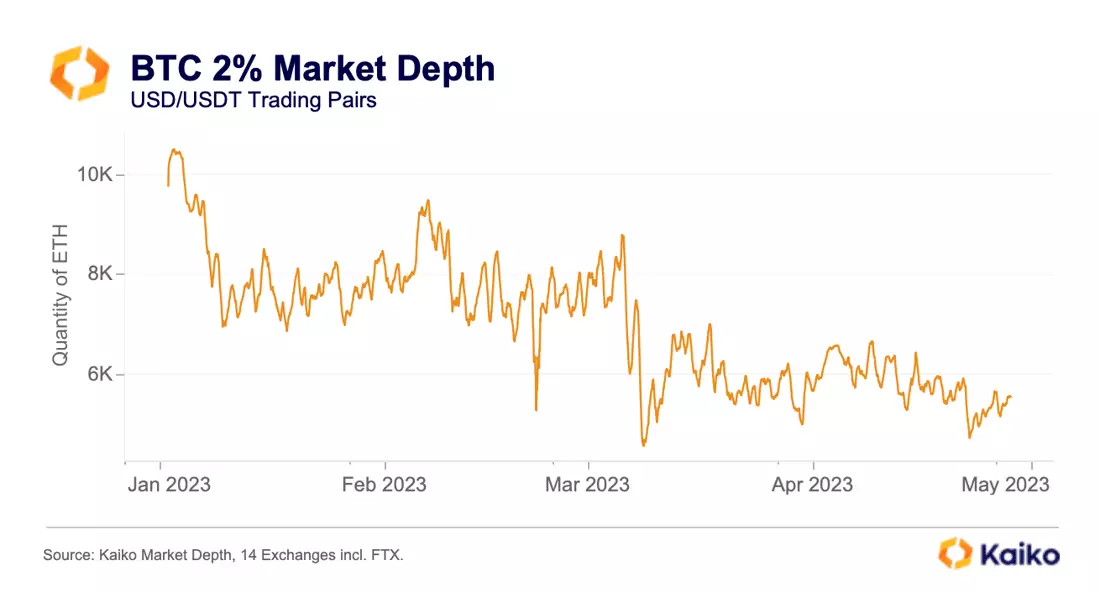
Last week, some of the biggest market makers in crypto, Jane Street and Jump Crypto, announced they were winding down some of their crypto exposure, particularly in the U.S due to regulatory uncertainty. This move should have major implications for liquidity in the industry which has already lost several big players over the last year. Interestingly, market depth for BTC has barely shifted since the announcement or over the past month, remaining at depressed levels. This seems to indicate that Jump and Jane Street already reduced the majority of their exposure, or have yet to make those adjustments. With the gradual decline in market depth year-to-date, it seems more likely it’s the former.

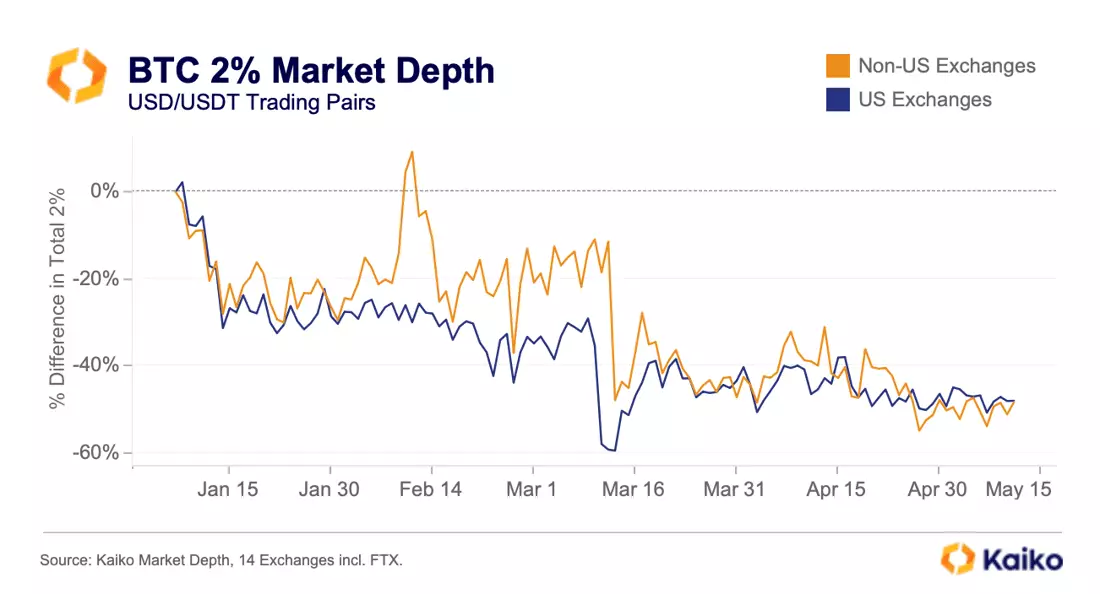
Interestingly, market depth on U.S exchanges hasn’t been more affected by the reduction in liquidity as was implied by the announcement.

Apart from a sharper dip mid-March as the banking crisis unfolded, U.S. exchanges have experienced a similar decrease in BTC liquidity — about 50% since the start of the year.

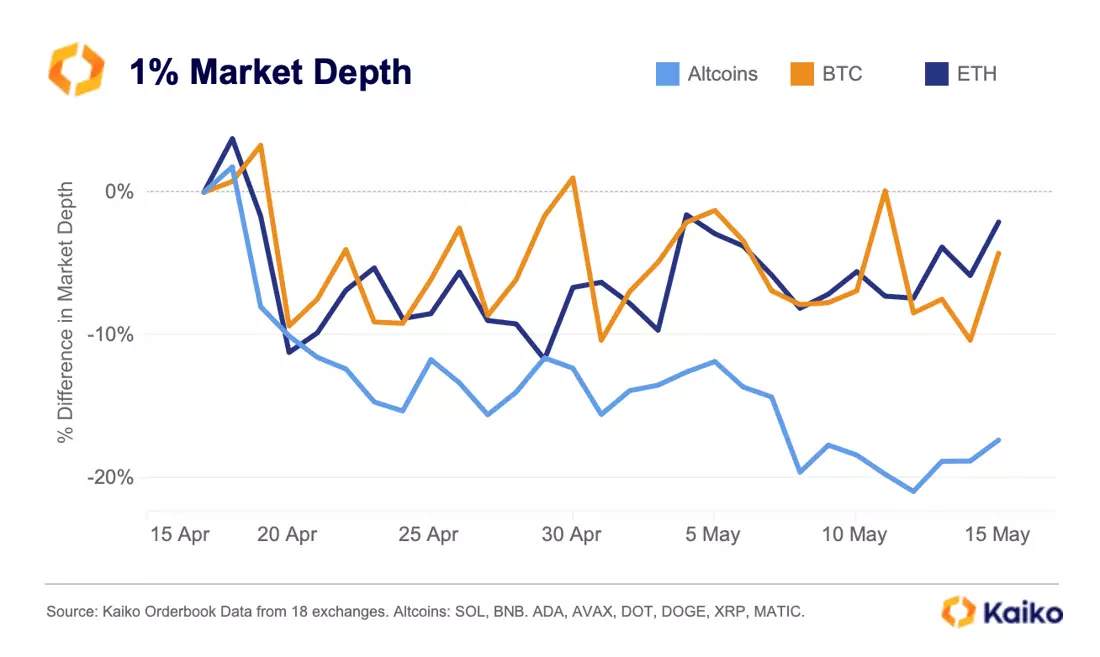
Jump Crypto, in particular, was known for providing a significant amount of altcoin liquidity in the space. This seems to be reflected in the data, as altcoin liquidity has fallen more sharply than that of BTC and ETH over the past month.

Altcoin liquidity has fallen roughly 17% over the last month, compared with a 4% drop for BTC and a 2% drop for ETH.

Never Miss an Analysis

Price

Low liquidity boosts BTC intraday volatility.

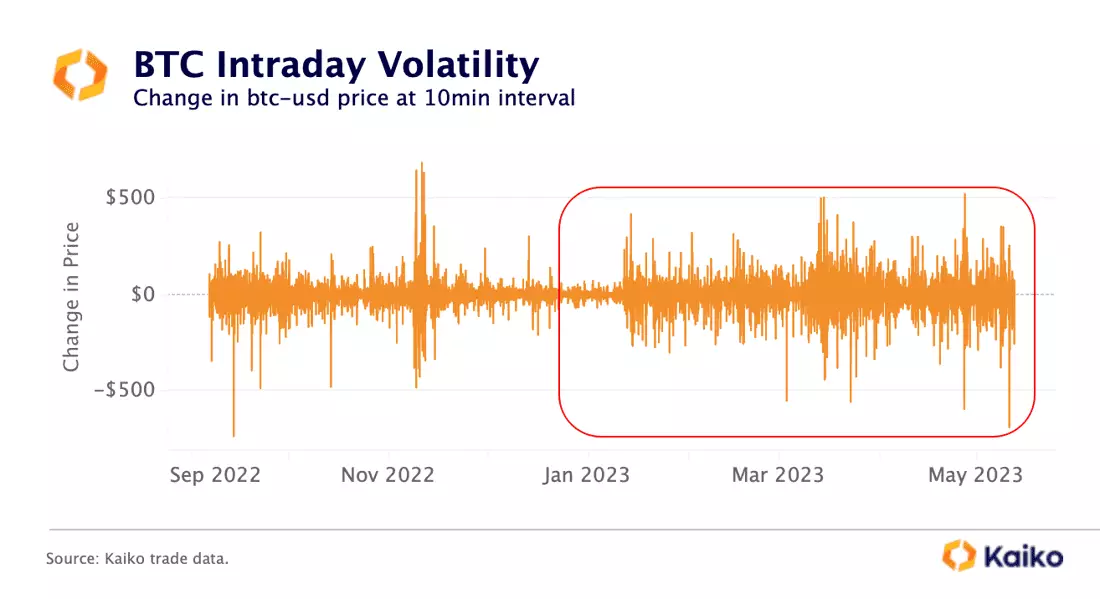
Bitcoin’s intraday volatility, as measured by BTC price changes every ten minutes, has increased this year as liquidity has fallen to a one-year low. This means that large market orders have a greater impact on the market, both up and down, amplifying market movements. On average, the BTC price moved up or down by $10 every 10 minutes in Dec 2022, while it moved by an average of $34 from March 1 to May 11. The increase in intraday volatility comes even though BTC’s 30-day rolling volatility remains low at around 36%, well below its 2020-2022 average.

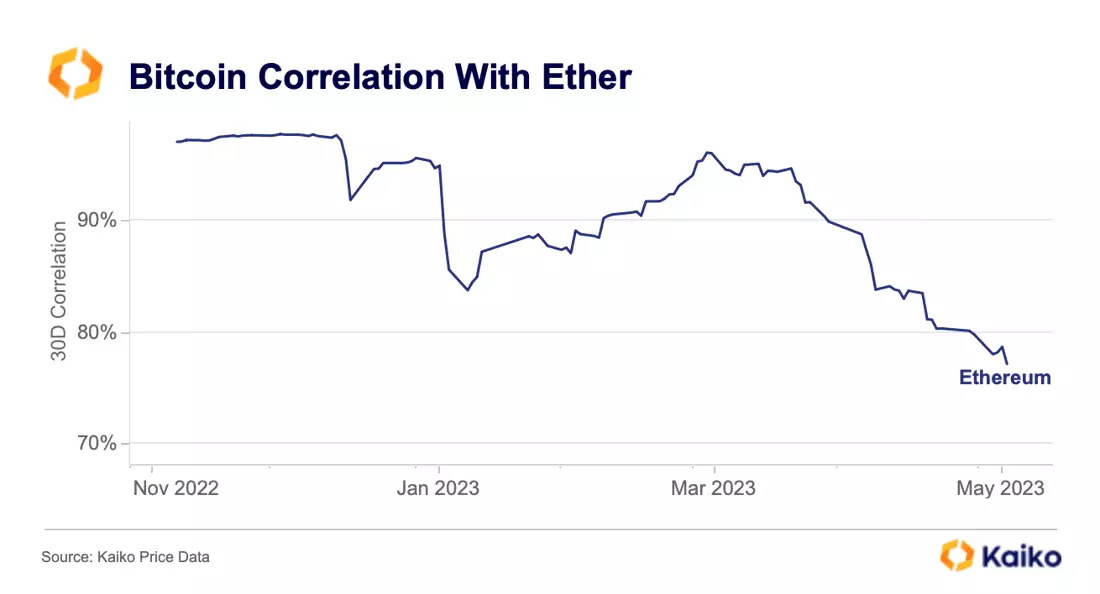
BTC correlation with ETH hits lowest level since 2021.

BTC’s rolling correlation with ETH has weakened from 96% to 77% since mid-March — its lowest level since November 2021. ETH has lost momentum since the Shapella upgrade, dropping by nearly 14% while BTC is down by around 11% over the same period. Overall, both BTC and ETH seems increasingly driven by divergent idiosyncratic factors.

Liquidity

Turkish crypto activity spikes amid contentious election.

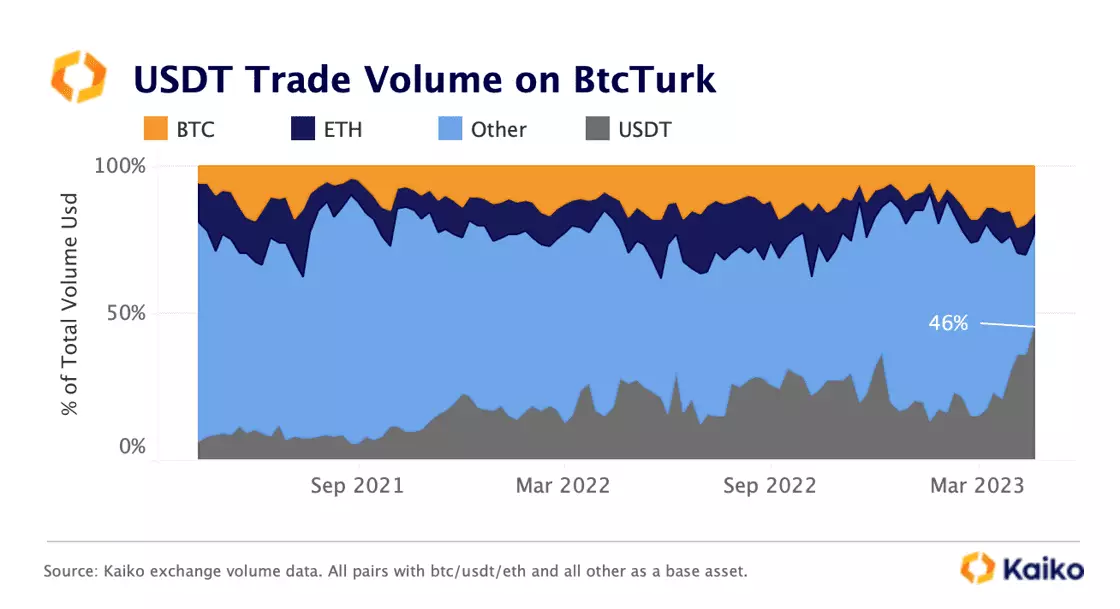
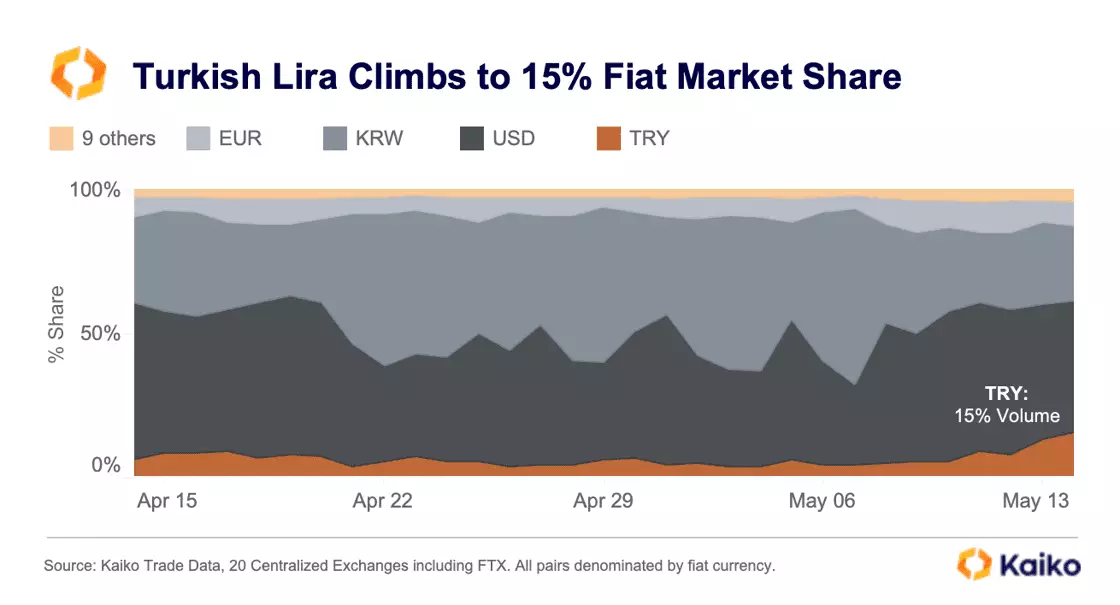
The highly contentious Turkish election has caused a new wave of currency volatility, with the Turkish Lira (TRY) hitting a new all-time high of nearly 20 TRY per U.S. Dollar. Historically, Turkey has had a very active crypto market in large part due to the country’s high inflation, which exchanges like BTCTurk and Binance have taken advantage of with a range of TRY-denominated trading pairs.

Unsurprisingly, stablecoins are one of the most popular traded assets. Out of all traded assets on BTCTurk, Tether (USDT) recently hit an all time high market share of more than 46%. To avoid potential wealth depreciation, investors are trading Lira for the dollar-pegged stablecoin.

Globally, TRY-denominated trade volume has increased relative to other fiat currencies in the run-up to the elections, which suggests the high degree of uncertainty has contributed to a spike in crypto activity. From one week to the next, TRY-denominated crypto volume went from accounting for just 5% to more than 15% of global fiat-denominated crypto volume.

Liquidity analysis: Binance “Innovation Zone” tokens.

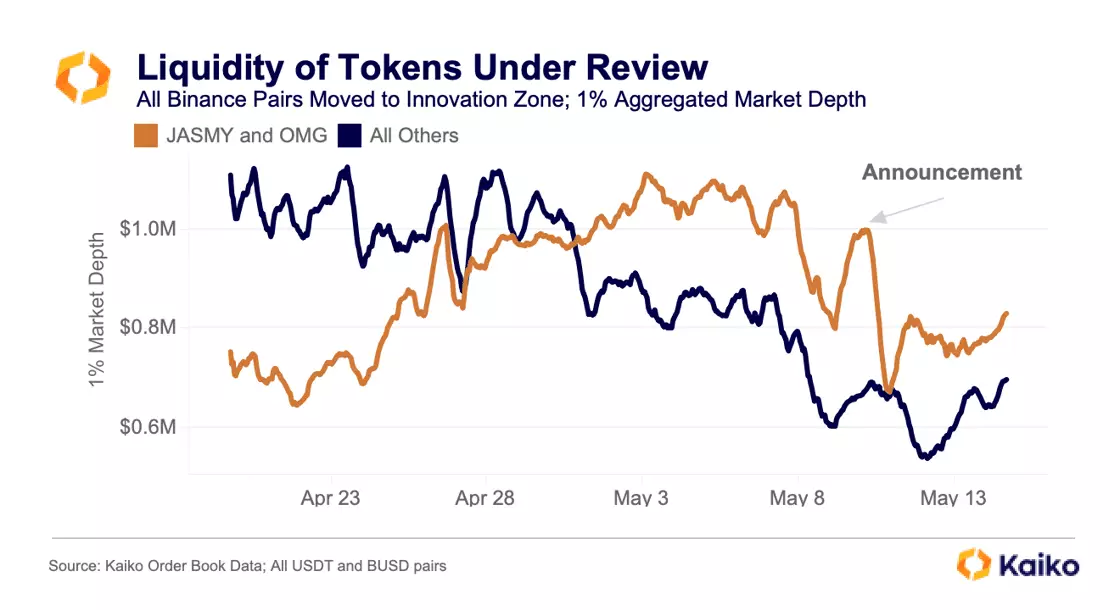
Binance announced last week that it would be moving 18 tokens to its “Innovation Zone”, where they are subject to more frequent and rigorous reviews while still being available for trading. The Innovation Zone is described by the exchange as a place for “new, innovative token offerings that will likely have higher volatility.” However, Binance CEO CZ said that this batch of tokens contained “no-progress projects” and that the exchange was moving them as an intermediate step before potential delisting.

OMG Network (OMG) and JasmyCoin (JASMY) are by far the most liquid tokens to be moved, together holding more liquidity than the other 16 combined. Liquidity – as measured by 1% market depth in USD – for the other 16 has fallen steadily over the last month, from $1.1mn to $500k. Liquidity for JASMY and OMG had increased over the past month, but dropped 25% on the news that they were being moved to the innovation zone.

TUSD-USDT no longer crypto’s most liquid pair.

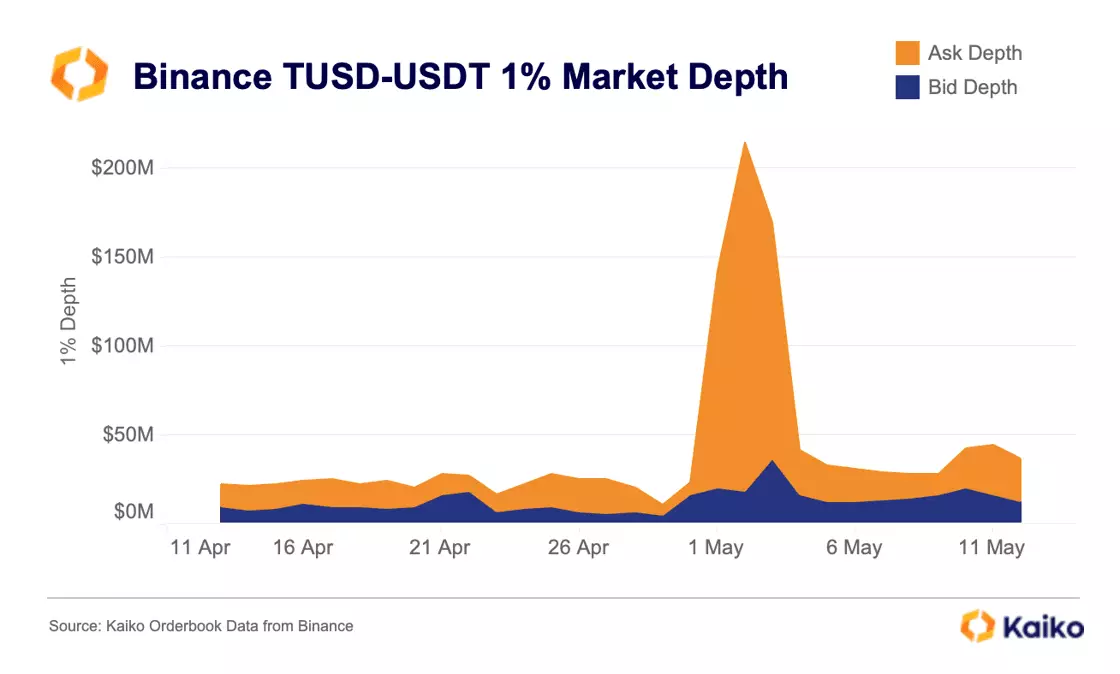
Two weeks ago, we reported on TUSD-USDT becoming the most liquid pair in crypto. We hypothesized that one of the main reasons for the huge spike was the SUI launchpad on Binance, a pool that required either TUSD or BNB to be staked in order to be eligible for an airdrop of SUI. This drove demand higher for TUSD as volumes spiked, and market depth had to be boosted as a result, particularly on the ask side as market makers looked to profit off a spike in demand for TUSD. However, after the SUI airdrop was released to stakers, the depth for TUSD retraced back to its normal levels, and it is no longer the most liquid pair in crypto.

Did the FTX estate miss out on SUI?

The highly-anticipated SUI token launched shortly after Mysten Labs, the main developer for the network, bought back its stake from the FTX bankruptcy estate, which included warrants for the token. Because SUI made strong gains in the first weeks of trading, some are now considering it a poor financial decision on the part of the estate. FTX’s SUI warrants could have been worth up to $1bn had they not sold the entire investment for a relatively paltry $93mn.

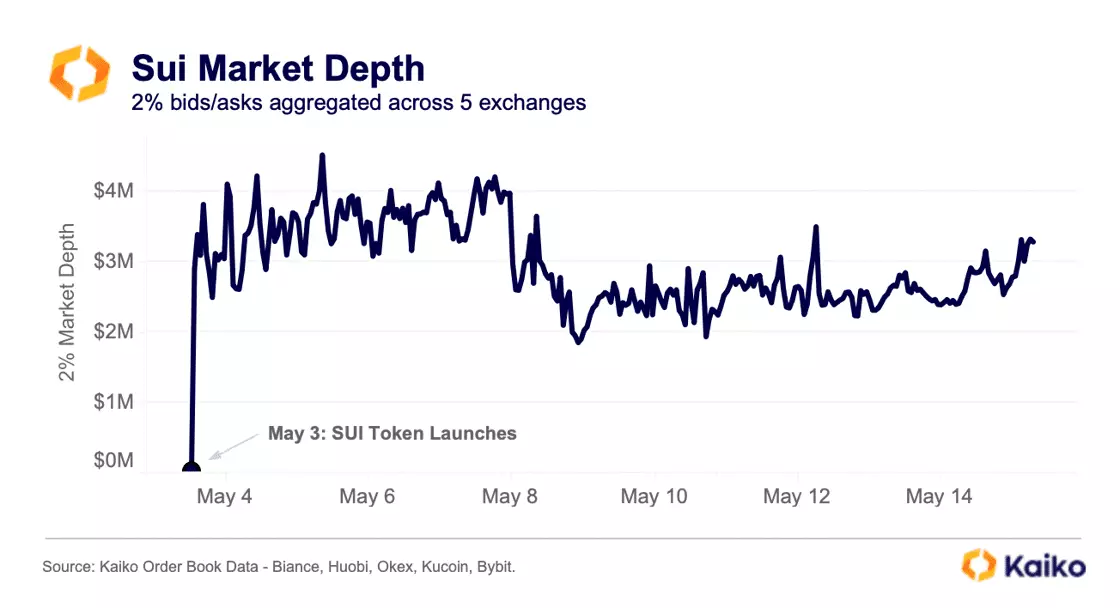
So would FTX have been able to sell $1bn in SUI? Probably not in any convenient way. Some of the largest spot markets for SUI trade on Binance, Huobi, Okex, Kucoin and Bybit, and combined they have around $3mn in 2% market depth. The bid side of SUI order books has just $1.5mn, meaning a wave of sell orders would have a significant impact on price.

Implied Volatility

Surfaces Now Live

Kaiko’s IV surface data follows the launch of IV Smiles last year. The new addition includes space and time interpolation, enabling even more precise and complete analysis for clients. The product now has the ability to provide accurate volatility for a range of expiry dates and strike prices, even those not listed.

  • introduction of multi-source aggregation

  • more robust and manipulation-resistant, using a trusted transparent methodology

  • advanced algorithms and new interpolation framework

  • stay ahead of market trends & make informed trading decisions

Derivatives

Binance volume drops during U.S. hours post-CFTC.

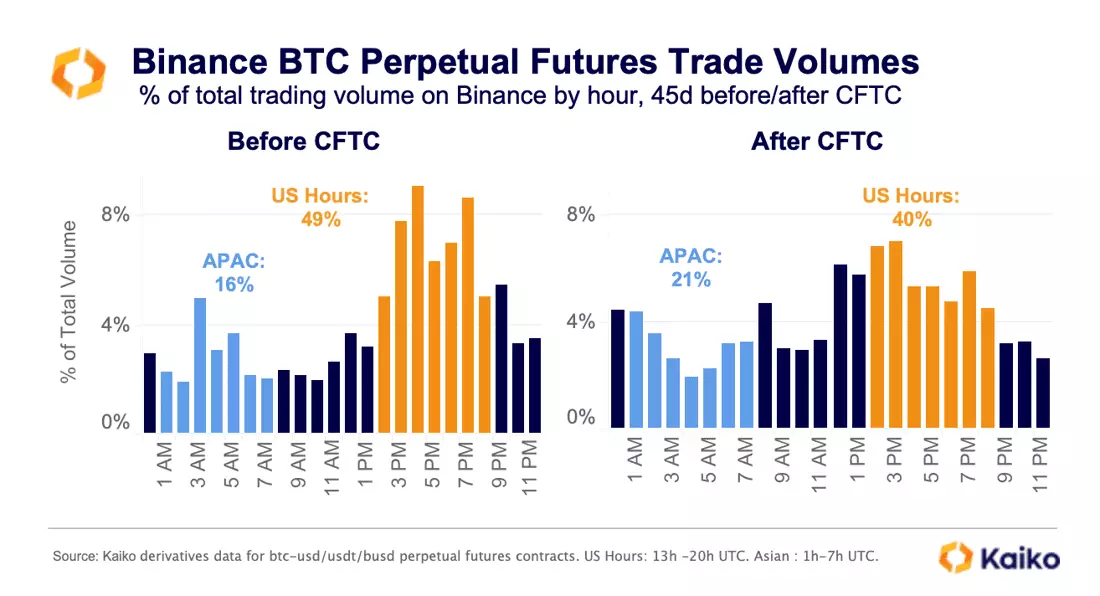
The share of BTC perpetual futures traded during U.S. trading hours (2 p.m. to 8 p.m. UTC) has declined from 49% to 40% in the 45 days following the CFTC’s action against the exchange. In March, the CFTC charged Binance with intentionally circumventing federal laws and operating an illegal exchange for derivatives on digital assets, alleging they willingly enabled U.S.-based traders to use the platform. The lawsuit appears to have negatively impacted trading during U.S. business hours, while trading during APAC hours (1:00-7:00 UTC) has increased slightly.

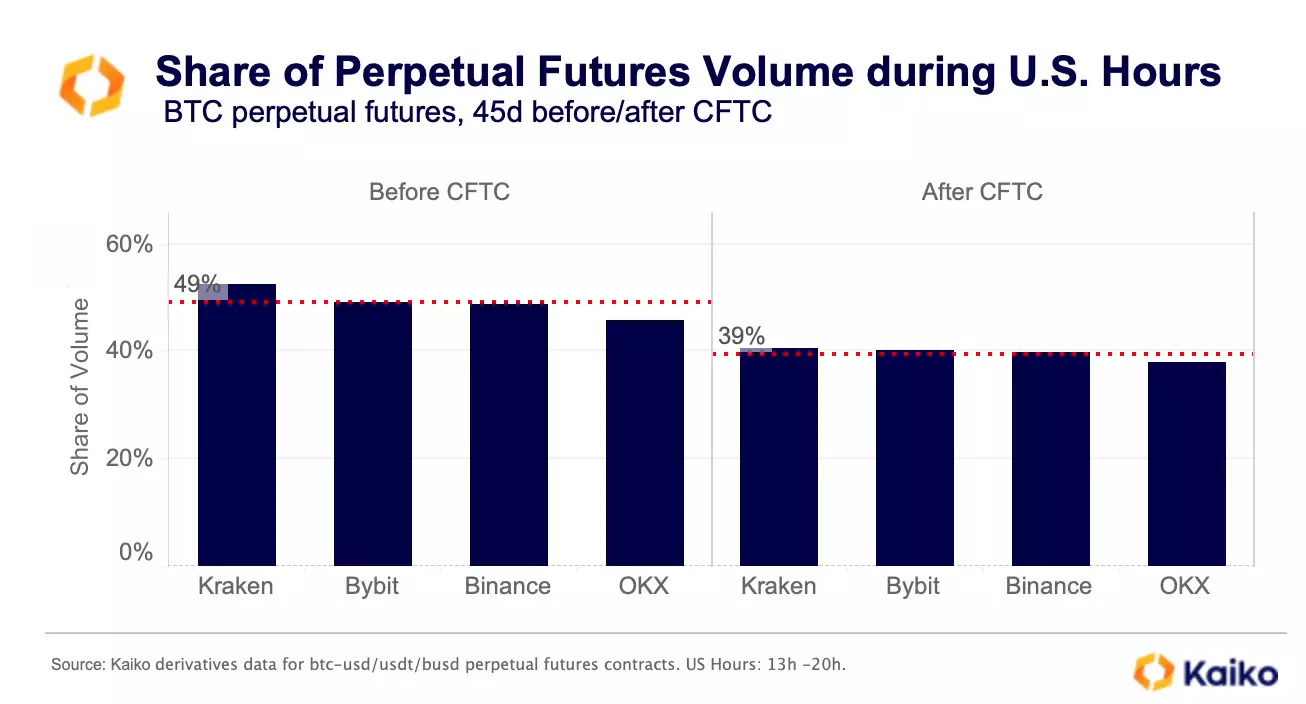
Yet, Binance isn’t alone in experiencing a volume drop during U.S. hours. Post-CFTC, the average share of BTC perpetual futures traded during U.S. business hours dropped significantly from 49% to 39%. Notably, the percentage of BTC perpetual futures traded during U.S. hours on Kraken and Bybit exceeded that on Binance, hovering around 50% before the CFTC lawsuit. This stark decrease suggests that traders active during U.S. hours across various derivatives exchanges have since curtailed their activity.


Macro

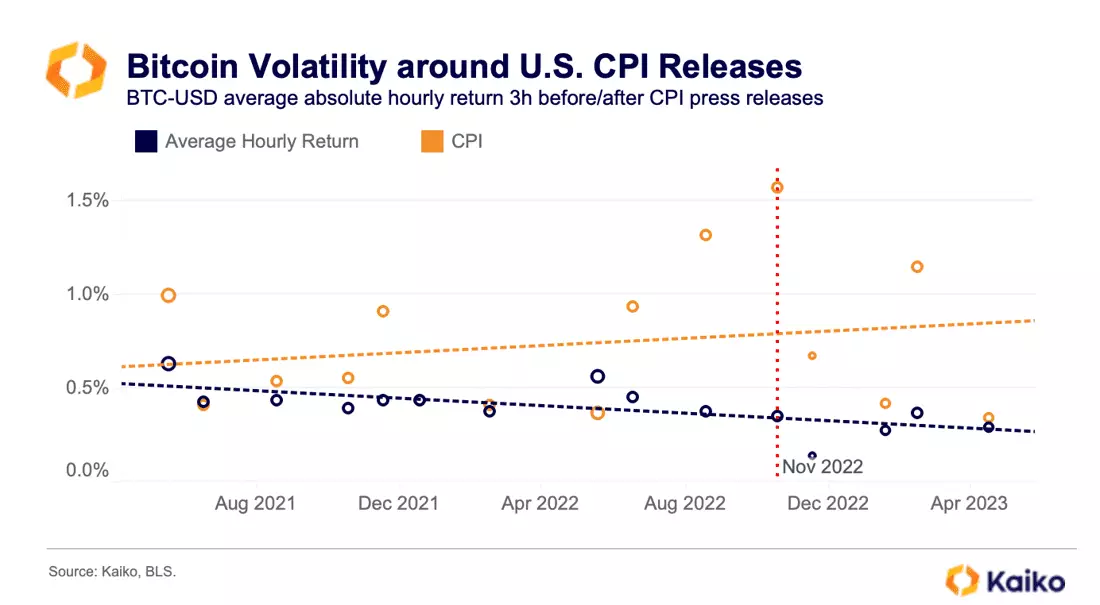
BTC volatility around CPI releases drops.

BTC’s volatility around U.S. CPI releases has decreased since Nov 2022, although it remains well above average for the month. This can be attributed to inflation becoming more predictable, with Bloomberg’s survey of economists accurately predicting four out of the six past core CPI numbers. Despite inflation remaining above target, the lack of an upside surprise allows the U.S. Fed to pause its aggressive monetary policy hiking.

Overall, intraday BTC volatility has been increasing this year, suggesting rising uncertainty around other risks. The ongoing turmoil in U.S. regional banks and the highly publicized debate on the U.S. debt ceiling are negatively affecting risk sentiment.

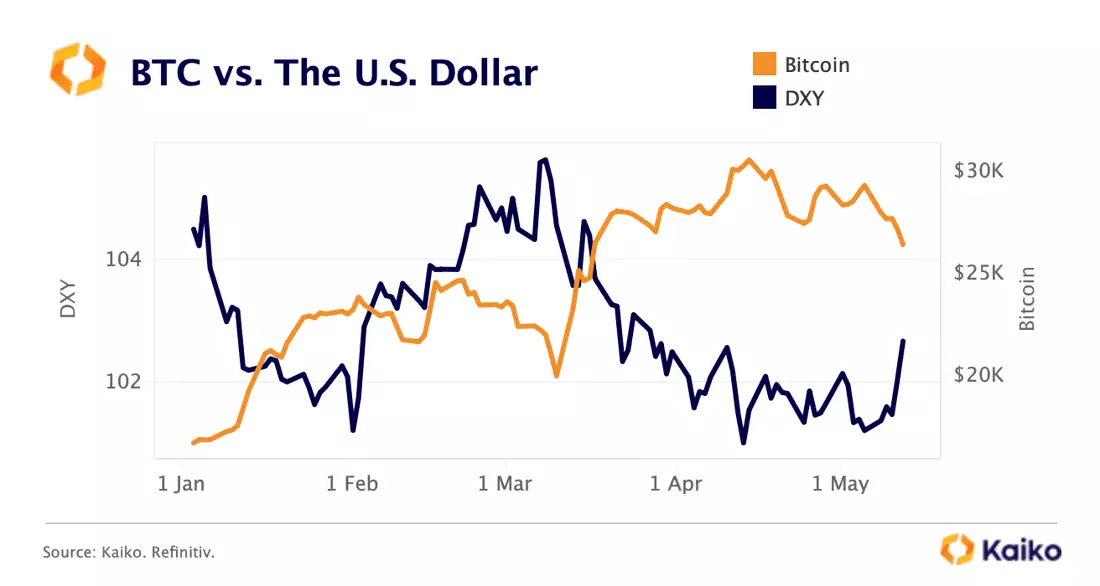
This has boosted the U.S. dollar which gained 1.4% last week despite remaining below March’s highs. BTC’s correlation with the DXY has been mostly negative throughout the past year averaging -30%.

Crypto mining stocks outperform.

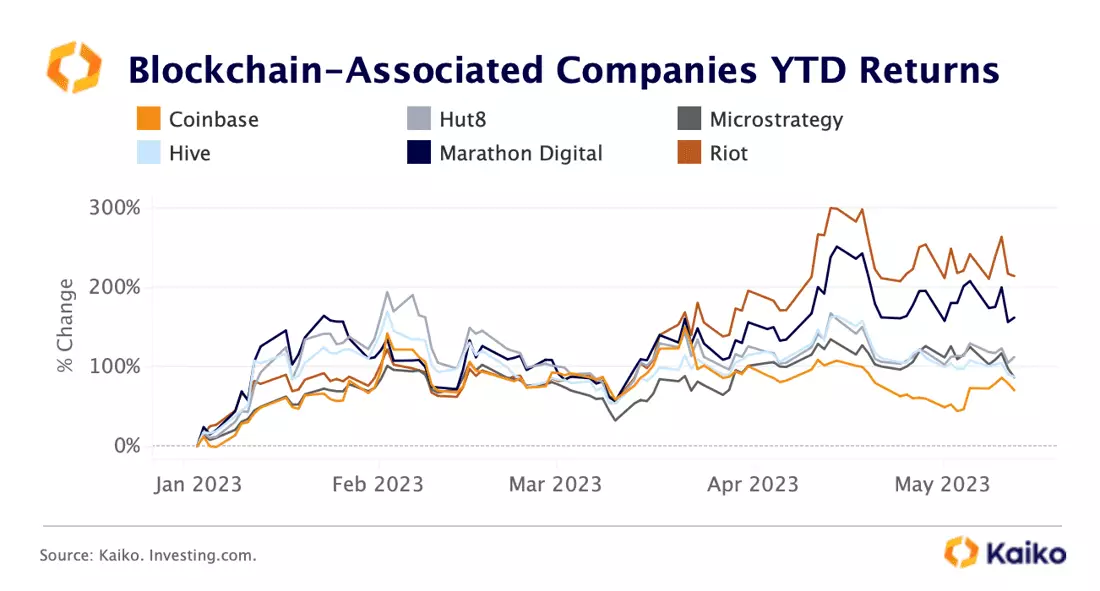
The crypto miner bloodbath has appeared to take a breather…for now. The advent of ordinals in February changed the outlook for embattled crypto mining companies. This protocol allows node operators to directly inscribe data and images in newly minted Bitcoin blocks, increasing demand for block space and boosting the fees earned by BTC miners, in addition to their block rewards.

This has created a new revenue stream for miners, leading to a surge in the valuations of crypto mining stocks. As a result, these stocks have outperformed BTC and other blockchain-related stocks, with returns ranging from 88% to 215%. Riot Platforms, one of the largest crypto mining companies, has seen its shares soar by 215%. Marathon Digital has also been a strong performer with returns of over 160%.

Data Used in this Analysis

  • Derivatives Metrics

    Metrics and analytics products tailored to the cryptocurrency derivatives market.

  • Liquidity Metrics

    The most granular order book data in the industry optimized for quantitative analyis.

  • Trade Volume

    Centralized exchange data sourced from the most liquid venues, covering all traded instruments.

More From Kaiko Research