Data Points
90% of liquidity is concentrated on 8 exchanges.
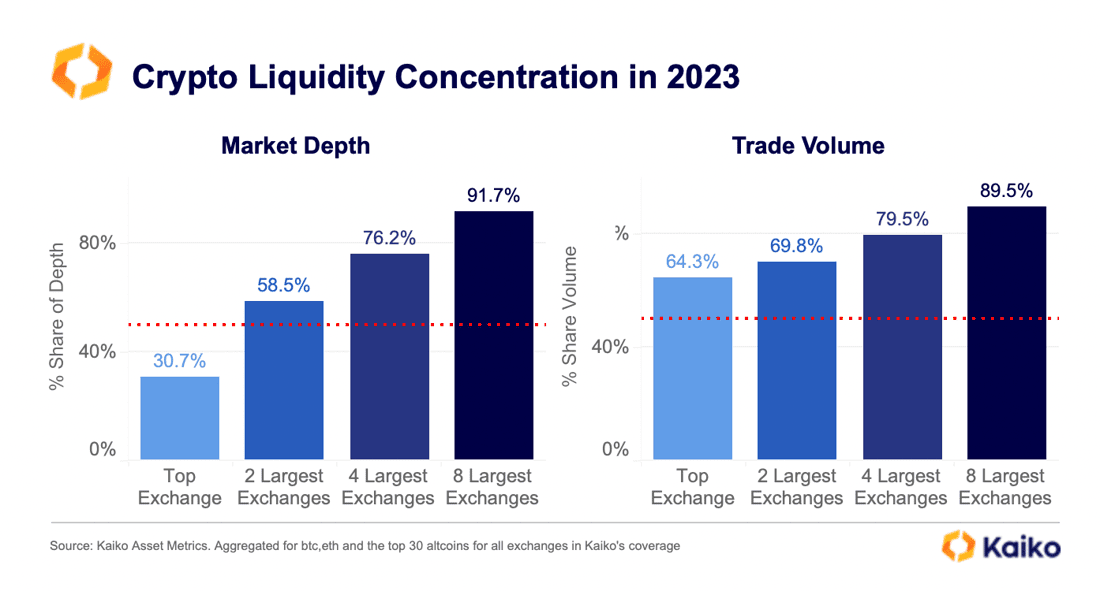
Last week we introduced a new liquidity analysis looking at the concentration of trade volume and market depth on centralized exchanges. We found that overall, liquidity is concentrated on just a handful of exchanges, and that this concentration has increased over time. This is not unexpected, especially considering the sharp drop in activity over the past year and the benefits that liquidity concentration brings to the average trader. We found that both market depth and trade volume is highly concentrated on the top exchange, Binance. Check out the full analysis below:
View Deep Dive
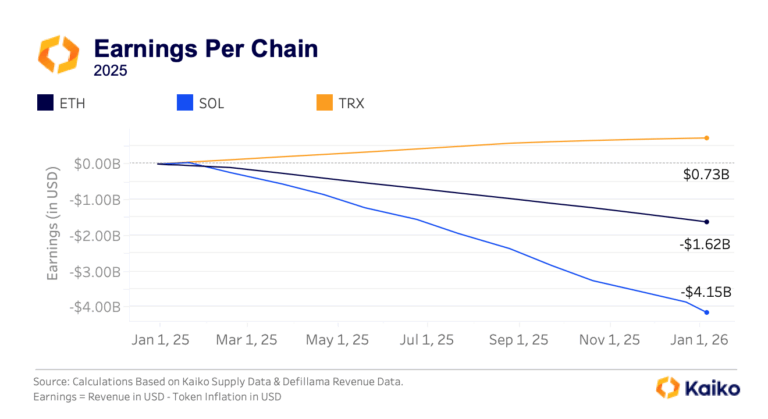
Solana comes back to life.
Last week, Visa announced that it would begin a pilot to send USDC to merchants using Solana, causing SOL’s price to rise past $21 before retracing down to $19.50. Despite the mild price reaction, this is yet another sign of life for a blockchain some had proclaimed dead following FTX and Alameda’s collapse. A Visa executive said the early stage of the pilot is “just giving the option to send or receive USDC instead of a bank wire.”
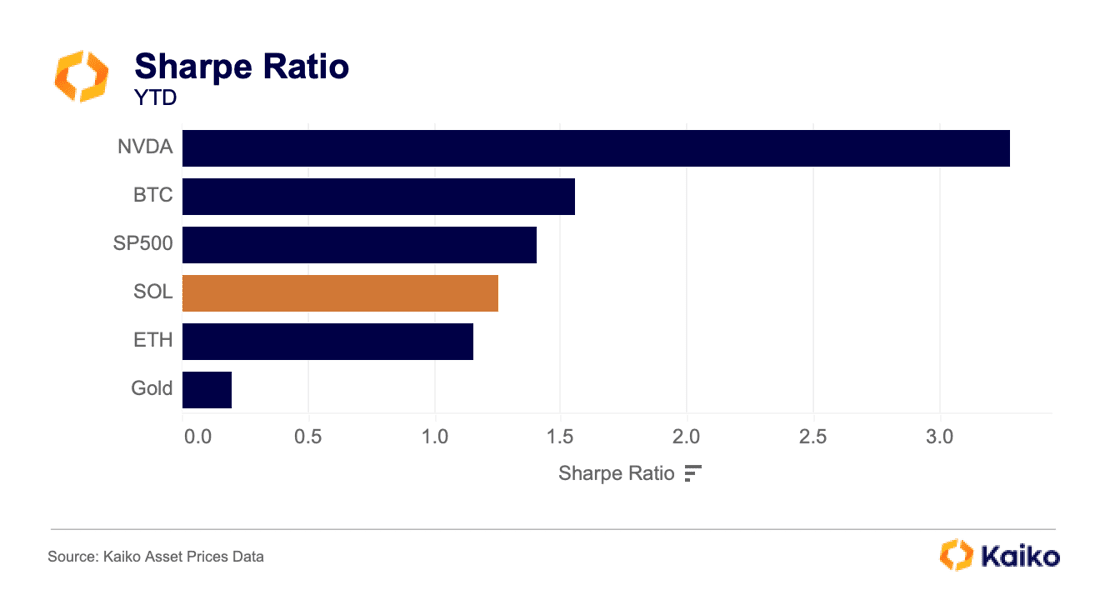
Overall, SOL’s Sharpe ratio, which measures risk-adjusted returns for the asset, has surpassed ETH and falls just behind the S&P 500.
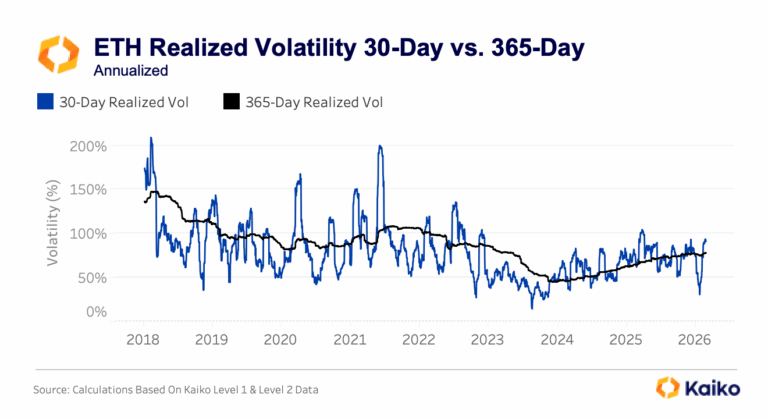
Long term volatility remains at multi-year lows.
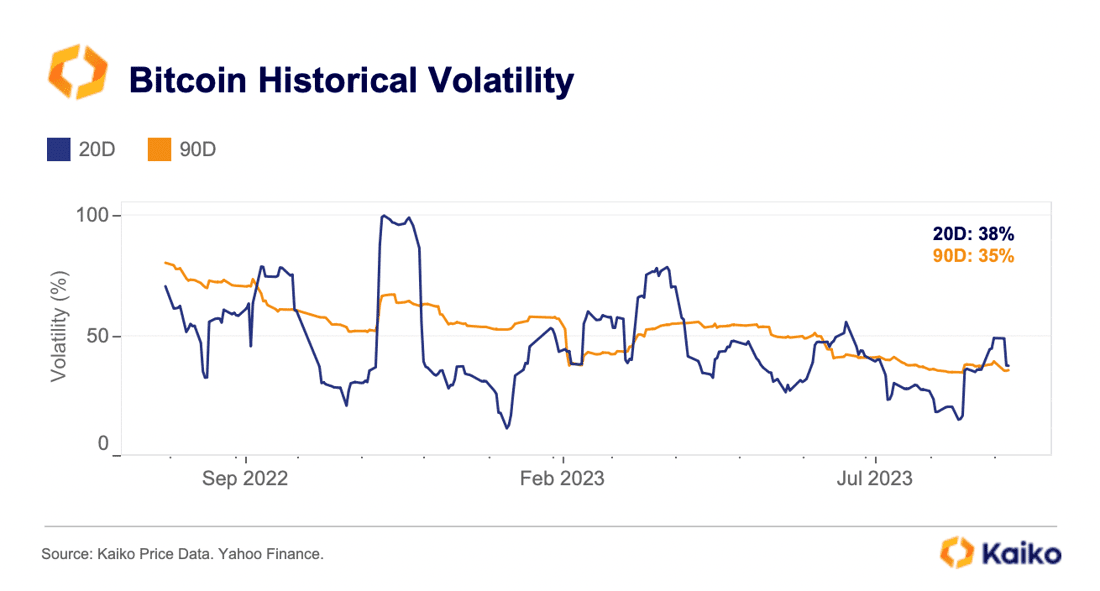
Following last month’s sharp selloff, BTC’s 20-day realized volatility briefly spiked to its highest level since June. Overall, though, 90-day volatility and trade volume remain at multi-year lows.
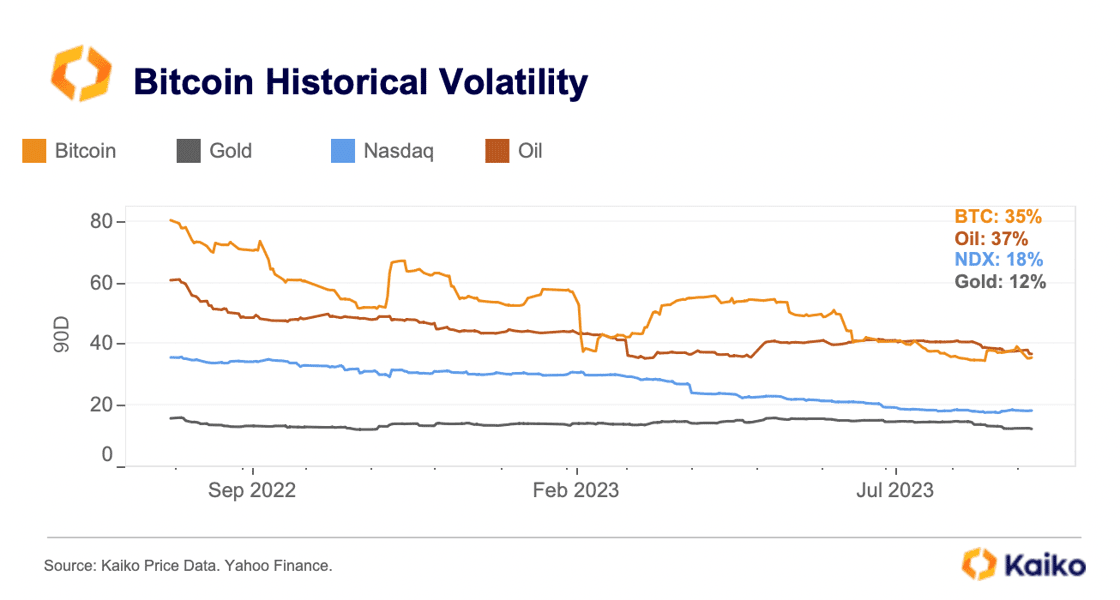
Relative to traditional financial assets, BTC and ETH are still significantly more volatile than tech equities, which could partly explain their underperformance in risk-adjusted terms. However, they are exhibiting comparable volatility to oil. While this week’s CPI print could boost volatility, especially amid surging oil prices, the long-term volatility is unlikely to significantly move in absence of trade volumes.
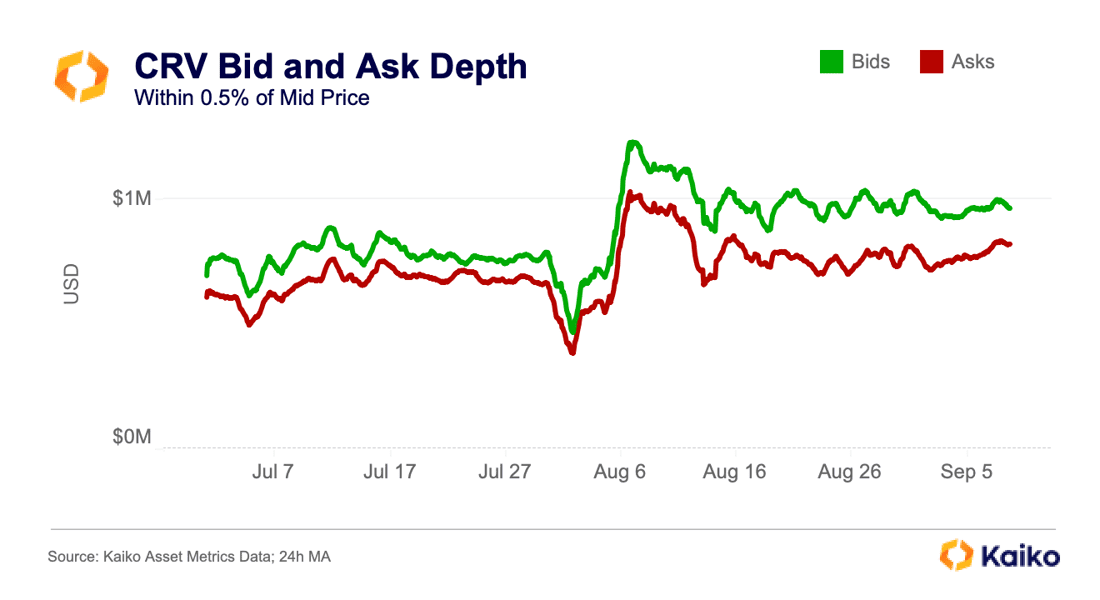
Market depth stays flat since FTX collapse.
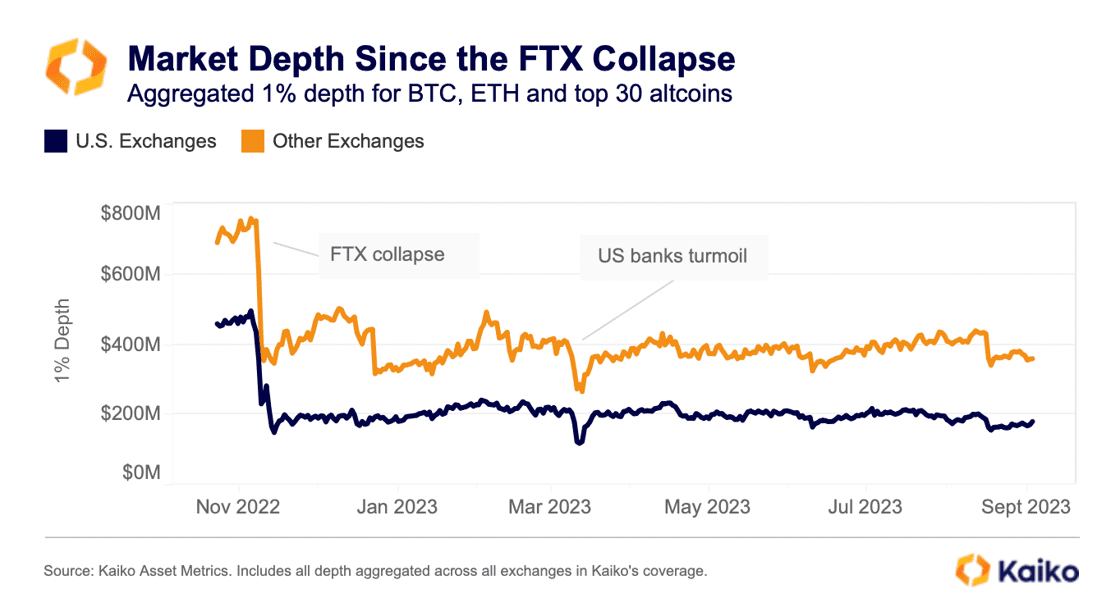
Ever since the FTX collapse, we’ve paid special attention to crypto market liquidity, focusing on market depth, which measures the amount of bids and asks placed on order books. On both U.S. and offshore exchanges, aggregated market depth for all markets trading BTC, ETH, and the top 30 altcoins has stayed mostly flat. Many of the largest market makers suffered big losses with the FTX collapse, with some winding down activities in key regions and markets. Low volume has not helped the liquidity situation either. The good news is that liquidity has stayed mostly stable without further losses.
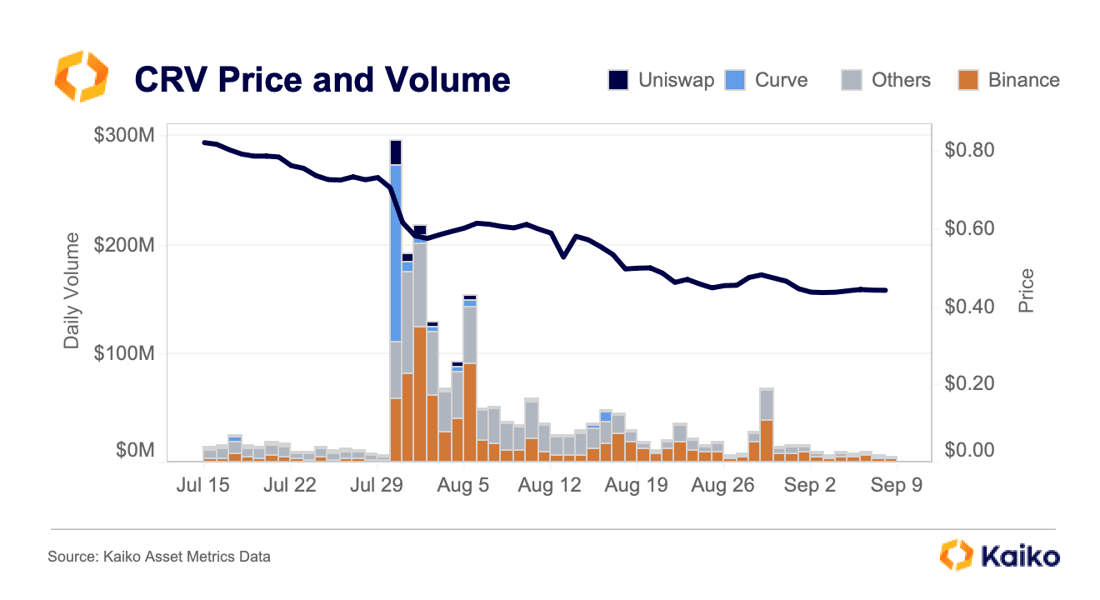
TUSD volume plummets after Binance removes zero fees.
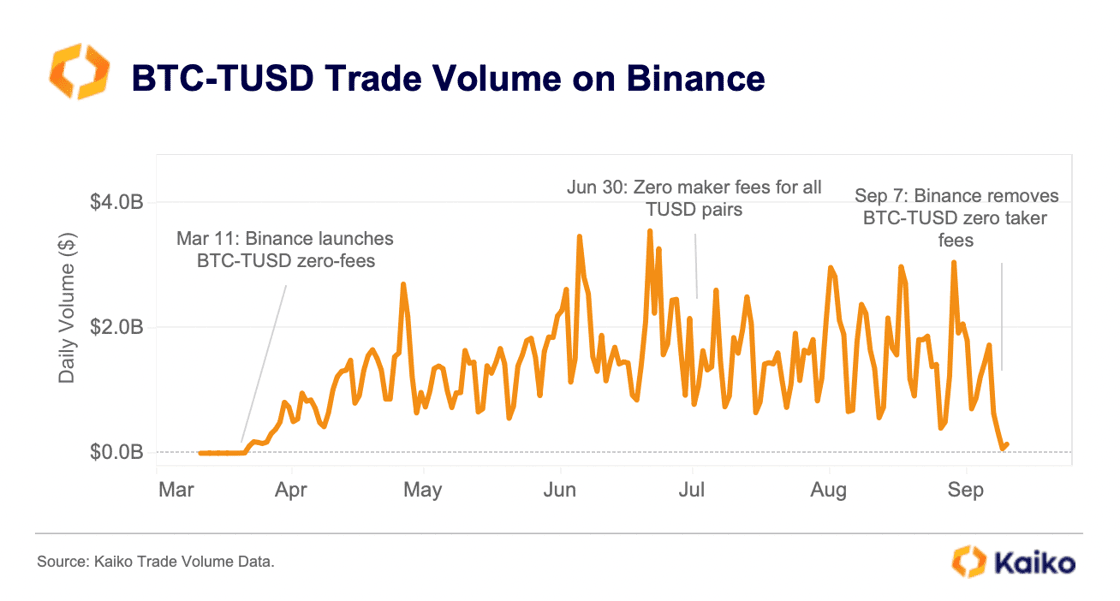
Last week Binance removed its zero-fee promotion for its most popular trading pair, BTC-TUSD. This leaves the exchange with only one remaining pair offering both zero maker and taker fees: BTC-FDUSD. First Digital USD (FDUSD) is a little-known stablecoin listed by Binance in July.
Immediately after the zero fees were removed on September 7, BTC-TUSD daily trade volume plummeted from $636mn to $72mn, its lowest level since TUSD was re-listed in early March. Binance began heavily promoting TUSD markets in March after Paxos was forced to halt issuance of BUSD.
Looking at the overall trade volume for top stablecoins using our Asset Liquidity Metricsdata, which takes the sum of volume for all trading pairs that incorporate a stablecoin as either the base or quote asset, we can see that Tether’s market share spiked to 80% right after the TUSD promotion stopped.
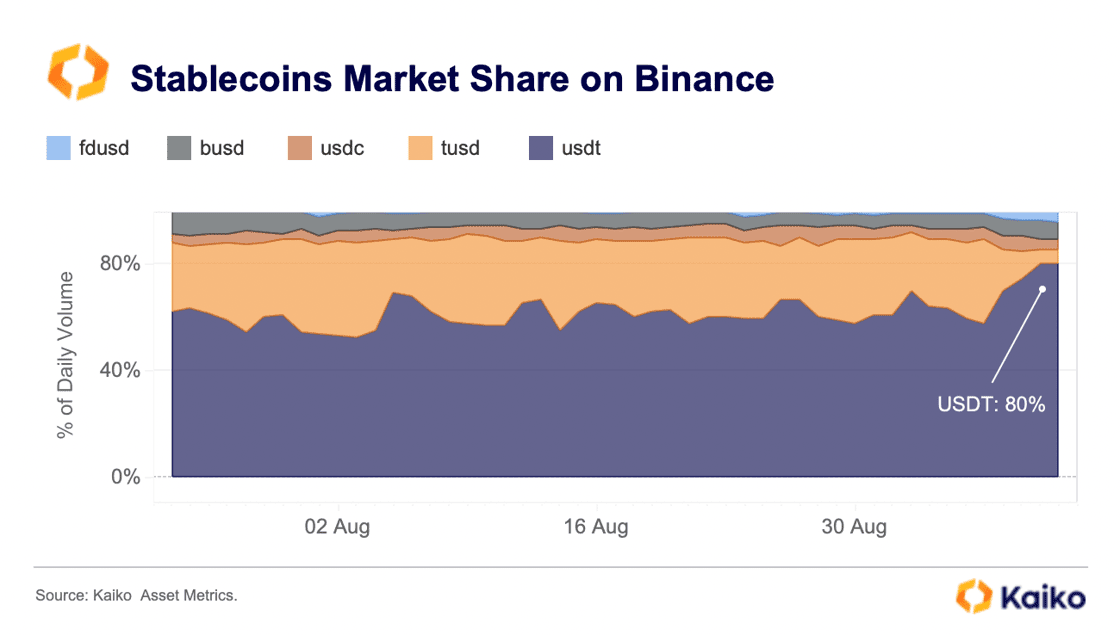
TUSD market share has since collapsed from more than 30% to just 5.6%, now even lower than BUSD’s for the first time since May.
Meanwhile, FDUSD’s market share has increased to an all-time high of around 4%. However, it remains one of the smallest stablecoins by trade volume and still faces fierce competition.
Fiat trade volume on Binance hits lowest level in more than two years.
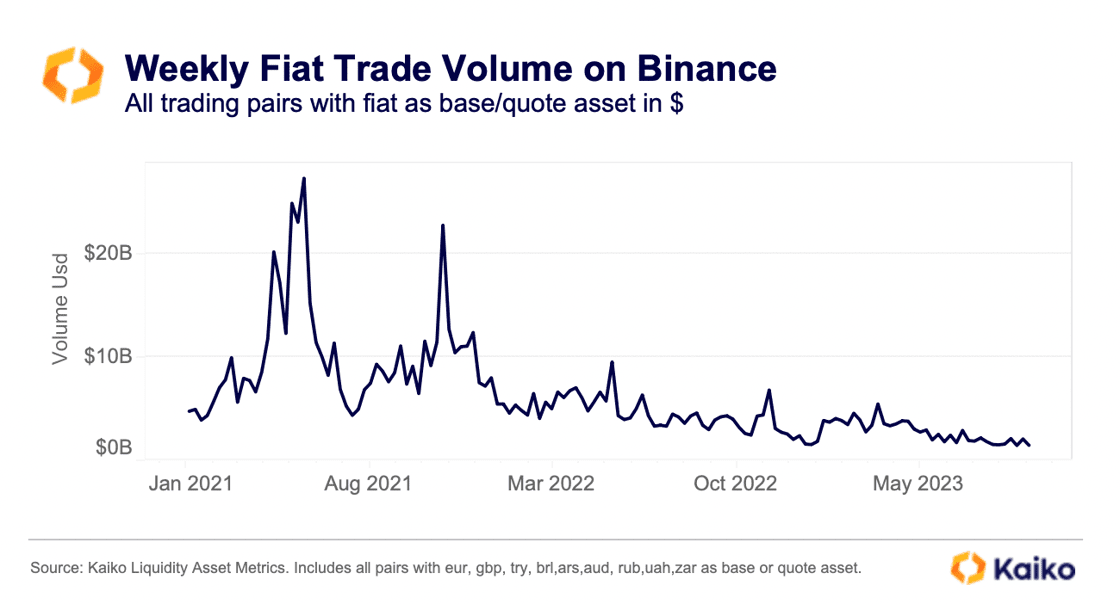
Fiat trade volume on Binance has declined by more than 60% since early January and is down 95% relative to its 2021 peak. Fiat volume includes all trading pairs that incorporate a fiat currency such as the Euro or GBP. Last week, Binance launched cut maker fees to zero for eight fiat-quoted spot trading pairs. Offering fiat on and off-ramp services has been increasingly challenging for Binance amid growing problems with its banking partners, so the exchange is likely attempting to shore up liquidity and volume.
In March, Binance’s GBP payment partner Paysafe halted support for GBP transfers, which led to a strong drop in GBP trade volumes on the exchange. Paysafe is also expected to halt support for euro SEPA bank transfers from and to Binance on September 25.
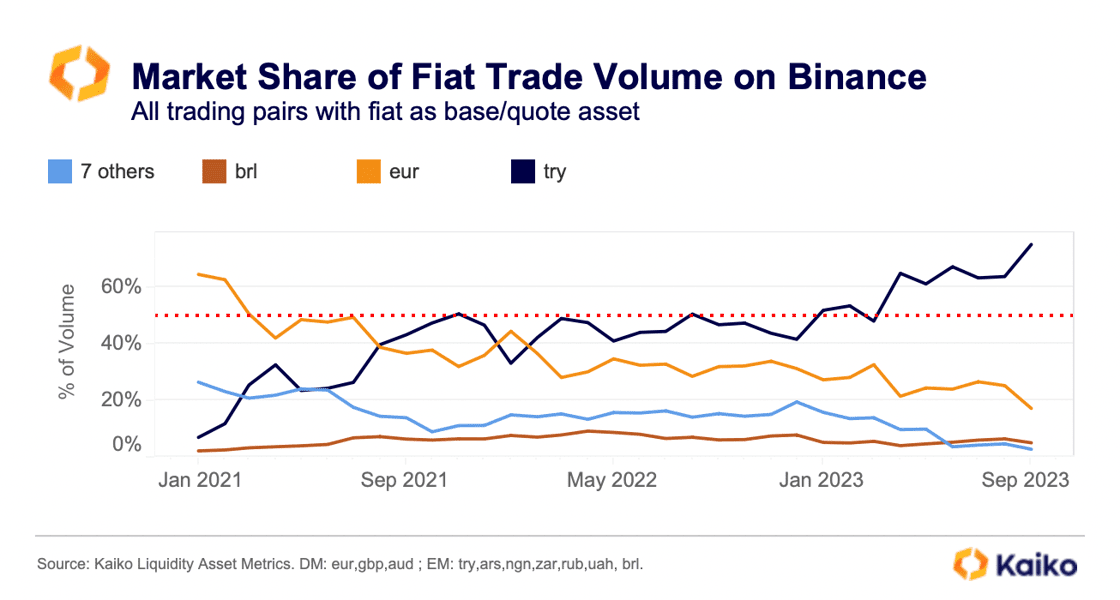
The Turkish Lira has emerged as the largest fiat trading pair on Binance, accounting for 75% share of all fiat volume last week. Crypto adoption in Turkey has been rising, with more than half of the country’s adult population investing in crypto.
Despite the euro remaining the second largest fiat currency by trade volume, its market share has declined to 17%, its lowest level since January 2020. Overall, fiat trade volumes represent a very small part of Binance’s total trade volumes, which are mainly denominated in stablecoins.
The share of inverse BTC perpetual futures increases.
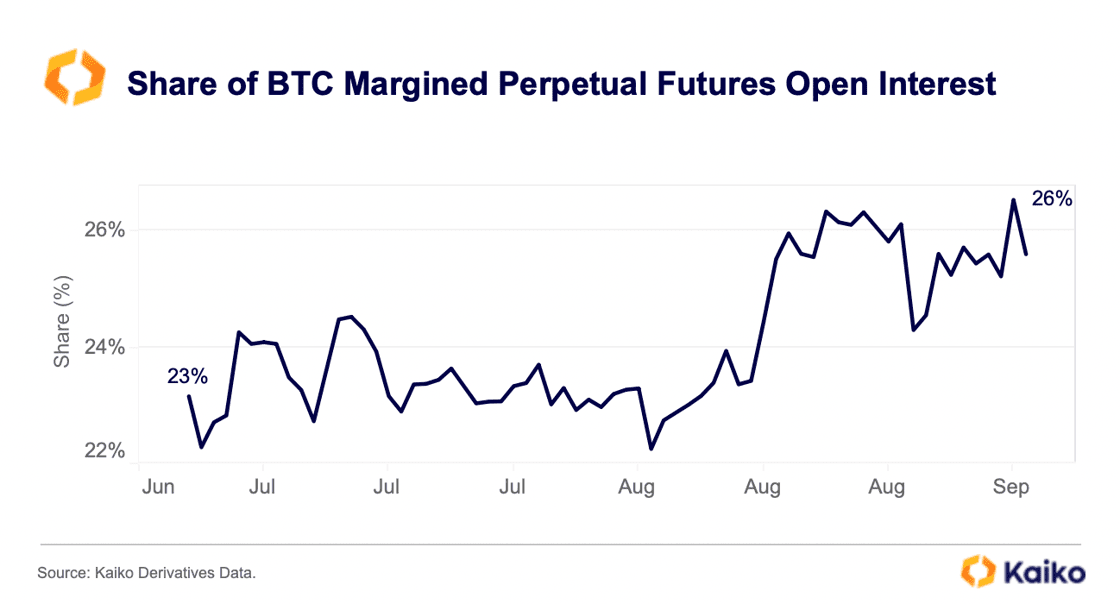
The share of inverse BTC perpetual futures contracts open interest has risen over the past month and a half from 23% to 26%. The increase was driven by Binance’s perpetual futures markets.
Inverse contracts are margined and settled in the base currency (in this case BTC) and the value of the margin varies with the asset’s price movements, making them more vulnerable to liquidations. Linear contracts are margined with USD or stablecoins, thus the value of collateral does not shift with price.
Even though major centralized exchanges such as Binance and OKX have significantly reduced their leverage limits over the past year, the rising share of inverse contracts could amplify the impact of price volatility on derivative markets.
Bitcoin moves in sync with risk assets in August.
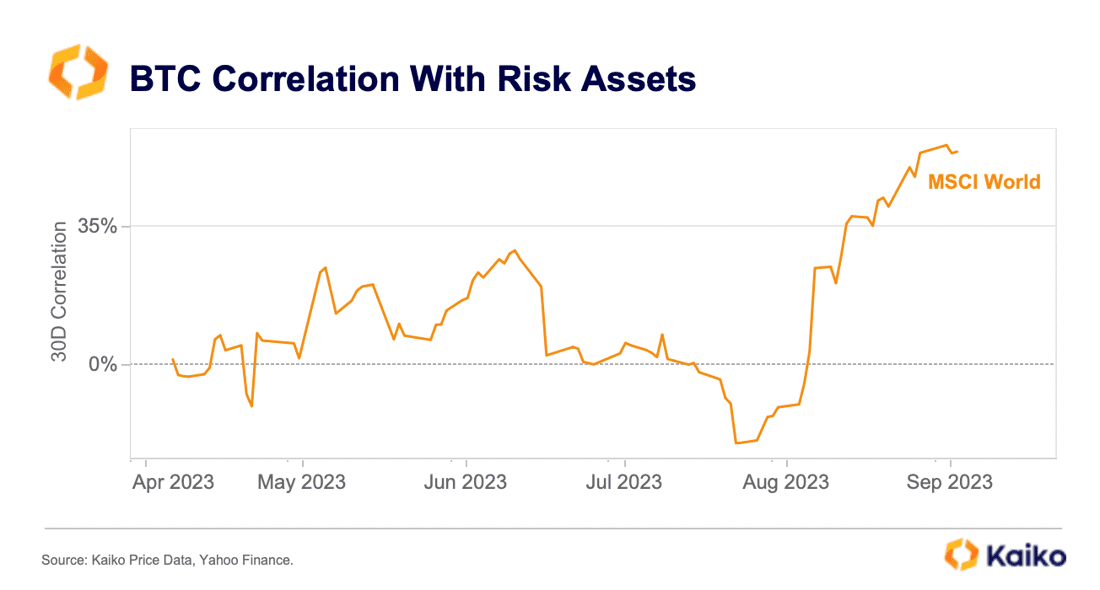
BTC’s correlation with risk assets (proxied by the MSCI World index) has risen from negative 20% to more than 40% over the past month and a half. Global risk sentiment has deteriorated after disappointing economic data from China and more recently a repricing in rate cuts expectations for next year. This has spilled into crypto, with both BTC and ETH closing last month in the red for a second month in a row.