Join us for our latest webinar in collaboration with Cboe

Leveraging LSDs: The Next Era of Lending and Borrowing
27/04/2023
Data Used In This Analysis

More From Kaiko Research
![]()
Macro
20/01/2026 Data Debrief
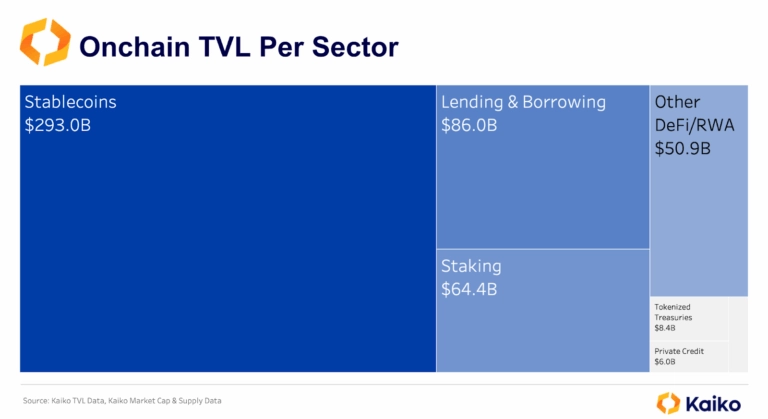
Infrastructure Is Holding Back TokenizationReal-world asset tokenization has evolved from a theoretical exercise into a measurable market, but the data reveals a split reality. Stablecoins have achieved massive scale, while tokenized securities, commodities, and infrastructure tokens remain concentrated, illiquid, and far from self-sustaining.
Written by Laurens Fraussen![]()
Macro
13/01/2026 Data Debrief
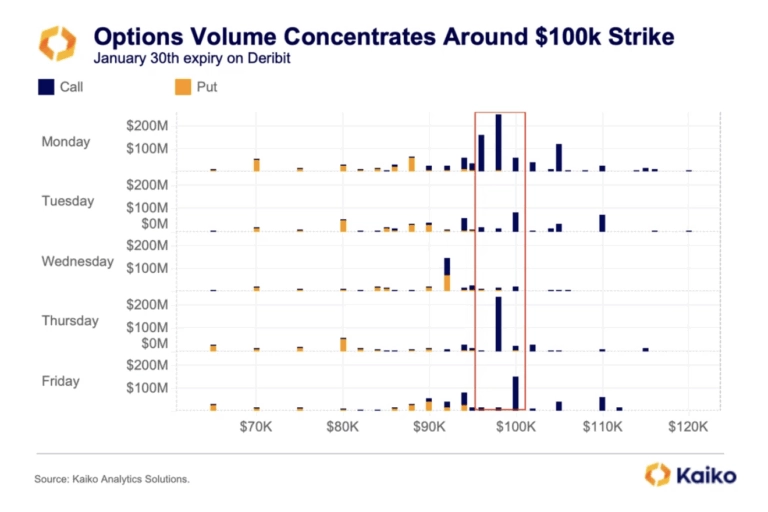
Positioning for $100K: Signals and Key CatalystsThis week’s Data Debrief examines the positioning dynamics beneath the surface of the early January rally. Extraordinary call volume concentration at and around the $100,000 strike, an inverted volatility term structure, and neutral funding rates suggesting balanced leverage.
Written by Adam Morgan McCarthy![]()
Indices
06/01/2026 Data Debrief
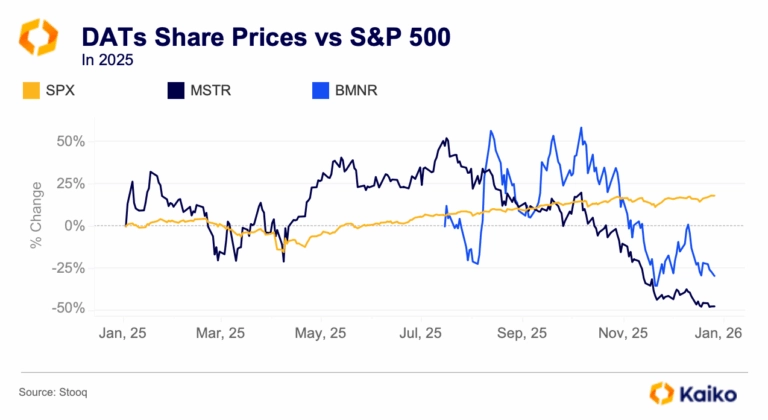
The Rise and Repricing of Digital Asset TreasuriesAs digital assets mature and market structure deepens, corporate and institutional crypto holdings are being reclassified from speculative bets to managed treasuries. Instead of sitting passively on balance sheets, these positions are increasingly treated as a distinct asset pool, with dedicated strategies for liquidity, risk, and yield.
Written by Laurens Fraussen![]()
Derivatives
29/12/2025 Data Debrief
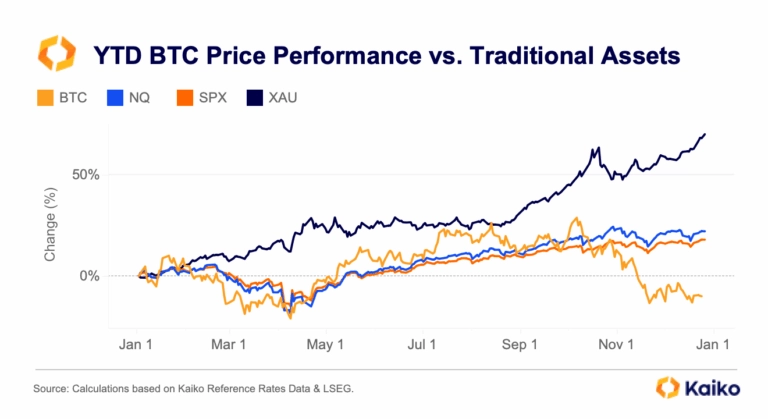
Santa Rallies, Cycles, and Year-End Reflections for BitcoinAs markets approach the end of the year, Bitcoin finds itself at a familiar crossroads, caught between cyclical behavior and a steadily developing market. While year-end seasonality has historically played a role in shaping price action, recent data suggests that cyclical drivers are increasingly dominant.
Written by Laurens Fraussen


