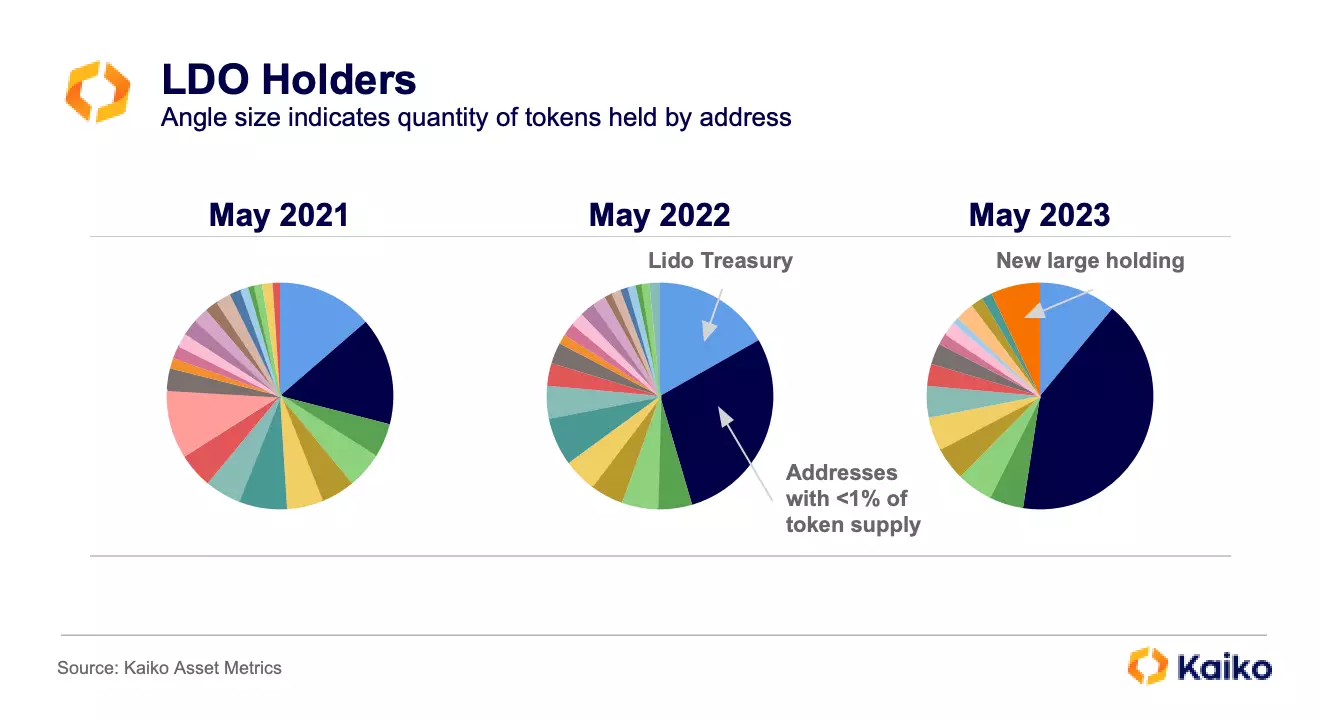
LDO’s Shifting Market Structure: Unveiling Asset Metrics

Liquidity

Binance

CEX

DeFi

Written by Riyad Carey

25/05/2023

Welcome to Deep Dive!

Asset Metrics is perhaps the most powerful product that Kaiko has ever released. With a single endpoint, users are able to fetch historical liquidity and volume data for any asset we cover, including all instruments and all exchanges – centralized or decentralized. Additionally, it includes historical holder data for a wide variety of ERC-20 tokens.

  • LDO has been one of the best performers over the past year

  • DEX market share of LDO volumes has fallen

  • Asset Metrics gives insight into largest token holders

  • U.S. exchange liquidity has lagged international exchange liquidity

How it works

In the past, we’ve conducted liquidity and volume analyses by using our Instrument Explorer to find relevant pairs for whichever token we’re curious about. We’d pull instrument-level data and aggregate it at the pair-level to give a global measure for, say, BTC-USD liquidity. However, differing base/quote combinations require normalization—for example, to aggregate liquidity for BTC-USD and BTC-KRW, we would need to apply a USD exchange rate. This prevented us from easily capturing global liquidity for an asset, limiting us to pair-level analyses.

Asset Metrics has massively simplified this process by aggregating all instruments that include the asset I’m analyzing across the 120+ exchanges we cover. If I’m interested in Litecoin market depth, I can quickly pull all liquidity data – which would include LTC-BTC on Binance, LTC-ETH on OKX, LTC-KRW on Upbit, and 249 other instruments – since the token was first listed, all converted into USD and broken down by exchange.

The same holds true for volumes. For example, if I’m interested in ETH volumes, I can quickly pull data for all instruments that include ETH, whether this is ETH-USD on Coinbase or LINK-ETH on Uniswap V3. Again, this is provided in both native units and USD for easy comparison.

Case study

This week I’ll use the token LDO to illustrate some of the ways this data can be used for analysis. LDO was launched in January 2021 and allows holders to participate in governance of Lido DAO, the protocol behind Lido Staked ETH (stETH), now the 8th largest token by market cap.
The growing popularity of ETH staking has made LDO one of the best performing tokens over the past year. It is a particularly interesting use case for Asset Metrics because its market structure has shifted multiple times across both centralized and decentralized exchanges.

Never Miss a Deep Dive.

Volumes

For nearly the first year of its existence, LDO was traded entirely on DEXs. This started to change in Fall 2021, when exchanges like Poloniex began to list the token. Yet, the token’s market structure only underwent a seismic shift once Binance listed it. The day before Binance’s listing, DEXs represented 98.7% of LDO volumes; just one day later this figure plummeted to 55%, eventually hitting just 25% a few days later.

It’s clear just how quickly Binance shifted LDO’s center of gravity from DEXs to CEXs. The highest monthly volume before Binance listed it came in November 2021, when Sushiswap registered $220mn and Uniswap $40mn. (The most popular pools on Sushiswap and Uniswap are LDO-ETH; Asset Metrics very conveniently converts this volume to USD for easy comparison with CEXs.)

Since then, the highest volume month was February 2023, when Binance alone registered $3.2bn in volume, compared to $600mn on OKX, $540mn on Uniswap, $230mn on both Kucoin and Coinbase, and just $10mn on Sushiswap.

Over the past year, DEX volumes have continued to lose share to CEX volumes, with a noticeable trend reversal in the wake of FTX’s collapse. The trend would quickly resume as LDO’s price surged from $1 to $2 in early January.

Zooming in on just DEXs, another trend shift becomes clear. Early in LDO’s existence, volumes were almost entirely on Sushiswap, with Uniswap V2 capturing a small portion. Uniswap V3 was launched in May 2021 but did not capture significant volumes until nearly a year later.

Today, Uniswap V3 dominates LDO DEX volumes, registering nearly $60mn next week compared to just $1mn on Sushiswap. Last month, Uniswap’s volume was nearly $125mn, beating out Coinbase at $100mn and trailing only Binance and OKX.

Overall, the vast majority of market activity for LDO happens on just one exchange, highlighting the impact that a Binance listing can have on a token’s market structure.

Liquidity

One of the most exciting features of Asset Metrics for our research team is the ability to quickly pull liquidity data that is global, aggregated, and extremely detailed. In this section I’ll go through the data, starting at the most aggregated and getting progressively more granular.

Below is a look at LDO liquidity across all the CEX instruments that we cover, converted into USD and charted at both the 0.1% and 1% market depth levels. As a reminder, our market depth takes the total quantity of bids and asks within x% from the mid price.

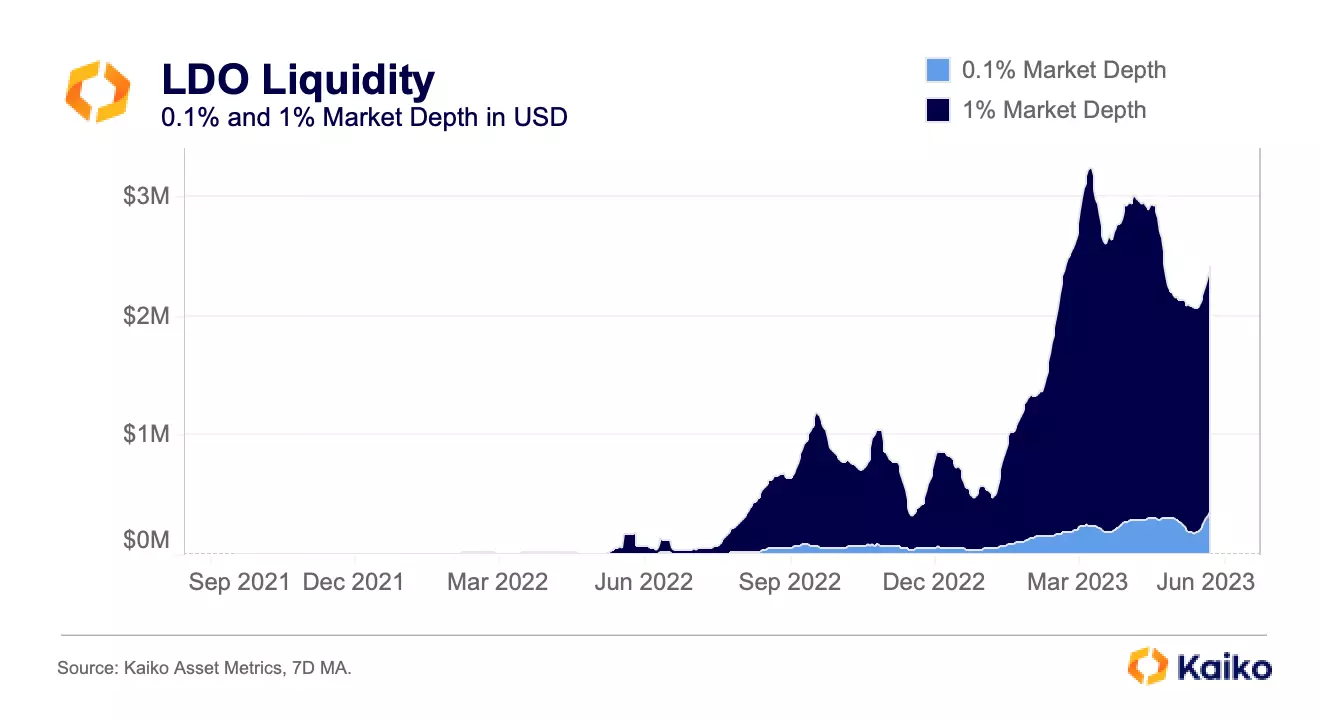
1% market depth has surged from post-FTX lows of under $300k to nearly $2.5mn today. 0.1% market depth has increased nearly 1,000% from post-FTX levels to hit nearly $400k today. These are signs of a healthy market, especially in the environment in which many altcoins are suffering from illiquidity as market makers have either collapsed (Alameda) or begun to slow operations.

Different market depth levels may be interesting for different purposes. For higher frequency traders, 0.1% market depth is more relevant whereas longer term holders like VCs or hedge funds may be interested to see how large orders will impact order books. Luckily, Asset Metrics includes liquidity data from the 0.1% level to the 10% level.

Additionally, it can be informative to see bid and ask depth separately to better understand market dynamics. Below is a chart of bid and ask depth at the 0.5% level as well as price to see how the three interact.

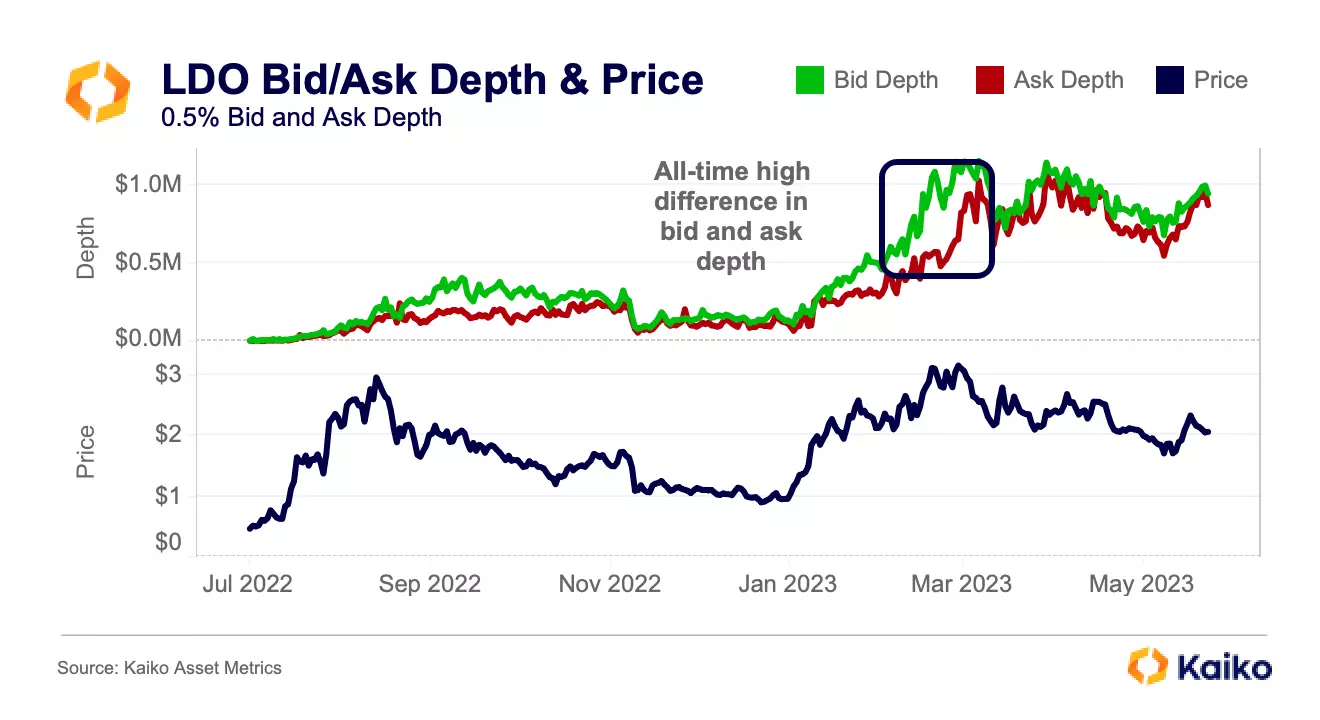
Bid depth has consistently been higher than ask depth in the past year. The difference between the two reached its apex in February 2023, just days before LDO hit its highest level since August 2022. It’s also possible to increase the granularity of this metric, either by taking hourly data or breaking it down by exchange.

For institutions that are constrained to a specific jurisdiction for regulatory reasons, it can be informative to see how liquidity is distributed across different exchanges. Below is charted 1% market depth split between U.S. and international exchanges, presented in both USD and native units for a more comprehensive view.

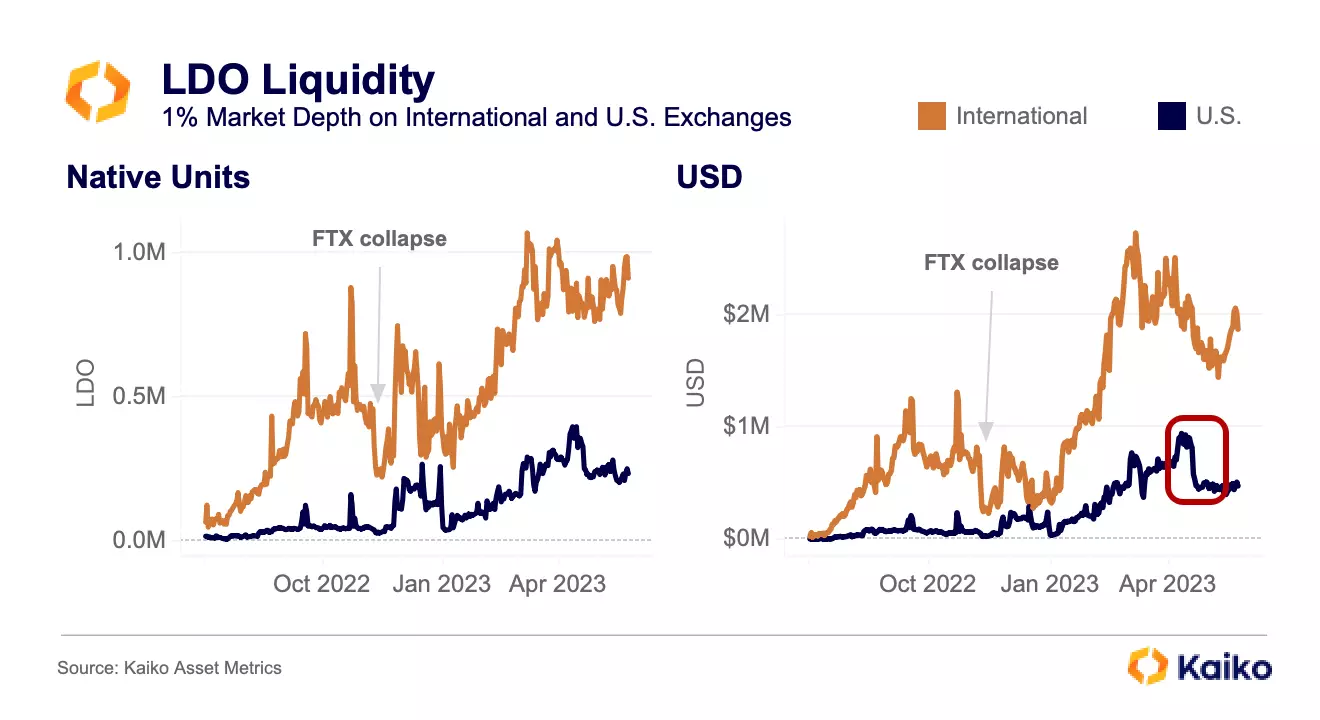
Immediately it’s clear that international exchanges hold about four times more liquidity than U.S. based exchanges. Like all tokens, LDO’s liquidity took a hit after FTX’s collapse, but unlike other tokens it rebounded extremely quickly. In USD terms, it took LDO just two weeks to return to pre-FTX liquidity levels on international exchanges. By November 25, U.S. exchange liquidity had tripled from pre-FTX levels.

From January 2023 until late March, liquidity surged for both regions in both USD and native units. However, in April liquidity took a hit as LDO’s price slumped. This was particularly evident on U.S. exchanges, where 1% market depth dropped from $1mn to $500k in just a few days.

To investigate this further, we can split out the data by each exchange. Below is charted all liquidity on the exchanges.

There are a number of interesting takeaways from this chart. First, the drop in Coinbase liquidity was largely responsible for the drop in overall U.S. liquidity, as it is the most liquid U.S. exchange. Notably, this drop in liquidity came just a few days before Jane Street and Jump announced that they would be slowing U.S. crypto operations.

Going back a bit in time, FTX was once the second most liquid market for LDO. After FTX folded, Gemini briefly became the second most liquid market, adding almost the exact same amount of liquidity that FTX lost. We can investigate this further.

Because they are included in the same endpoint, it’s easier than ever to include volume and liquidity in the same analysis. Here, for example, is a market depth to volume ratio, where larger values represent more market depth relative to volume. Additionally, I’ve used two different market depth levels to provide a more complete picture.

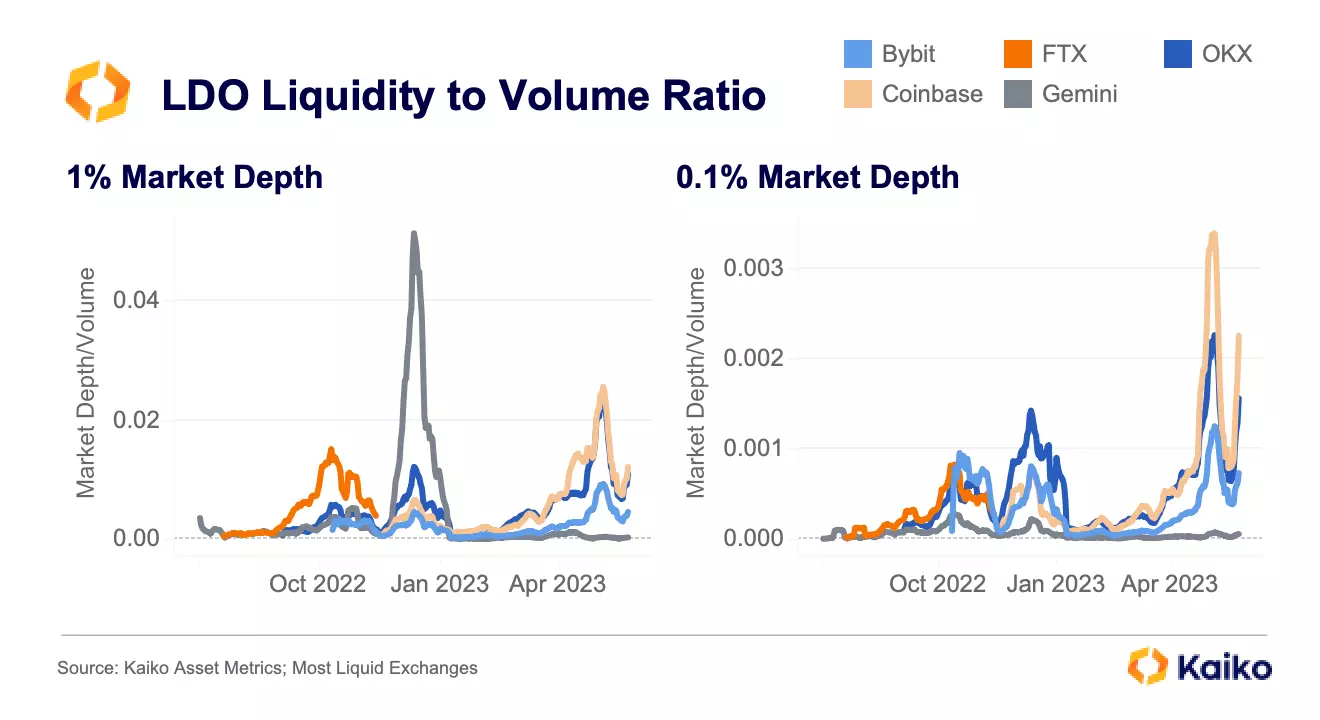
On the left, there is a huge spike in Gemini’s ratio, meaning that a large amount of liquidity was added within 1% of the mid price relative to volumes. On the right, Gemini’s ratio barely budges and is in fact the lowest of the charted exchanges. This means that Gemini had the most volume relative to its 0.1% market depth. Taken together, this suggests that Gemini had a lot of liquidity added, though not in response to increasing volumes. Additionally, most of it was added farther away from the mid price.

In practical terms, if I was a higher frequency LDO trader in December 2022, I would probably opt for OKX (amongst the charted exchanges). However, if I had a large position to liquidate, it would be worth considering using Gemini.

Holders

Finally, Asset Metrics includes detailed data about token holders of many ERC-20 tokens like LDO. This is an altogether new data type for Kaiko that provides many new insights into token distribution.

The most basic of these insights is the pure number of holders, which is charted below.

The growth of holders in recent months is remarkable: it took 10 months to hit 10k holders, 11 more months to hit 20k, and then just 5 more months to hit 30k. There are some sharp spikes associated with price increases as well as some divots during market turmoil. The quick increases and decreases are likely due to bots arbitraging the token on DEXs as its price was cut in half in just a few days.

Additionally, with this data, it’s possible to see how token distributions have changed over time, as well as if large holders are increasing or decreasing their holdings. This information is critical, especially for institutions that may be considering taking a large position in a token. This information takes on an extra significance with LDO because, as a governance token, large holders are able to influence the protocol’s direction.

From May 2021 to today, we can see that the LDO held by the Lido Treasury has shrunk as it has paid out incentives to liquidity providers, amongst other expenses. Additionally, small holders have grown significantly, from holding just 150mn total tokens in May 2021 to 415mn tokens today. Many of the slices that have remained unchanged since 2021 are vesting addresses for early investors.

Conclusion

We’ve walked through ten different charts and still have only just begun to uncover the full range of insights that Asset Metrics makes possible. As a research team, we’re extremely excited to leverage it to continue to improve our analysis in new ways. But Asset Metrics isn’t just a game changer for Kaiko’s research team, it’s an invaluable resource with the potential to vastly improve anyone’s clarity into crypto markets.

You can learn more about Asset Metrics on our product page and API documentation.

Data Used In This Analysis

More From Kaiko Research

  • Ethereum

    29/05/2023 Data Debrief

    72% of ETH liquidity is concentrated on 5 exchanges

    Bitcoin gained some ground early on Monday as U.S. lawmakers reached a debt ceiling deal in principle. Hong Kong confirmed it will allow retail traders to trade certain crypto assets starting June while the Digital Currency Group (DCG) closed its trade execution and prime brokerage units, citing bear market and regulatory uncertainty.

  • Liquidity

    25/05/2023 Deep Dive

    LDO's Shifting Market Structure: Unveiling Asset Metrics

    This week we are excited to reveal Kaiko’s brand new Asset Metrics product, which aggregates liquidity and volumes for all assets across all exchanges. Using LDO as a case study, we’ll show how this product is a game changer for understanding a crypto asset’s market structure.

    Written by Riyad Carey
  • Tether

    22/05/2023 Data Debrief

    Why is Tether's market cap approaching all time highs?

    Bitcoin lost some ground this week, down about 2%, as crypto trade volumes slipped to yearly lows. In other industry news, Digital Currency Group missed a $630 million payment owed to crypto exchange Gemini last week, the SEC responded to Coinbase’s lawsuit and Tether announced it would start buying BTC with 15% of its excess profits. In this week’s Debrief we explore:

  • Stablecoin

    18/05/2023 Deep Dive

    Stablecoins: Does Trust Really Matter?

    After the events of 2023, Tether has become the dominant stablecoin, despite being the least trusted. In this week’s Deep Dive, we explore whether this is evidence that trust is a lower priority for crypto investors, who seem to prefer peg stability, liquidity and versatility more.