Data Points
What’s happening at Huobi (HTX)?
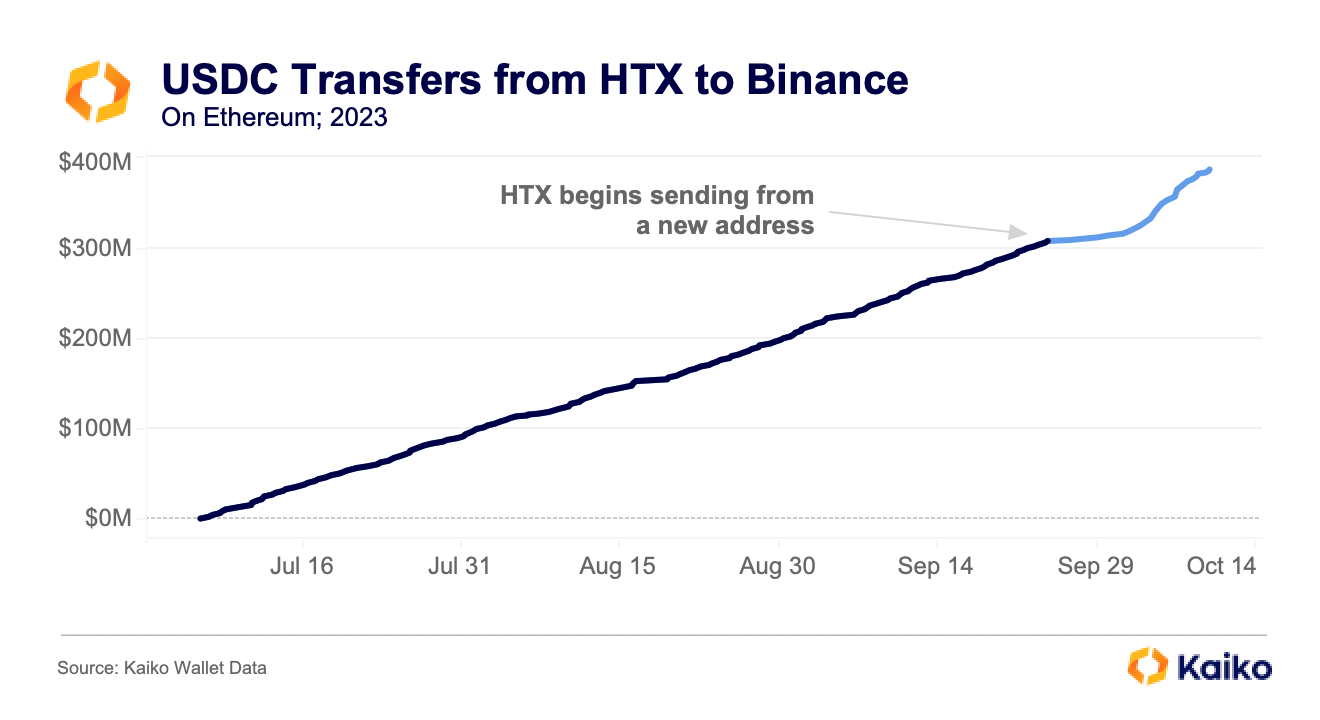
In our latest Deep Dive, we explores some ongoing activity at Huobi — now called HTX — that caught our attention. This summer, we noticed what appeared to be wash trading on the exchange’s WorldCoin pair shortly after the token launched. Shortly after, we observed trade volume across the exchange skyrocket, especially for smaller altcoins, which we’ve chronicled a few times in this newsletter.
Finally, we spotted some USDT depegs on the exchange and upon further investigation found significant and persistent selling of USDT for USDC, totaling nearly $400mn since July. Most recently, we’ve discovered that HTX has sent a total of $400mn USDC to Binance using two different wallets since the start of July, prompting questions about the source of these funds.
Binance EUR volume hits 3-year low amid on-ramp disruption.
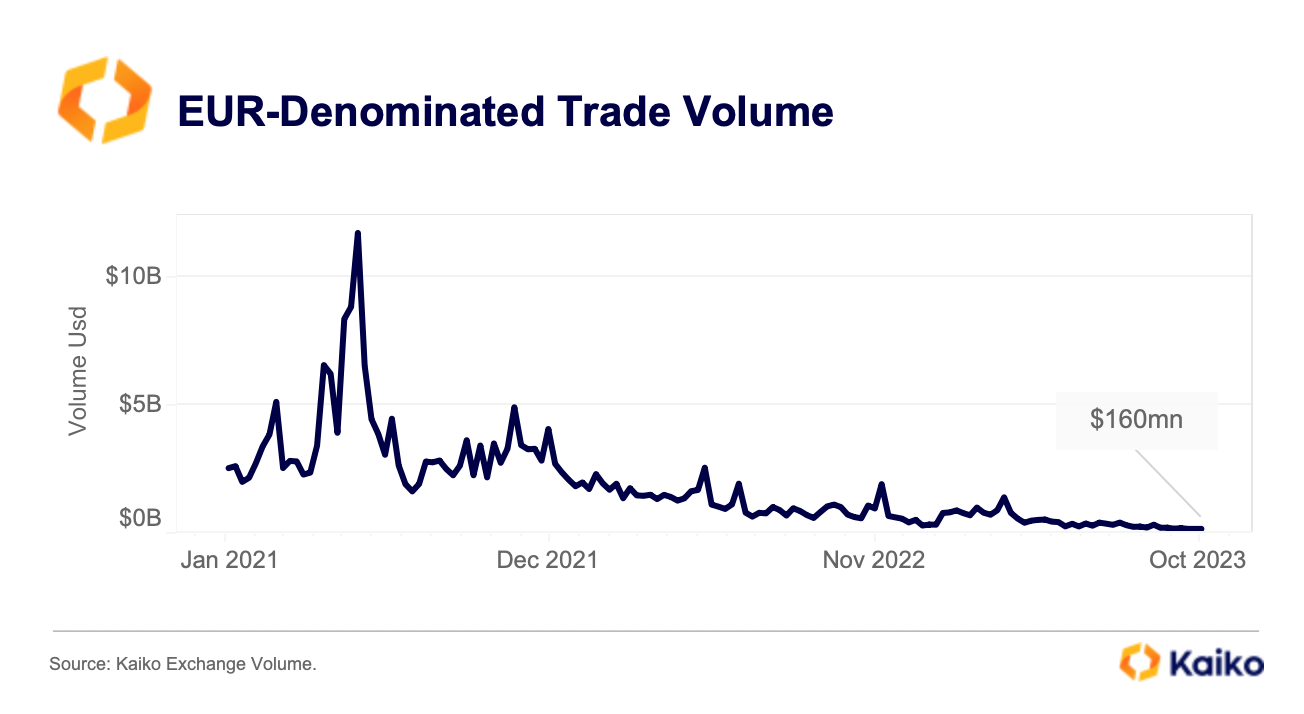
EUR-denominated weekly trade volume on Binance fell to just $160mn in October down from $1.3bn in March, hitting its lowest level in more than three years. At the end of September, Binance’s Euro banking partner Paysafe halted on-ramp services to and from the exchange. The move, which was announced in June, had little to no impact on EUR trading, which had already been on a steady downward trend since March. Interestingly, some X (Twitter) users reported experiencing troubles accessing and trading their EUR-denominated balances over the past few months.
Overall, despite falling considerably, the Euro still remains the second largest fiat currency on Binance by market share.
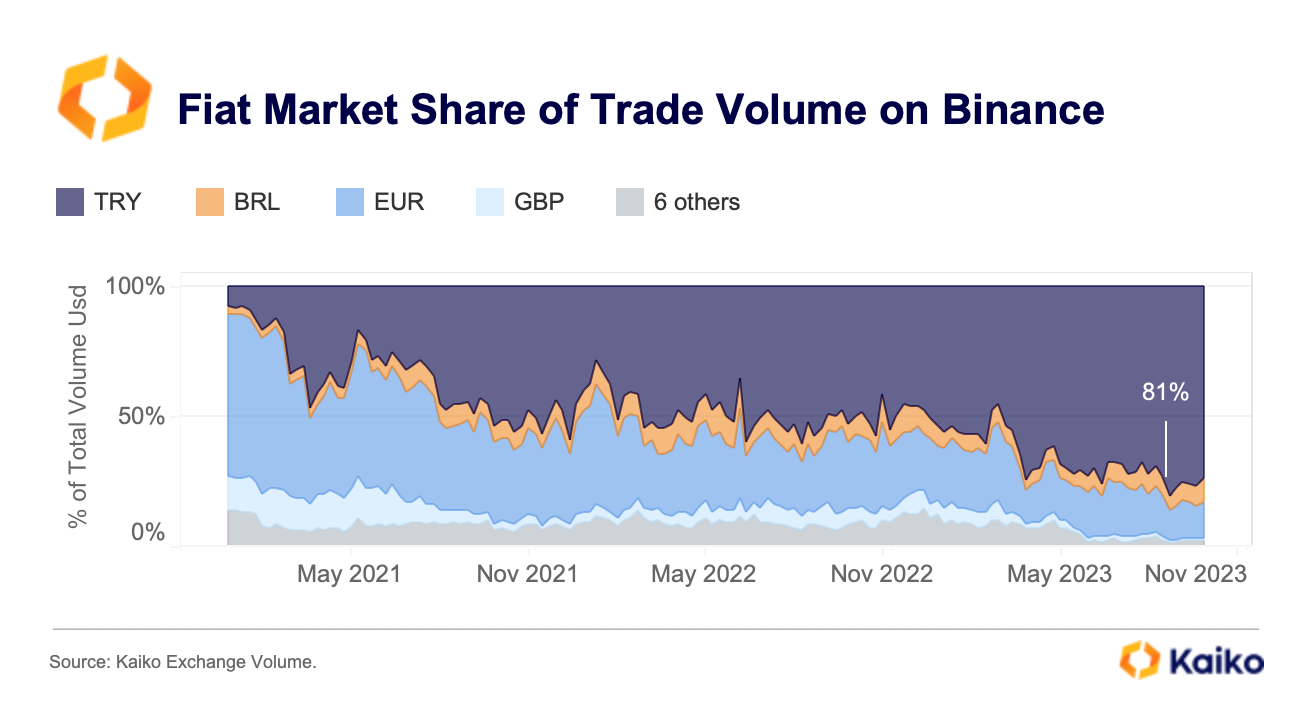
The Turkish Lira has emerged as the most popular fiat trading pair on Binance. Its market share has risen from 9% in early 2021 to an all-time high of 81% in August before retreating slightly in October. The share of other emerging markets currencies such as the Brazilian Real (BRL) have also been on the rise.
The state of the Solana ecosystem, 11-months after FTX.
Solana’s ecosystem was hit particularly hard by the collapse of FTX and its sister company Alameda Research. Alameda was well known for its early involvement in Solana and held significant amount of Solana’s native SOL token and other small-cap ecosystem tokens, such as mapping application Maps.me’s token MAPS, decentralized prime brokerage Oxygen Protocol’s OXY, decentralized exchange Bonfida’s FIDA, and Serum’s SRM. All these tokens lost between 50% and 99% of value following the collapse of FTX, and none has recovered its pre-FTX levels.
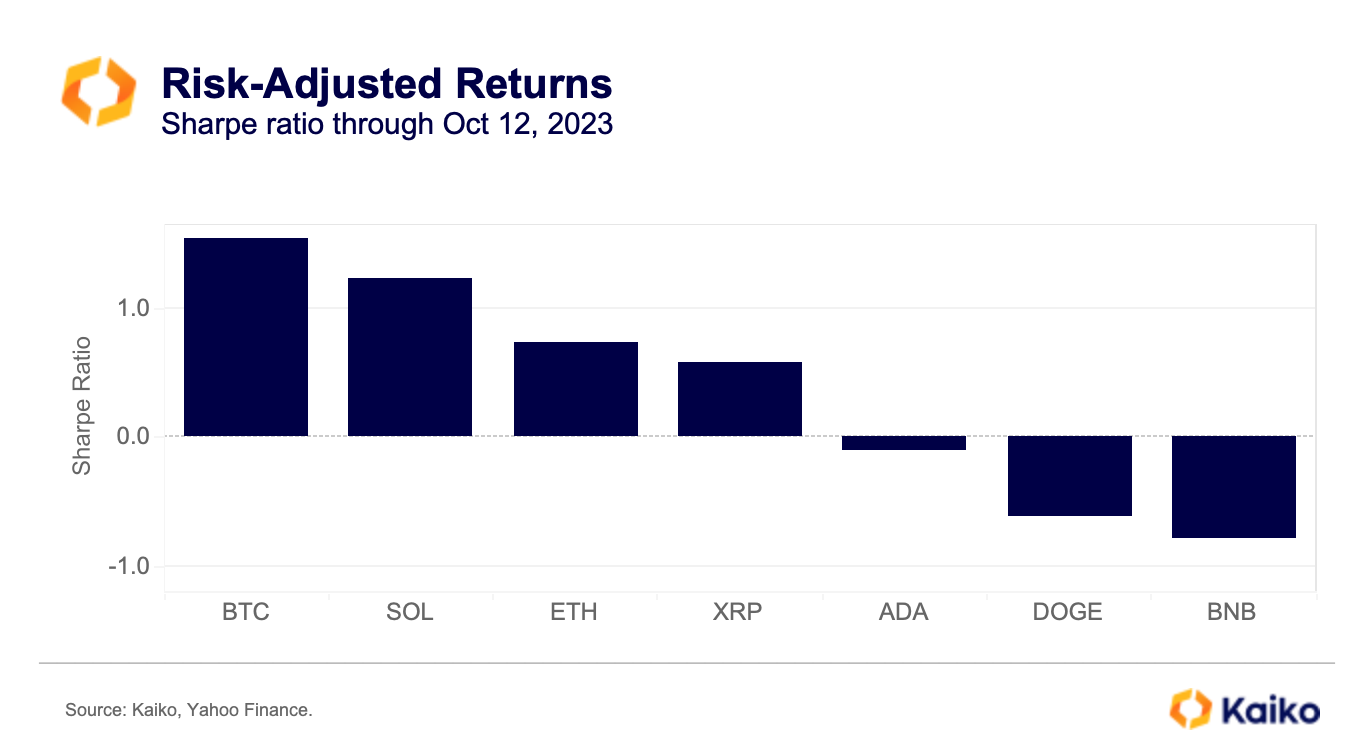
However, SOL has exhibited an impressive recovery this year, outperforming ETH in risk-adjusted terms.
In addition to price, liquidity for these smaller ecosystem tokens has also taken a significant hit and remains between 50% and 80% below pre-FTX levels. OXY and MAPS, which held more than 90% of their token supply on FTX, were hit the hardest, with MAPS liquidity all but disappearing from centralized exchanges.
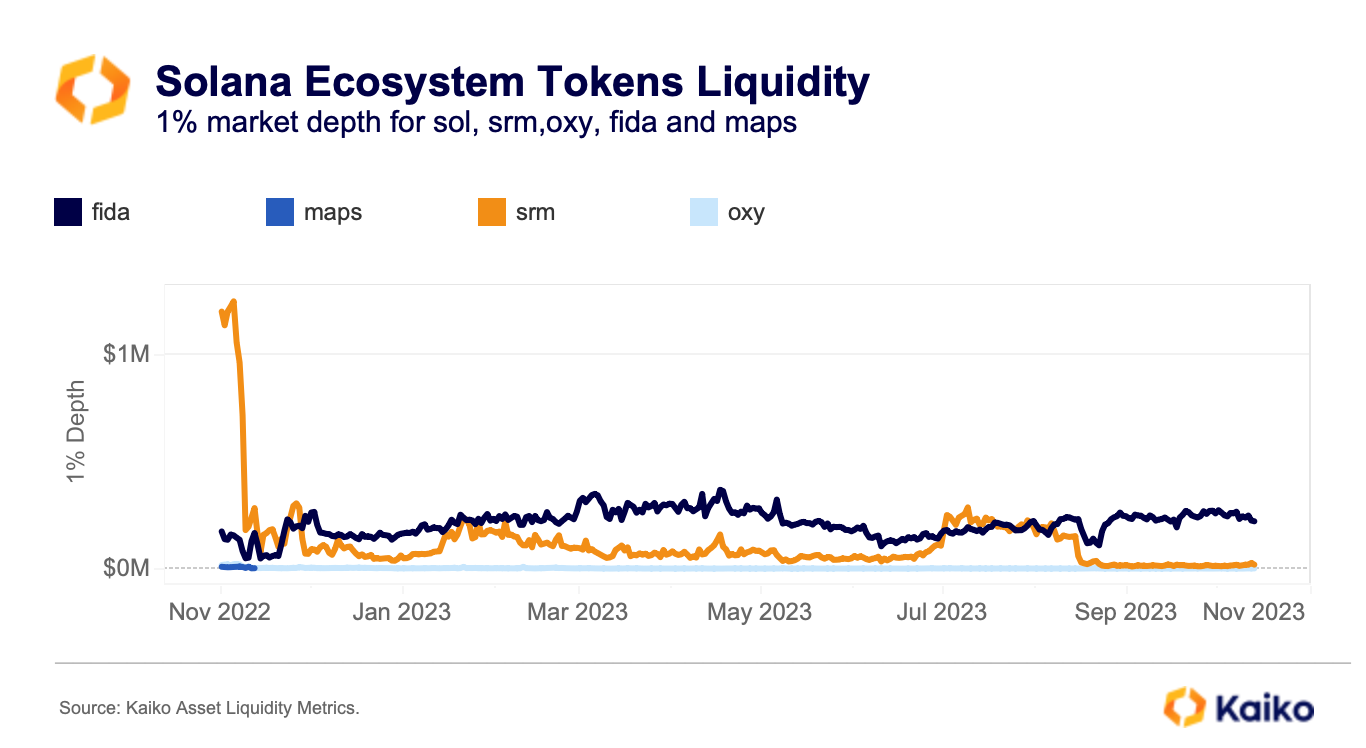
The token currently trades on only a handful of DEXs with scarce liquidity. Overall, liquidity for these tokens remains highly concentrated on Binance, with Kraken emerging as the second largest market over the past months.
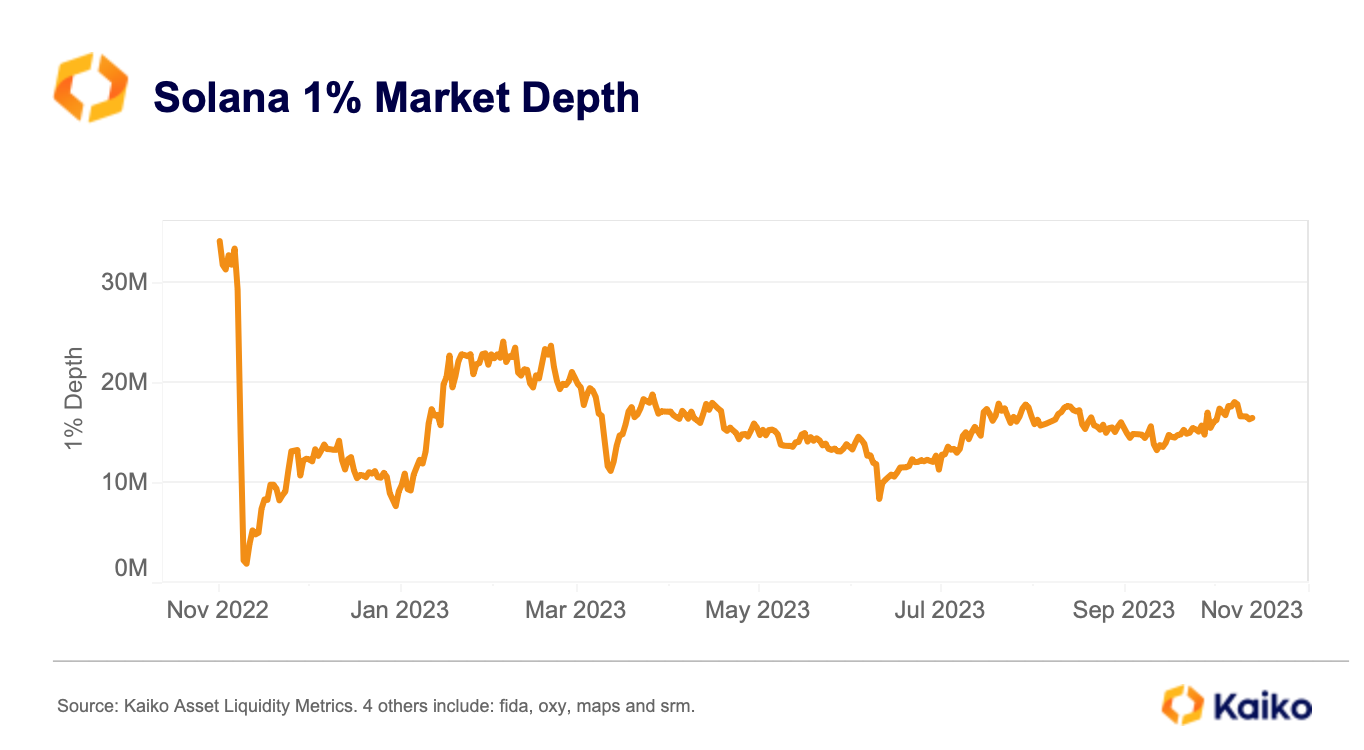
Despite its impressive price increase this year, SOL’s 1% market depth hovers around $16mn, down from $34mn a year ago. It is notable that in Q3 SOL’s market depth in native units (eliminating the price impact) and USD terms increased, suggesting greater interest and market maker participation following a partnership with VISA and other potentially bullish news events.
Overall, the swift recovery of SOL is a reminder that fundamentals matter, especially in a post-FTX environment where investors are much more selective and risk-averse.
Diving into TraderJoe, the biggest DEX on Avalanche.
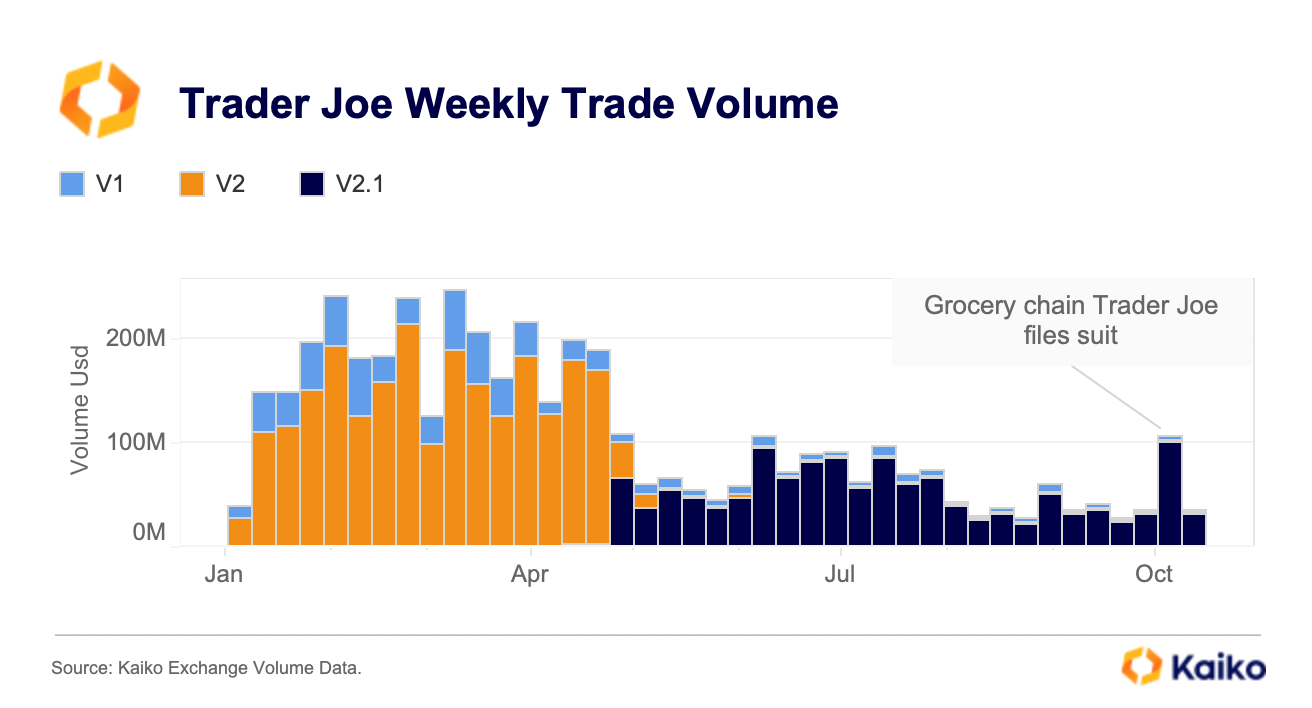
Last week, we updated our DeFi data coverage to include Trader Joe (v1, v2, and v2.1), the top DEX on the Avalanche blockchain. Launched in 2021, Trader Joe offers swaps, yield farming, staking, lending, and an NFT marketplace.
Since August, weekly volumes have averaged about $20mn, a steep drop from earlier in the year, reflecting a broader DeFi downturn. In early October, trade volume spiked to its highest level in months after the DEX faced charges from the grocery chain Trader Joe’s for alleged trademark infringement.
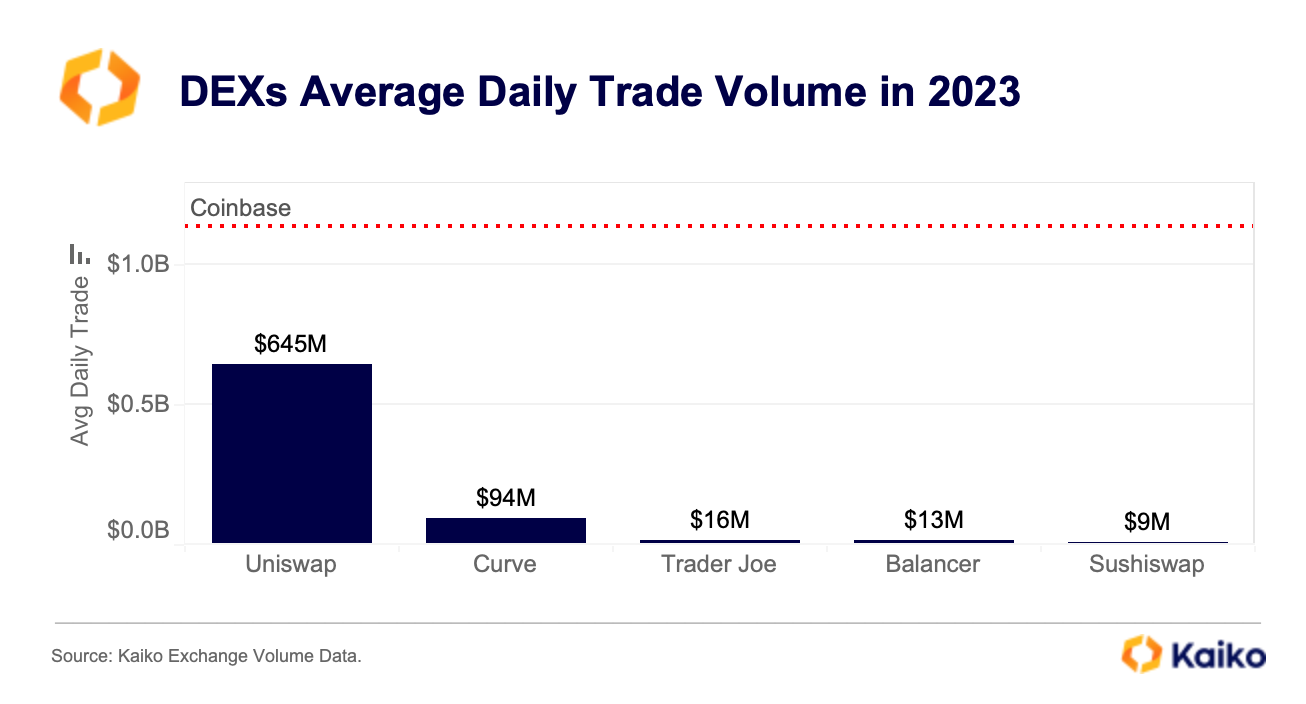
Overall, decentralized exchanges have some way to go before catching up to their centralized counterparts. The average daily trade volume on Uniswap (V2 and V3) in 2023 stands at $645mn, about half of Coinbase’s $1.1bn. Trader Joe saw an average trade volume of $16mn, surpassing Balancer and Sushiswap.
U. S. CPI data spurs volatility amid geopolitical tensions.
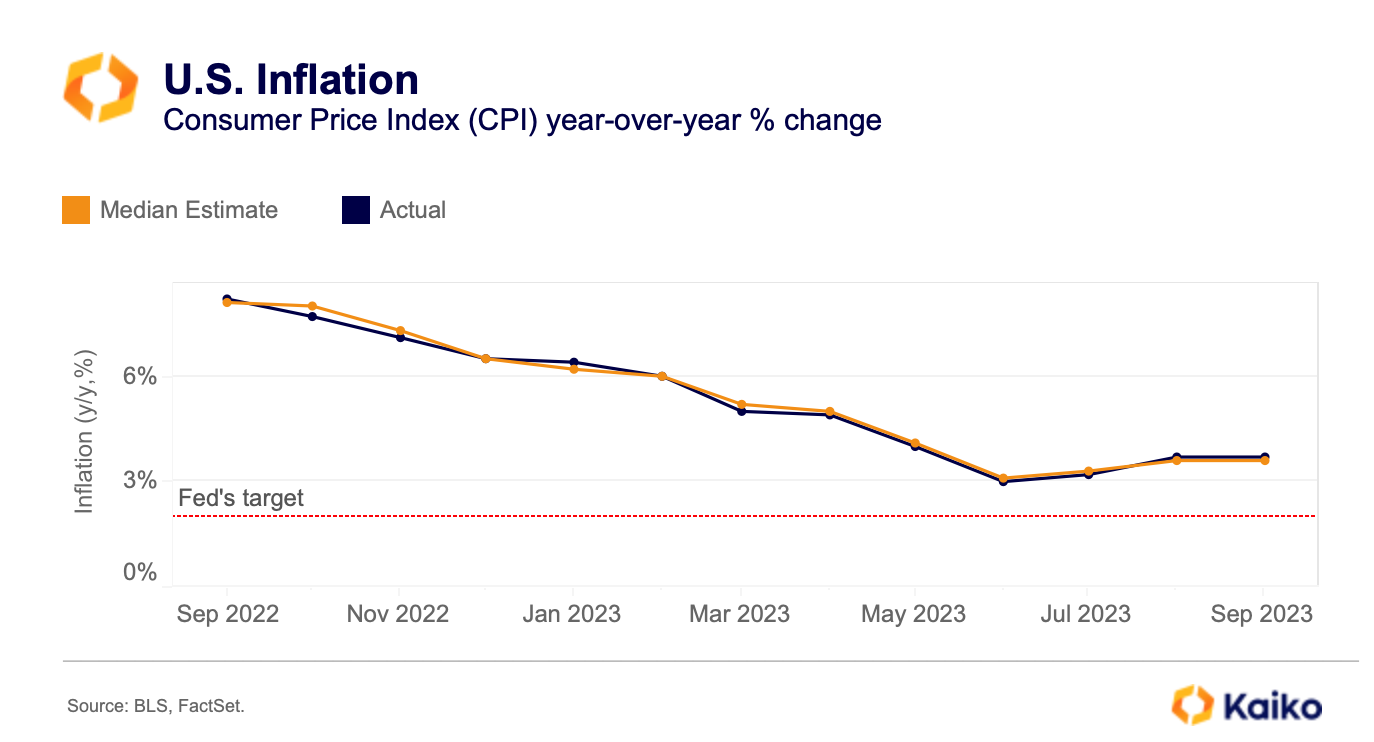
Last week, U.S. inflation data boosted market volatility despite the reading being only slightly above market expectations, which mostly reinforced the soft-landing scenario. The headline CPI rose 3.7% year-over-year vs. 3.6% expected. The increase continues to be driven by housing costs while the core CPI (excluding housing) is below 3%. The outsized market reaction to the U.S. CPI data suggests fears are building up amid escalating geopolitical tensions in the Middle East.
While the initial market reaction to the war in the Middle East appeared muted, the safe-haven bid regained traction after U.S. inflation data was published.
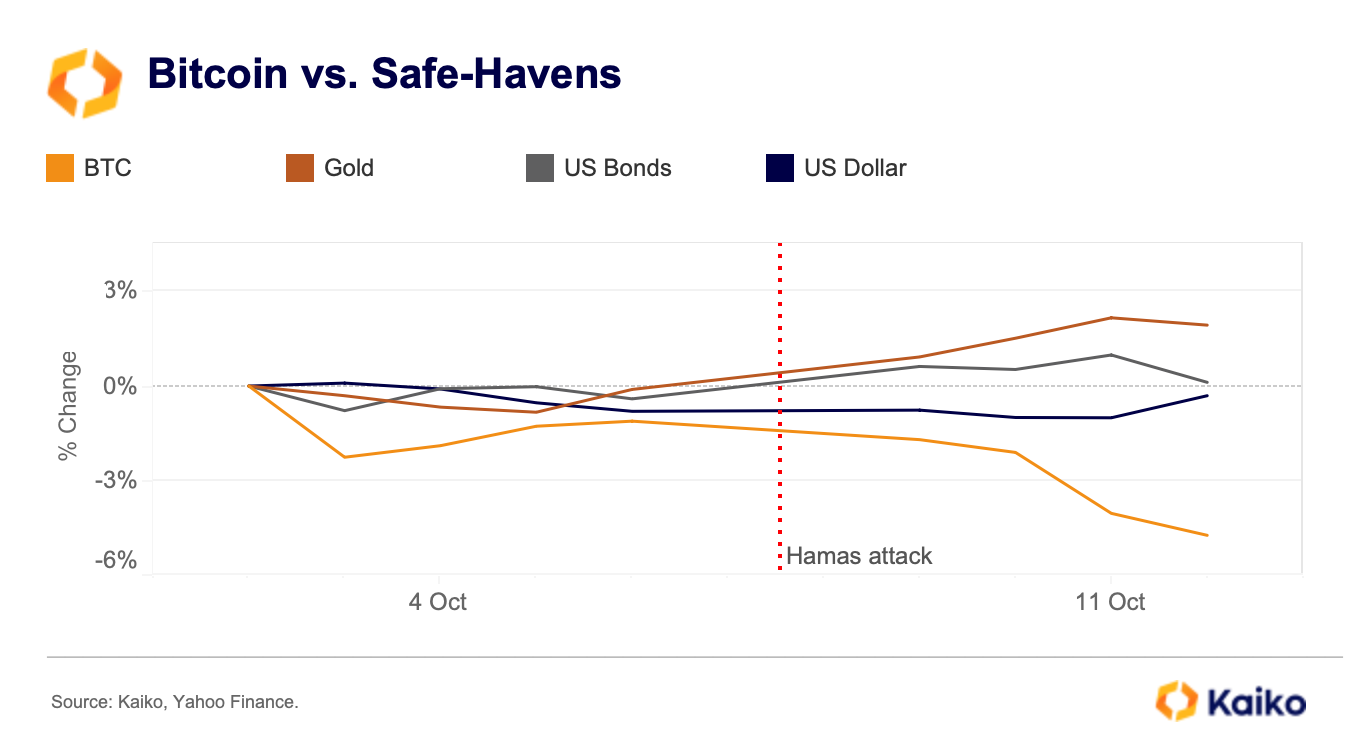
The U.S. Dollar and gold both closed the week in-the-green, up 0.2% and 5.2% respectively. Bond yields, which move inversely to prices, also increased.
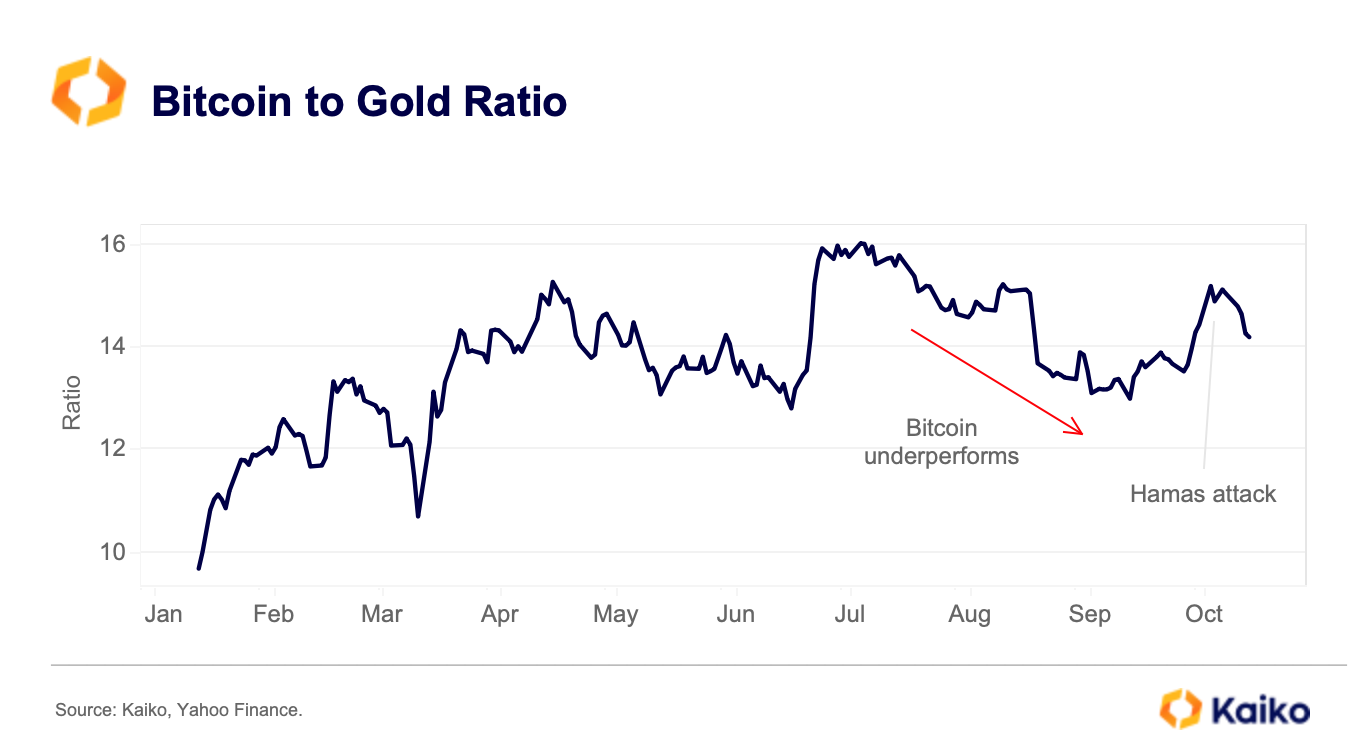
It is interesting that while BTC mostly outperformed gold in the days after the start of the Russia-Ukraine conflict, it has been steadily underperforming since the start of the Middle East conflict. The BTC to gold ratio, which measures the two assets’ relative performance, has fallen from 15 to 14, its lowest level since August.