Data Points
Binance uses nearly $1mn in Ethereum gas in one hour.
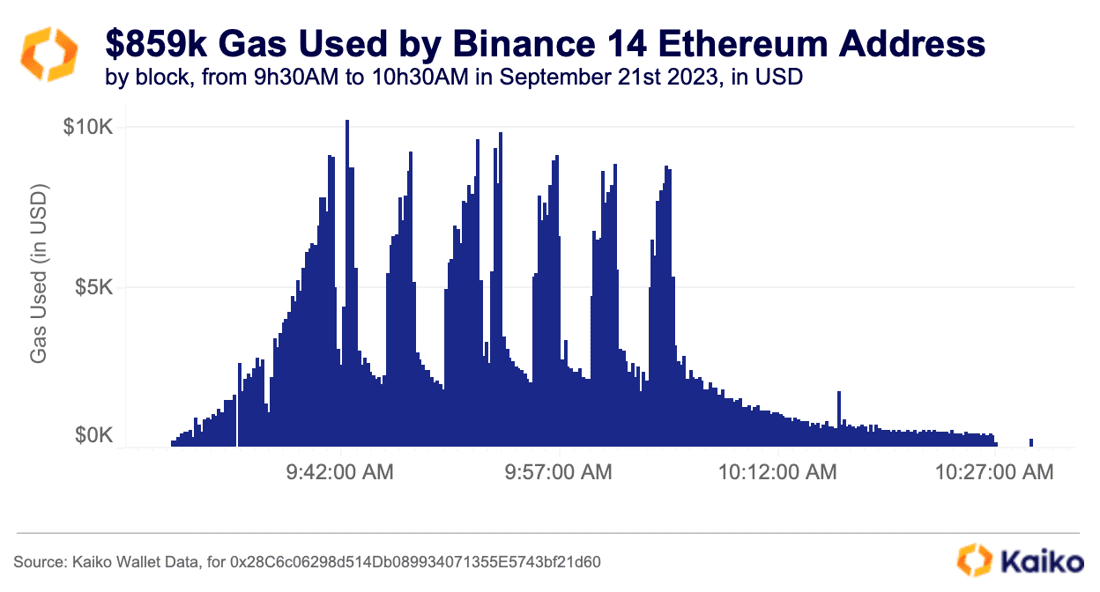
One of Binance’s hot wallets briefly became the top gas guzzler on Ethereum as the exchange said it was consolidating ETH balances. The chart, powered by Kaiko’s new Wallet Data, shows how the gas was spent in waves, with the exchange spending up to $10k in gas in a single block. Note that this tracks gas used, defined as the gas used to send funds to this specific wallet. The data matches Binance’s explanation that it was moving ETH from a variety of other wallets to the “Binance 14” wallet. However, it’s unclear why the exchange chose to move the funds in such a short time period, incurring massive gas fees.
Learn more about how to gain deep insights from blockchain wallets with our user guide:
Wallet Data User Guide
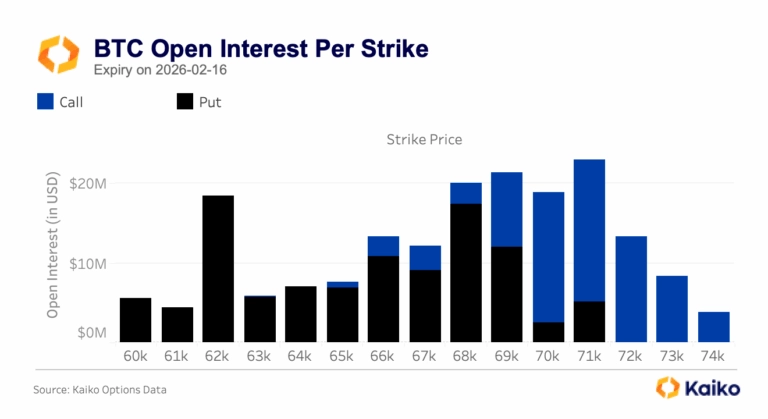
WLD price surges as CVD briefly flips positive.
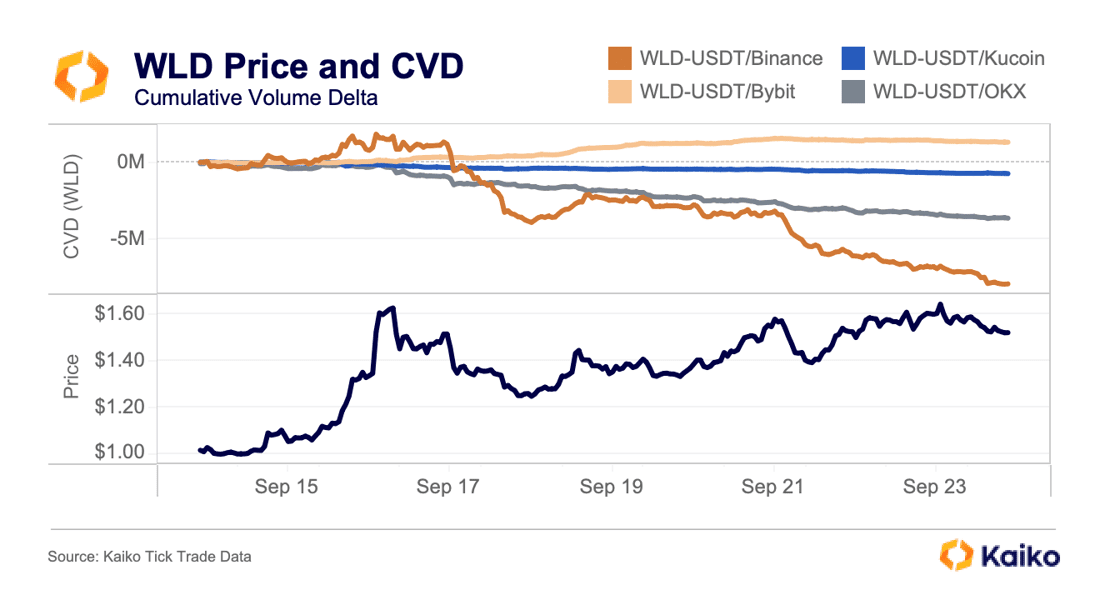
Worldcoin (WLD) surged more than 50% early last week amidst a flurry of activity on Binance, with daily volumes jumping from less than $50mn across all exchanges to $175mn on Binance alone. This volume skewed towards market buying, as Binance’s WLD-USDT cumulative volume delta (CVD) quickly increased to nearly 2mn WLD.
However, in the days since, the CVD on this instrument has turned sharply negative, indicating strong market selling. CVD has also been negative on Kucoin and OKX, with Bybit’s WLD-USDT instrument one of the few to have a positive CVD after the events of last week. It’s possible that some of this activity was market makers repurchasing WLD tokens ahead of their loan expiring next month, as discussed in our Deep Dive covering Worldcoin’s launch.
Tether market share on Binance hits 17-month high.
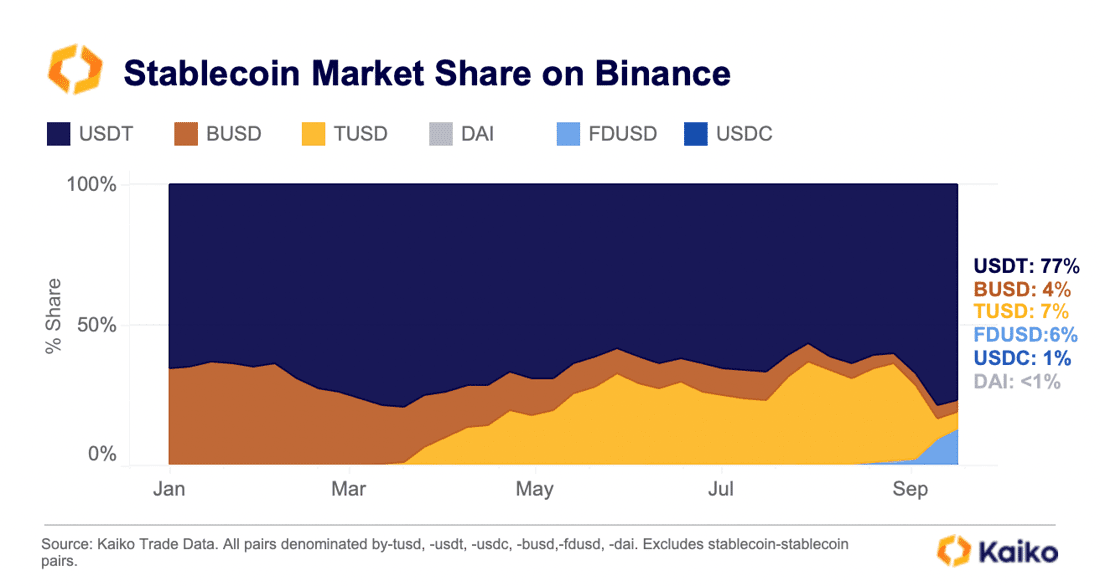
Binance can make or break the fortunes of a stablecoin just by changing trading fees. Over the past year, the exchange has experimented with zero fees for a selection of stablecoins, first USDT, then BUSD, then TUSD, and now FDUSD. Binance’s exact strategy is unclear, but the data shows the fee changes instantly cause volumes to rise or fall.
Last week, the share of USDT trade volume on Binance rose to 77%, its highest level since April 2022. The shift happened only after the exchange re-introduced taker fees for its TUSD trading pairs, causing the stablecoin’s trade volume to plummet. At one point, it appeared as if Binance had crowned TUSD as the successor to BUSD, but it is clear this strategy has changed.
Meanwhile, the little-known FDUSD has now emerged as the second largest stablecoin by trade volume after Binance removed both maker and taker fees.
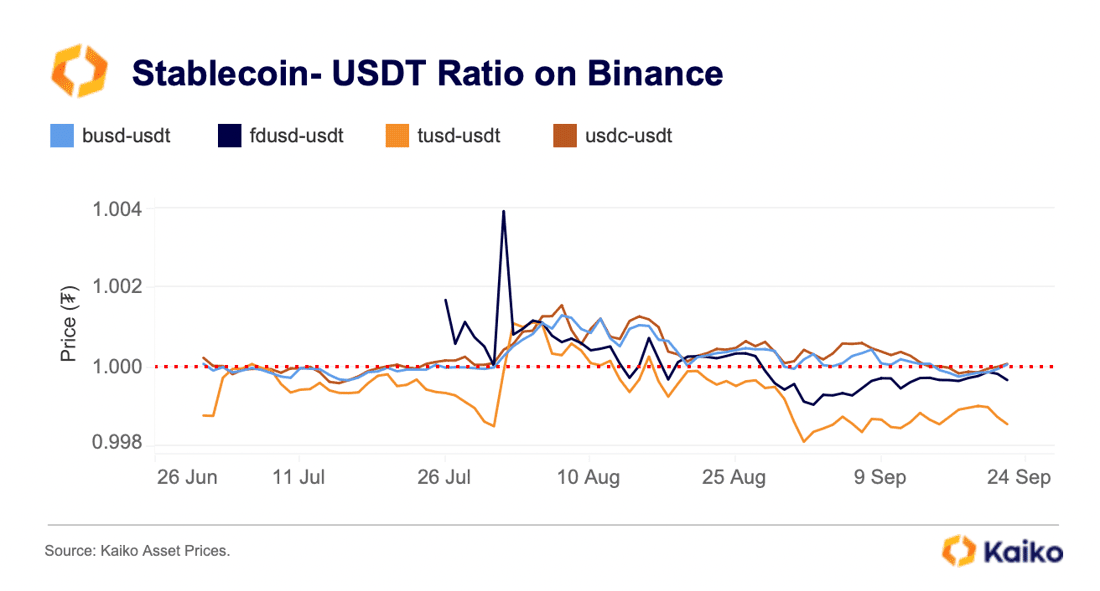
Binance is the world’s largest exchange and stablecoins are a billion dollar business, so it is worthwhile to pay close attention to these types of promotions. Since end-August, TUSD have been trading at a persistent discount against USDT, which could suggest that traders are rotating into USDT.
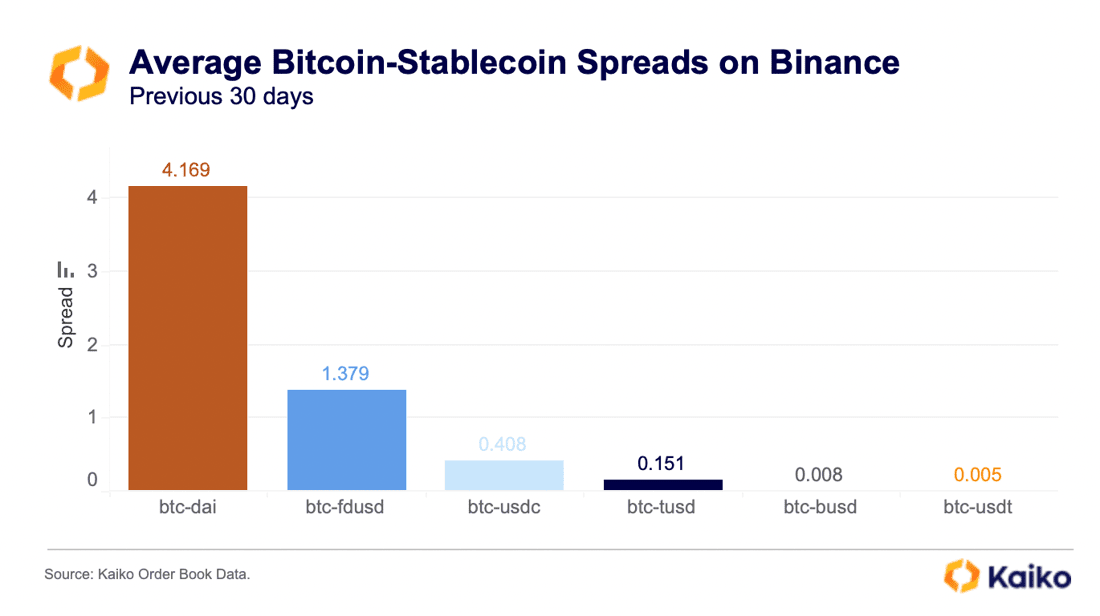
Looking at the average bid-ask spread, which measures the cost of trading and is a good indicator for market maker liquidity, we can observe that BTC-FDUSD is still much less liquid than BTC-TUSD. The average spread over the past 30-day period was 1.37bps for BTC-FDUSD versus 0.15bps for BTC-TUSD and just 0.005bps for BTC-USDT pairs.
Overall, Binance accounts for an overwhelming 98% share of TUSD trade volumes on CEXs and the stablecoin will likely lose traction without Binance’s incentives.
XRP is the most traded altcoin on U. S. Exchanges.
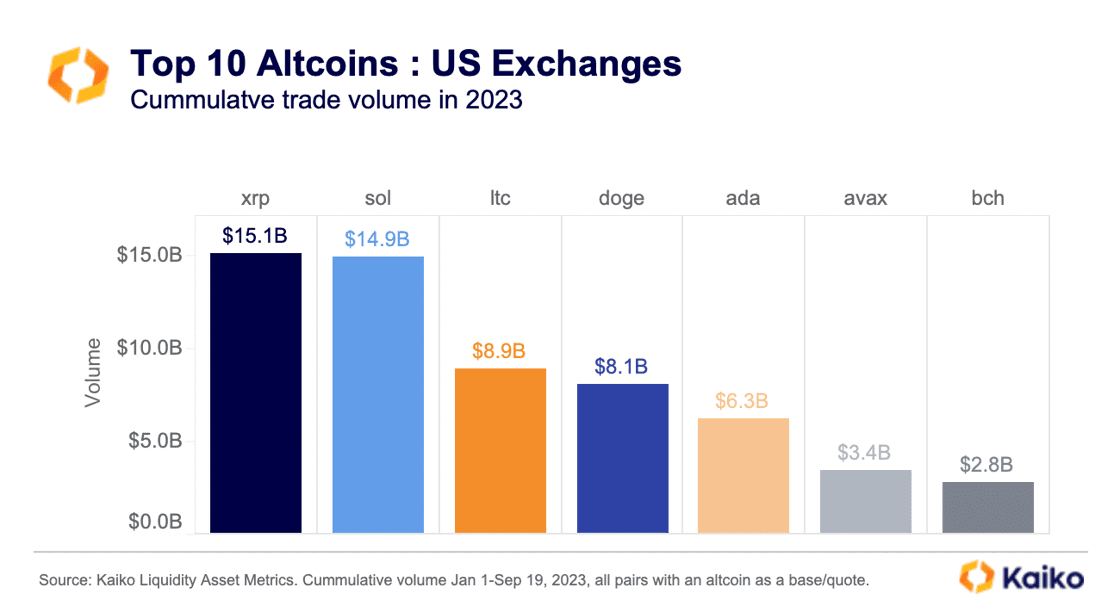
Ripple’s XRP has surpassed Solana’s SOL as the most traded altcoin by cumulative trade volume on U.S.-available exchanges as of mid-September. While XRP lost most of its July price gains and has underperformed SOL YTD, it has benefited from a positive liquidity shock after the July court ruling (i.e., an increase in the number of traders willing to trade the token). LTC and DOGE were next in line with more than $8bn in cumulative trade volume so far this year. Despite struggling to find a market after its launch back in 2017, Bitcoin Cash (BCH) has found its way into the top six traded altcoins on U.S. exchanges after being listed by EDX Markets — a new exchange backed by major Wall Street players — back in June.
Mt Gox extends repayment deadline.
Last week, management for the bankrupt Japanese exchange Mt Gox announced it would delay its deadline for creditor repayment by a year to October 31, 2024. The Mt Gox estate currently holds 142,000 BTC, 143,000 BCH and 69bn JPY.
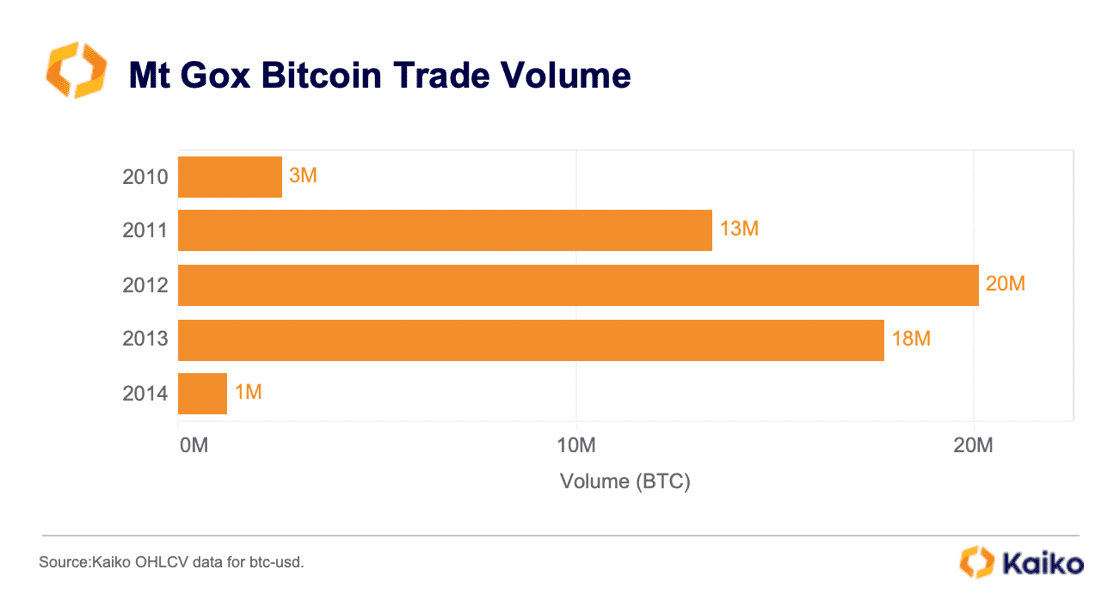
Mt Gox was once the world’s largest crypto exchange. At its peak in 2012, the exchange facilitated more than 20mn BTC in transactions, which we can observe using Kaiko’s historical trade data, some of the oldest crypto data that exists. The exchange collapsed in 2014 following one of the biggest hacks in crypto history, but at the time the stolen BTC was worth only a few million dollars. Today, it is worth $23 billion.
Alameda probably caused the Binance.US flash crash.
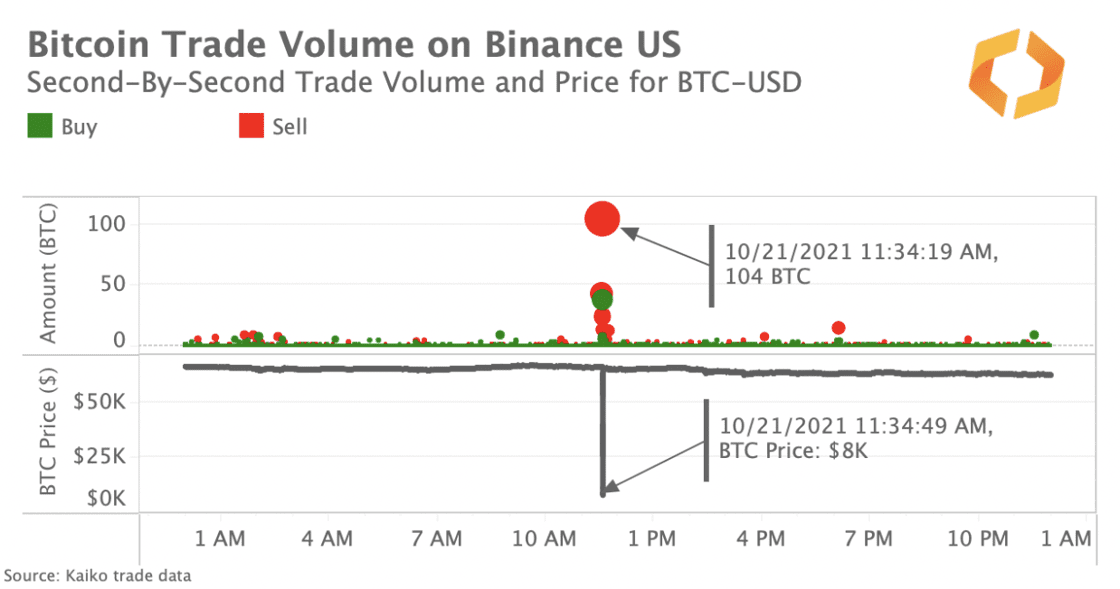
Last week, the mystery around the 2021 bitcoin flash crash on Binance.US was apparently resolved. At the time, Binance.US attributed the crash to a bug in the trading systems of one of their institutional traders but did not reveal the identity of the trader. Last week, a former Alameda employee claimed that the crash was due to an Alameda trader mistakenly selling a large amount of BTC, causing prices to tank instantly from $66k to $8k on Binance.US, with millions in losses.
At the time, the liquidity crunch and extreme volatility on Binance.US rippled throughout other markets, demonstrating how an exchange-specific flash crash is never an isolated event. The crash resulted in an almost complete depletion of market depth on Binance.US and caused a market-wide increase in spreads.
Bitcoin miners continue to outperform.
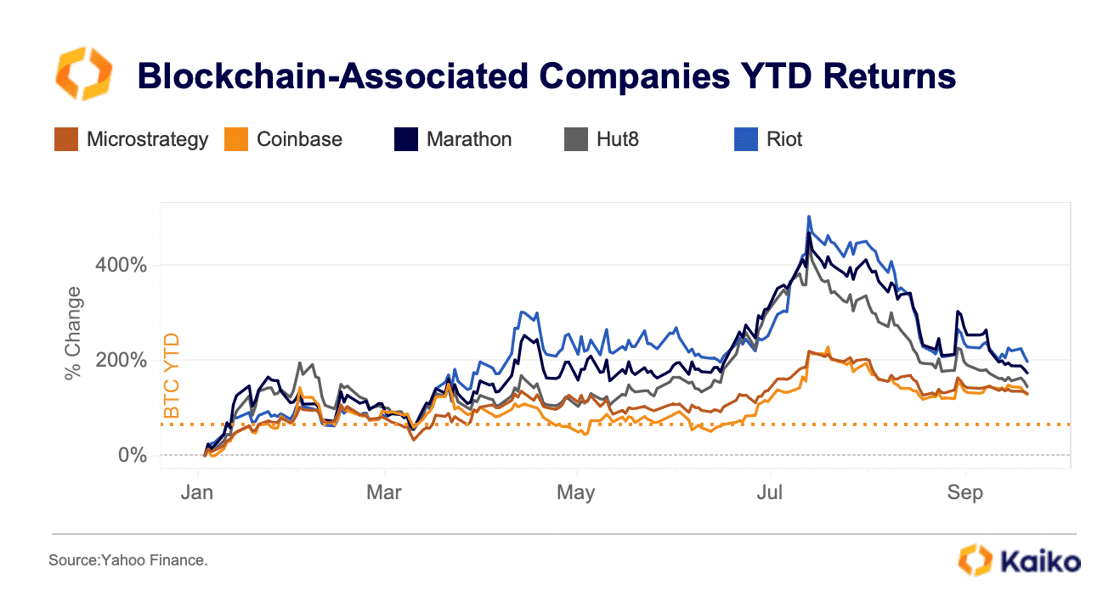
Despite losing some of their July gains, most Bitcoin miners continue to outperform spot BTC and other blockchain-associated companies year-to-date. Riot Platforms — one of the largest BTC miners in Texas — is up by a staggering 197% YTD after earning a record $31mn from power credits in August. Marathon Digital surged by 173% while Hut 8 rose by 145%. Coinbase and Microstrategy have also outperformed spot BTC and are up by around 130% this year, boosted by ETF-related optimism. While the advent of ordinals in February boosted miners’ fee revenue, hash rate and network difficulty have continued to rise, weighing on the industry.
Bond yields rise as markets price higher for longer.
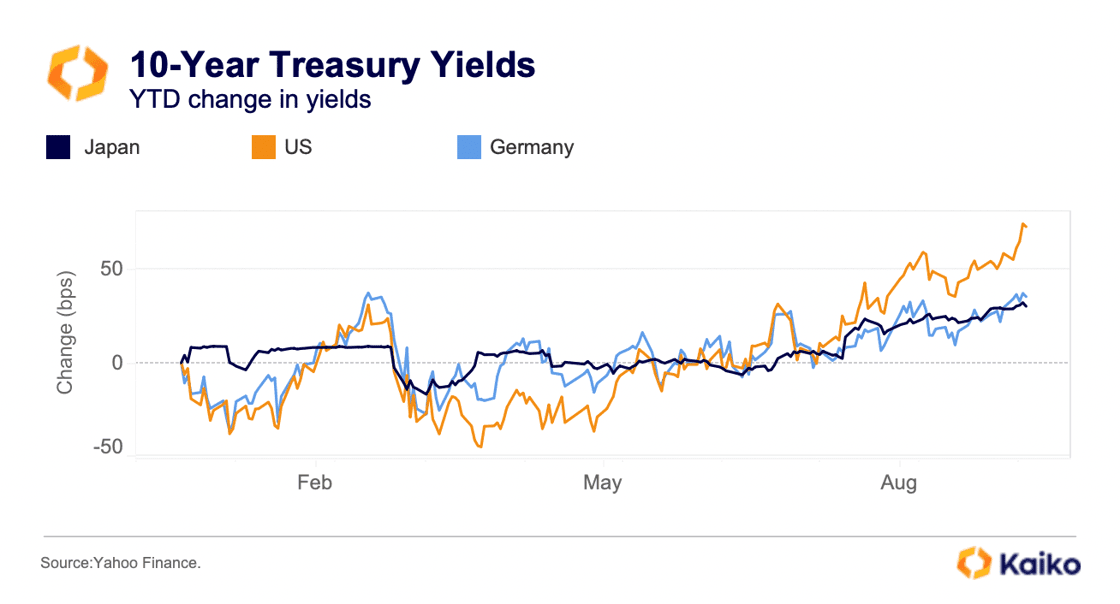
Global bond yields surged last week as markets priced in the Fed’s higher for longer stance, sparking a sell-off in risk assets. BTC remained resilient in stark contrast to tech equities which saw their worst one-day drop since February. However, this apparent resilience could be due to the fact that BTC has already sold off throughout August. A week out from the end of the quarter, Bitcoin’s fell by 13% relative to Q2 while the Nasdaq 100 has been mostly rising last month and is down 3%.
Since the end of July, the U.S. 10-year bond yield are up by more than 70bps, driven by a rebalancing in bonds supply post debt ceiling deal and sharp repricing in rate cuts expectations for next year. German bund yields are up more than 30bps as the ECB hiked rates to an all-time high of 4% in early September. Even Japan nominal yields have risen by more than 30bps since the end of July, due to the BoJ tweaking its seven-year-old Yield Curve Control (YCC) program.