AEUR sees strong volatility after launch on Binance.
Last week, two Euro-backed stablecoins made the news after launching on major exchanges. AEUR, issued by the Swiss company Anchored Coins, began trading on Binance on December 5. Just a day later, EURCV, first stablecoin issued by a bank, Société Générale, was listed on Bitstamp. While EURCV had low initial volumes, AEUR saw heavy buying, causing its price to surge by more than 300% within minutes around 6pm UTC on December 5.
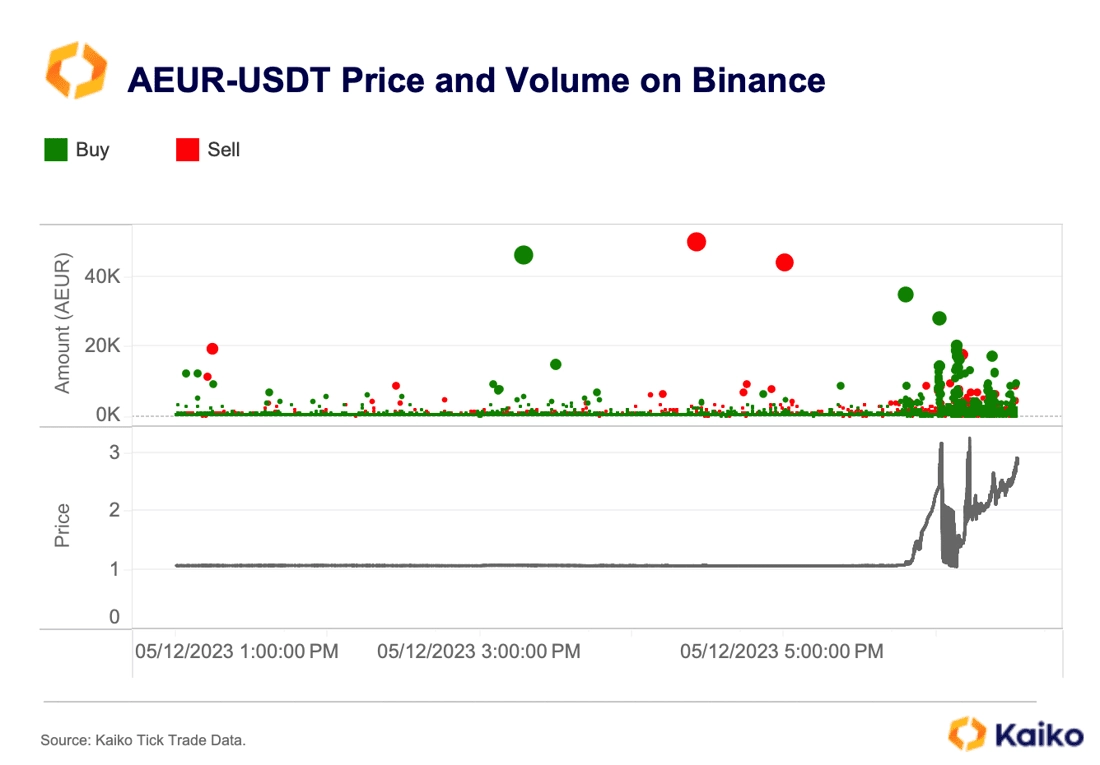
AEUR market depth evaporated, with bid and the ask-side depth dropping by 96% and 92%, respectively, forcing Binance to suspend trading of the stablecoin and compensate users. Trading reopened on December 8 with significantly higher liquidity on the bid side.

The unexpected market activity was caused by zero fees and low liquidity, highlighting the importance of market makers for stablecoin peg stability.
Overall, demand for EUR- backed stablecoins has been low over the past two years, with monthly trade volumes for the top three stablecoins by market cap — Tether’s EURT, Stasis’s EURS, and Circle’s EURC — averaging just $200mn compared to more than $630bn for USD-backed stable coins.
JTO airdrop selling is quickly absorbed.
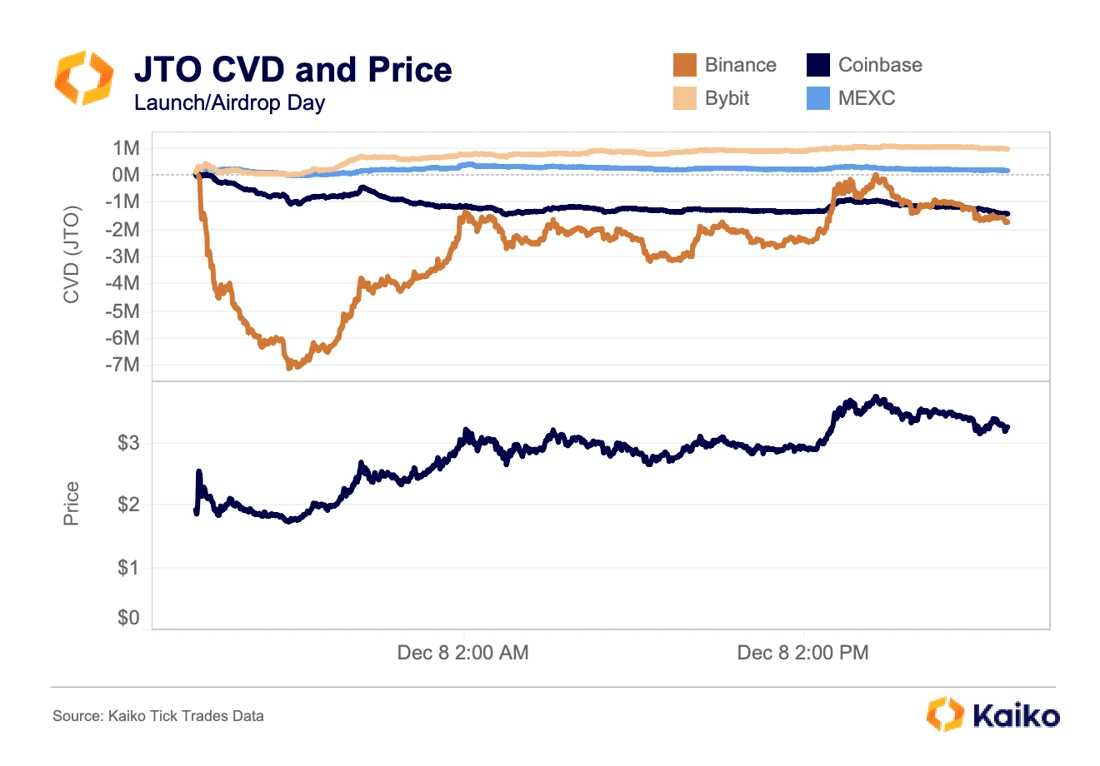
Jito – the liquid staking and MEV protocol on Solana – made waves last week as it airdropped its token, JTO, to users. 90mn tokens were immediately made available to claim by airdrop recipients, many of whom then rushed to Binance to sell their allocation. In the first three hours of trading, there was a net of 7mn tokens sold, barely pushing price down from $2 to just under $1.75.
After this initial wave of selling was exhausted, CEX buying began in full, with Binance rapidly reversing its selling trend, while Bybit and MEXC have shown consistent buying since launch. Coinbase has been the odd one out, notably enabling trading at roughly the same time as the other exchanges, but registering consistent net selling.
New top 50 token has just $5k in market depth.
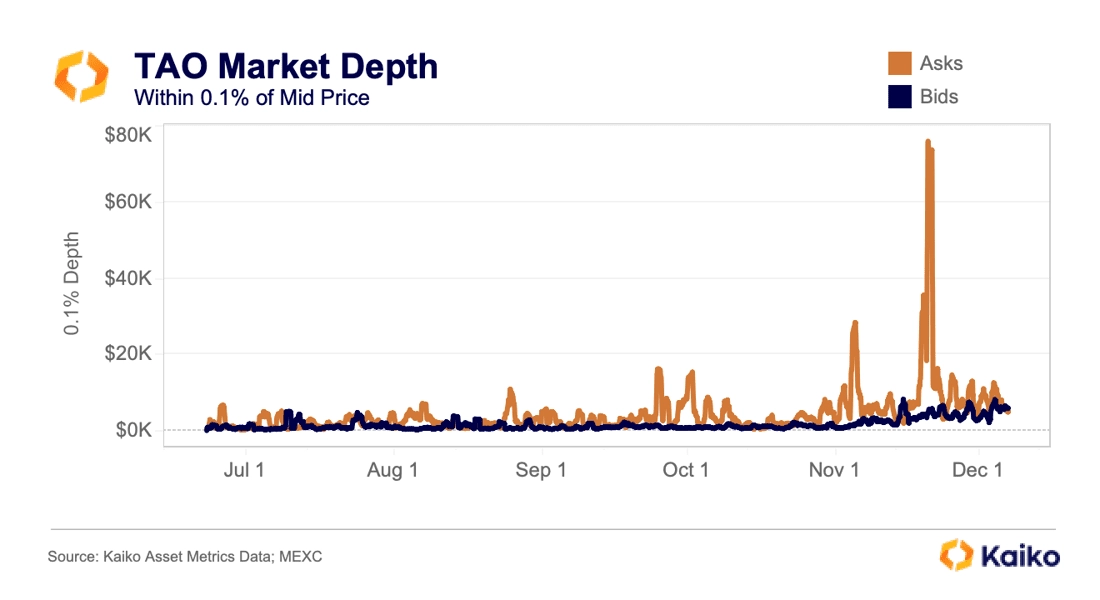
Bittensor (TAO) has rallied from under $50 in mid October to over $350 at the time of this writing as AI-related tokens have outperformed. However, much like other altcoins, its liquidity has not tracked its price increase. Despite a market cap of over $2bn, the token is still not traded on larger exchanges like Binance or Coinbase, with the vast majority of its volume on MEXC and some on Uniswap. The newly minted top 50 token has just $5k in bid depth within 0.1% of the mid price, with slightly more on the ask side. It has been encouraging to see crypto volumes pick up in recent months, but the ongoing lack of liquidity suggests that altcoin volatility is likely to continue.
Bitcoin open interest approaches 18-month highs.
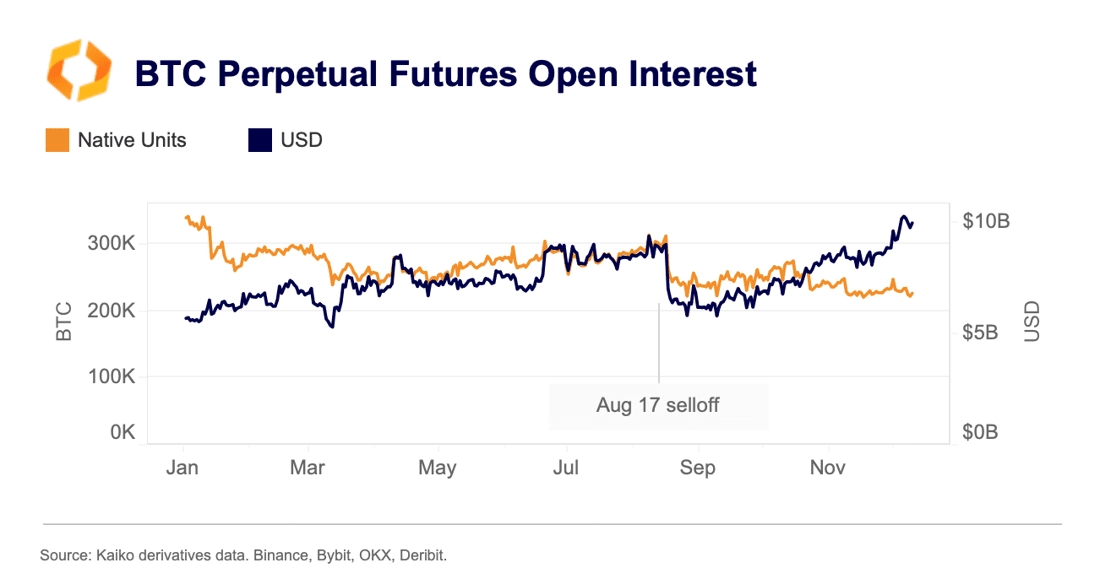
As bitcoin’s price rises at the fastest pace in years, open interest has surged even amidst large liquidation events. Open interest hit $10.2bn last week for perpetual futures contracts on Binance, Bybit, OKX, and Deribit, its highest level since March 2022.
It should also be noted that when looking at just the quantity of open contracts denominated in BTC (native units), we see a much different story. Price effects come into play as BTC rises, which can sometimes obscure trends, in this case a downwards drop in the BTC value of open contracts since the start of 2023.
Binance speeds up delistings amid regulatory scrutiny.

The number of active listed trading instruments on Binance has declined by 21% YTD. OKX and Coinbase have delisted some instruments, while Kraken has seen a slight increase. It is a common practice for exchanges to delist trading pairs with low volume and liquidity. However, the trend has accelerated significantly since August, which could suggest a shift in Binance’s listing practices amid increased regulatory scrutiny.
SOL market depth hits YTD low.
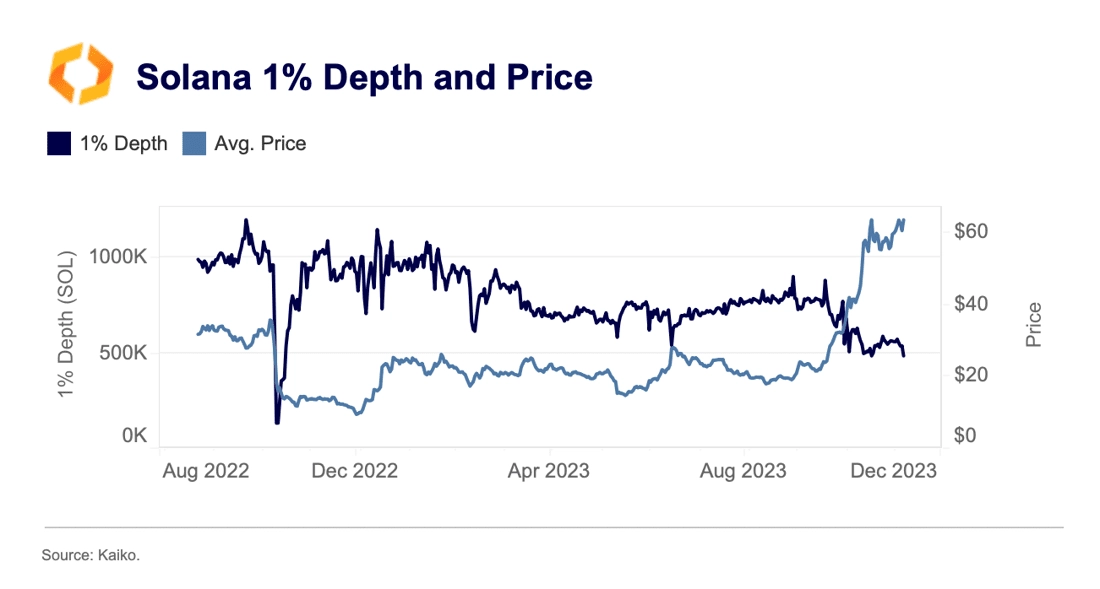
SOL resumed its rally last week hitting a 19-month high, defying fears of a price decline due to the selling of FTX’s significant SOL holdings. While prices have rallied from $18 to $75 since early September, market depth in native units (denominated in SOL) has been on a steady downward trend, declining by around 50% to 467k SOL. USD prices and depth expressed in native units have often moved in the opposite direction as market makers actively manage their exposure based on multiple factors including price changes, volatility expectations, and forward-looking price assessments. However, their correlation isn’t constant, especially in times of market turbulence.
It is notable that the last time SOL liquidity across CEXs was at similar levels, SOL prices were 30% higher than the current level.
Interestingly, we observe high volatility in SOL ask-side market depth on U.S. exchanges throughout November.

In particular, the 0.5% ask-side market depth varied by more than 200k SOL in just one hour on Coinbase between November 8-10. On Kraken, dislocation occurred between November 15-22. This could suggest that a lot of market buying was expected on those exchanges at the time.


![]()
![]()
![]()
![]()


