HOW DEEP IS YOUR BID?
It’s often said that an asset is as valuable as it is liquid, and cryptocurrency exchanges are no different. Liquid exchanges offer superior trading conditions, such as reduced slippage and lower execution risk. While liquidity can be calculated in various ways, we’ve opted to develop a liquidity score for this quarter’s exchange ranking, using five metrics, including volume and market depth.
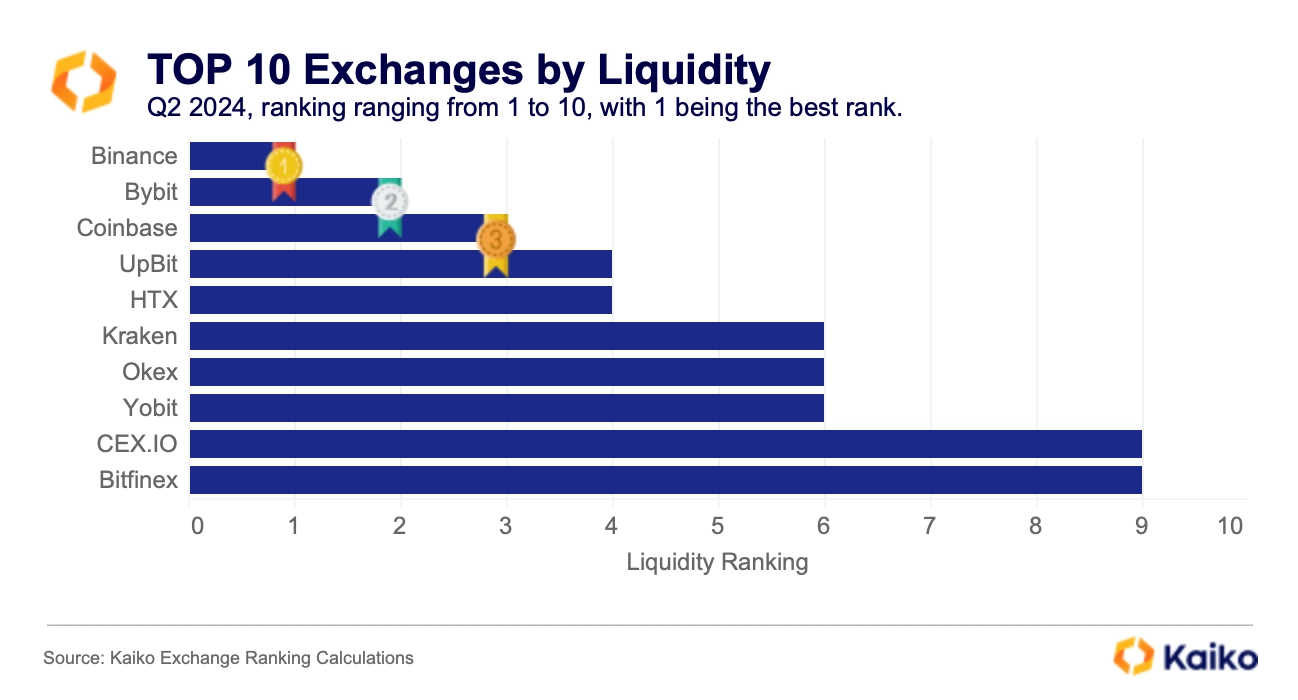
Looking at the 43 exchanges’ liquidity rankings, Binance, the world’s largest exchange, unsurprisingly takes the lead. However, Binance places third after Coinbase and Bitstamp when considering additional factors like governance scores, where it falls short compared to its top competitors.
Zooming in on the determinants of Binance’s dominance in liquidity, it seems that trading volume, volume contribution, and market depth are driving most of it. Bybit and Yobit are also interesting cases to focus on, since their high liquidity scores are also driven by volume and depth. However, they have much lower market quality scores, which better reflect their overall lower ranking when all parameters, besides liquidity, are taken into account.
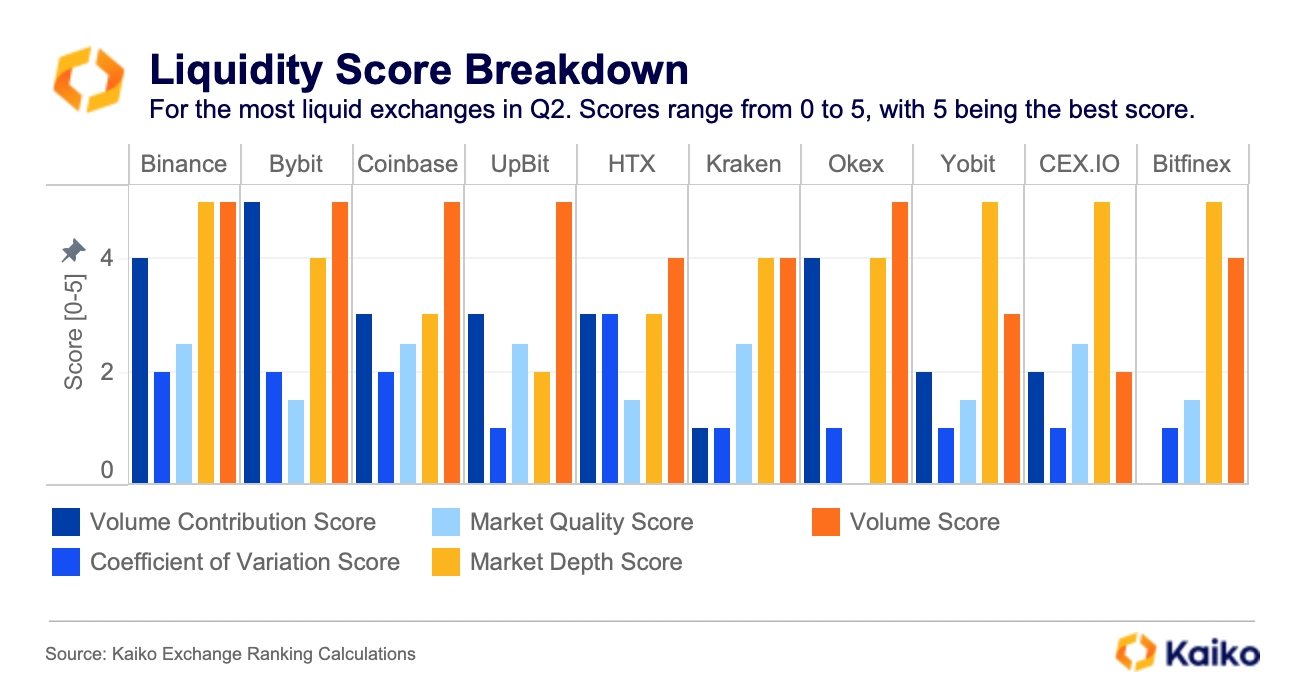
Overall, this liquidity score is computed using five liquidity metrics:
- Trading Volume
- Share of Volume (Volume Contribution)
- +/-1 Market Depth
- Cofficient of Variation (CV) Dispersion Score
- Market Quality Score
More information about each metric can be found in the ranking’s underlying methodology. Each score ranges from 0 to 5, with 0 being the worst and 5 being the best, and is computed using trading volume data, market depth data derived from order books, and web traffic data.
Binance Benefits From Wide Range of Assets
Volume is an essential component of our ranking, as it reflects the already processed liquidity by the exchange, providing us with an idea of the exchange’s capacity to handle liquidity.
Looking now at the top 10 ranked exchanges for this quarter, Binance appears to be both the most liquid exchange and the one that registers the highest trading volume on average over the three months considered. Interestingly, Binance is followed by the South Korean exchange Upbit, which, despite its apparent high volume, ranks 10th overall in this ranking due to a low business score. The exchange has only one identified member of its executive team.
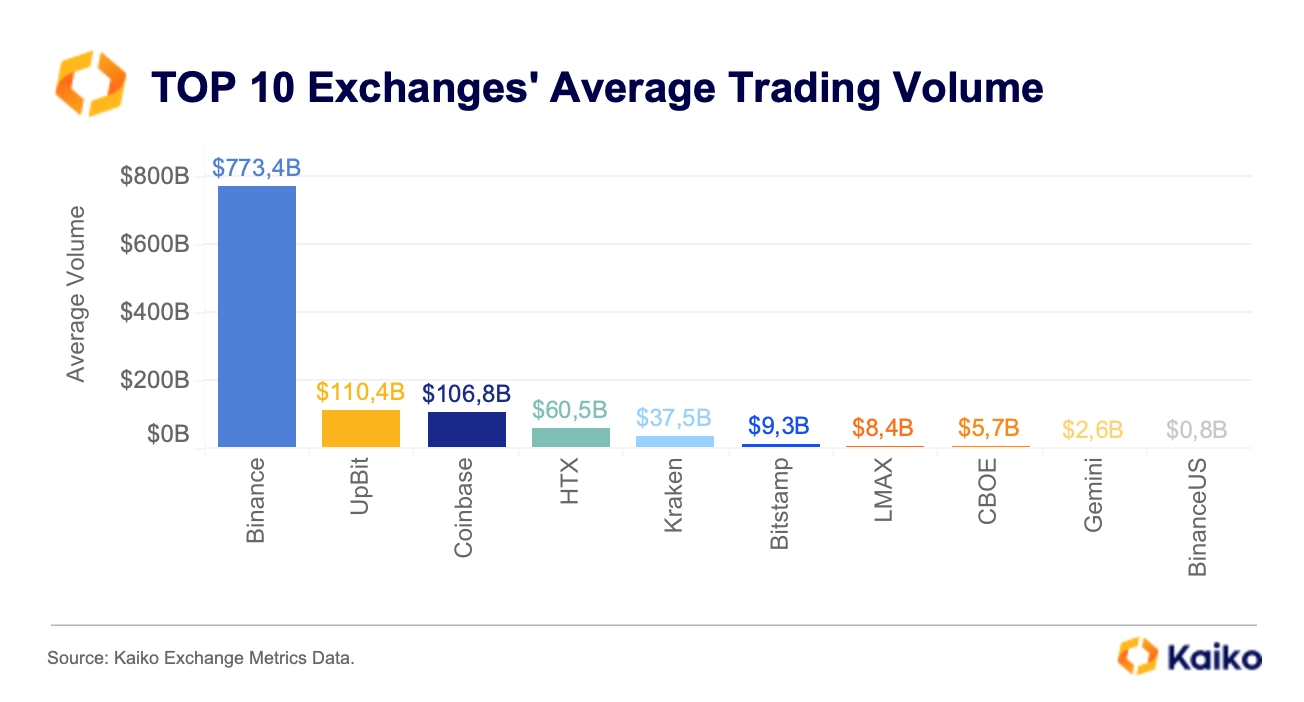
The difference in volume between Binance and Upbit, as well as other exchanges, is intriguing. Binance, which offers twice the number of assets as Upbit, has a trading volume four times higher than Upbit’s. The variety of assets available on Binance is likely one of the reasons it appears to be the exchange with the highest volume and liquidity in our ranking.

ORDER BOOK QUALITY STILL STANDS OUT
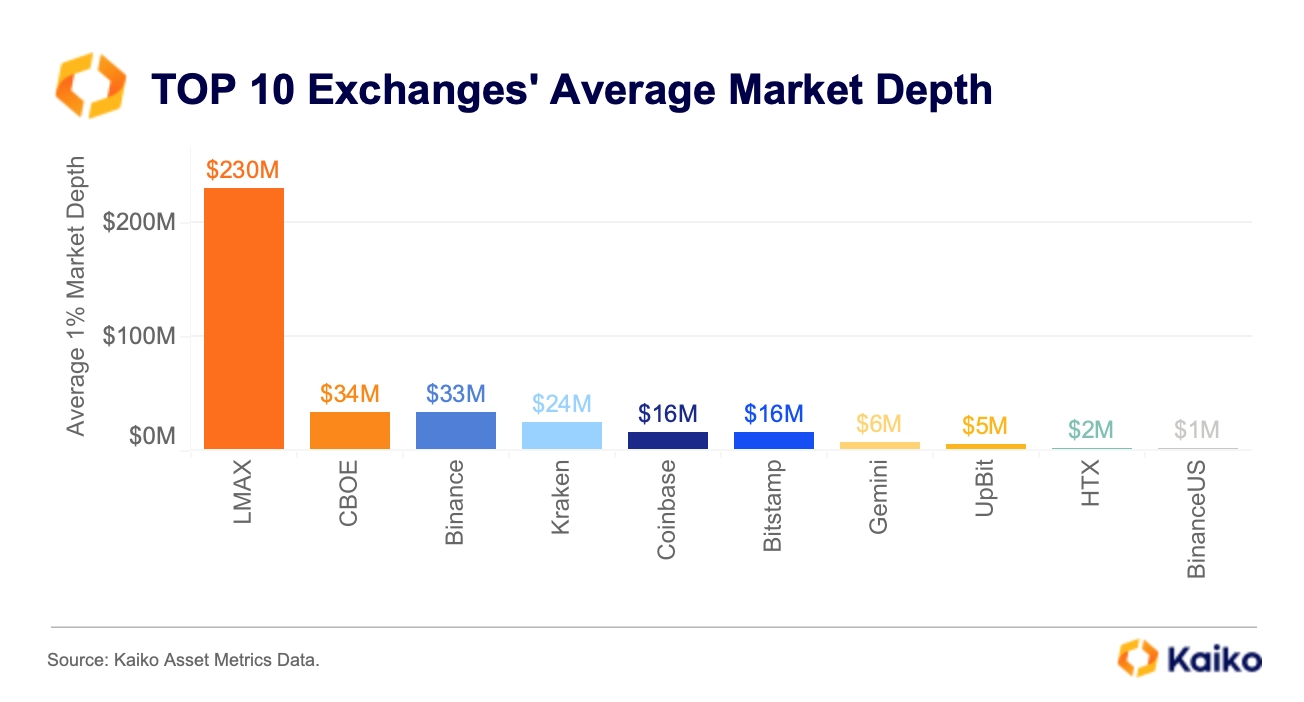
However, a larger selection of assets on an exchange doesn’t always mean greater liquidity. For example, when comparing market depth to the number of assets, LMAX, which only offers five assets on its spot trading platform, has the highest average market depth among the top 10 exchanges this quarter. This indicates that other factors, such as the quality of the order book and the types of clients an exchange serves, may be more crucial in determining market depth.
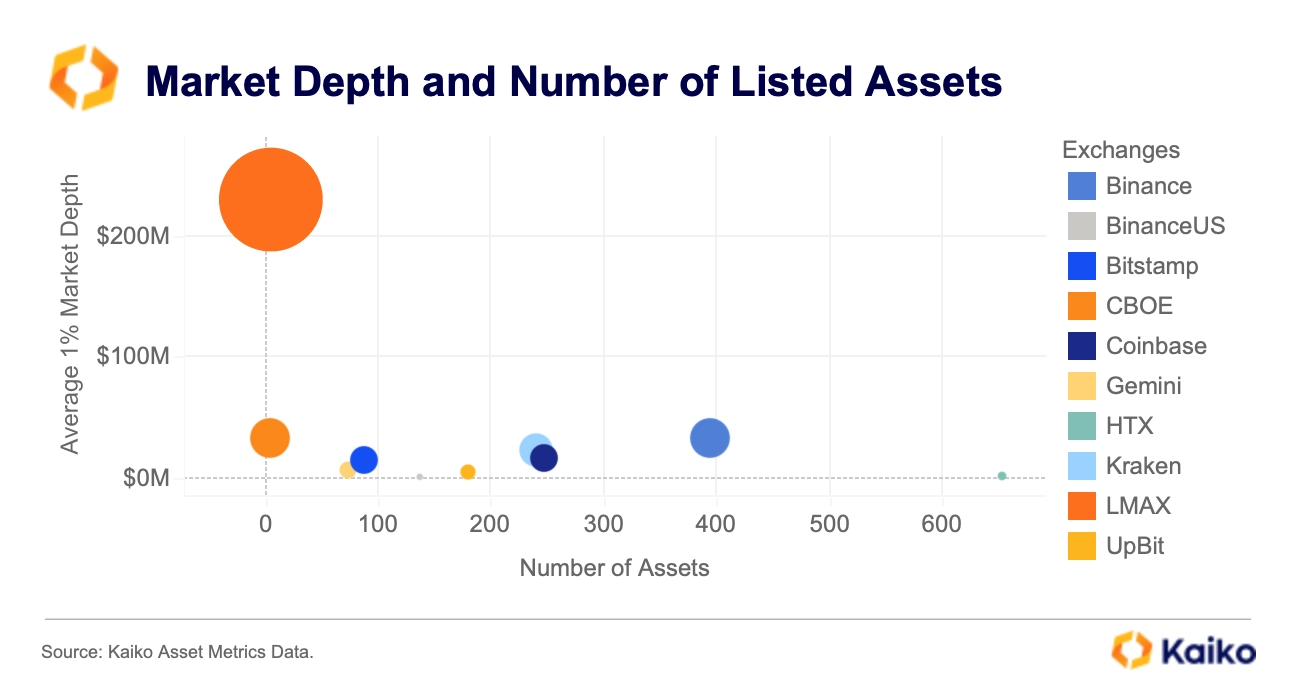
To clarify the weak correlation between market depth and the number of listed assets, let’s define this liquidity metric. Market depth is the cumulative volume available to buy and sell between the best bid and ask prices and another selected price level. In this ranking, we’re examining market depth from the best bid and ask to prices 1% higher and lower.
Why does LMAX, with only five assets, have an average market depth of $230 million? Unlike high-volume exchanges like Binance, LMAX primarily serves institutional clients who require more liquidity for larger trades and greater depth to absorb large orders without impacting the price. Additionally, Binance’s average depth may be lowered by small caps liquidity.
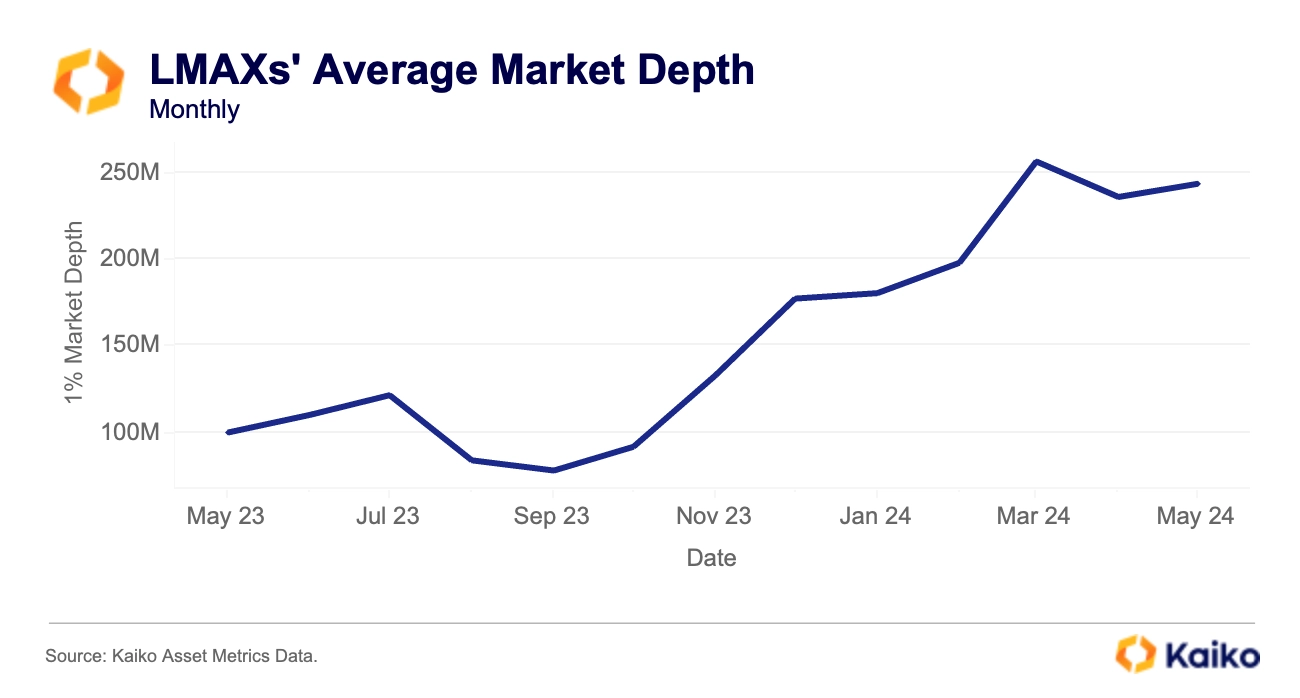
On top of that, LMAX’s depth trend over time seems to correlate with major institutional news. It started significantly increasing in November 2023, when the first beliefs around the approval of US bitcoin ETFs began to rise, and then again in February 2024.
EXCHANGE VOLUME DATA MADE EASY
Our exchange ranking and liquidity analysis were made possible by Kaiko’s extensive exchange coverage and APIs, particularly the user-friendly Exchange Metrics API, which quickly provides aggregated volume time series in USD for over 150 exchanges with historical data back to 2010. This eliminates the need to spend hours or days aggregating and converting billions of individual trades data initially accessible at the instrument level.
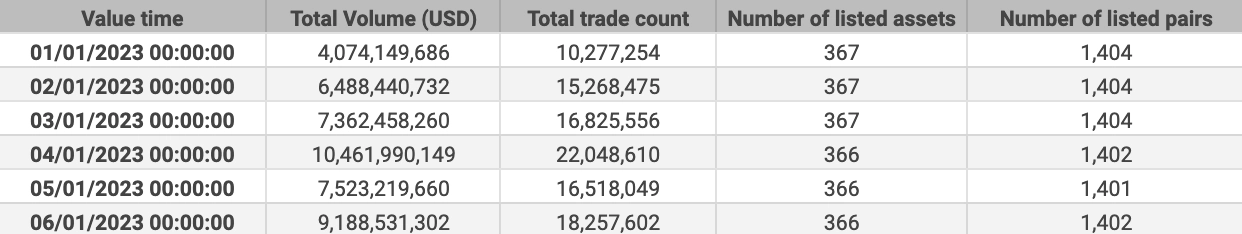
For example, one can request daily data for Binance from January 1, 2023, to January 1, 2024, by providing just these four pieces of information.
With that query, you’ll receive two output levels:
- Daily aggregated data at the exchange level, including the volume in USD, the total number of trades recorded during each day, and the number of assets and pairs listed on the exchange. This data is highly powerful when compared between exchanges, as we did for the present liquidity ranking analysis.
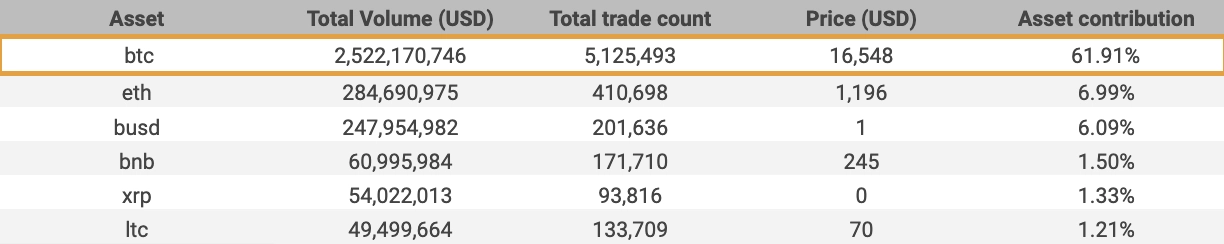
- Daily aggregated data at the asset or pair level on that exchange, including the same metrics as above. Using this layer, one can, for example, identify which asset drives most of an exchange’s volume. In Binance’s case, on January 1, 2023, 62% of the trading volume registered on the exchange was due to bitcoin.
Conclusion
The reality is both volume and market depth metrics reveal different aspects of each exchange, and together, they provide a more balanced and relative measure of an exchange’s liquidity. While large exchanges with numerous assets tend to have higher volumes, examining market depth highlights exchanges that offer excellent trading conditions but have more specialized activity.
Moreover, as mentioned on a previous deep dive, neglecting the market depth component when assessing an exchange’s liquidity can lead to overlooking wash trading practices on exchanges.
To get a comprehensive picture of the current state of exchanges, check out our latest exchange ranking.