Data Points
Meme token volumes remain resilient.
Historically, during market downturns, traders have tended to flee into quality assets, leading to a significant underperformance of meme tokens under negative market conditions.
This time is different. Despite the recent market correction, meme tokens have remained among the year’s top performers, with year-to-date (YTD) returns ranging from 80% to 1800%. Trade volume has also stayed robust, with the weekly volume for meme tokens still up by more than 200% YTD, reaching approximately $11 billion.
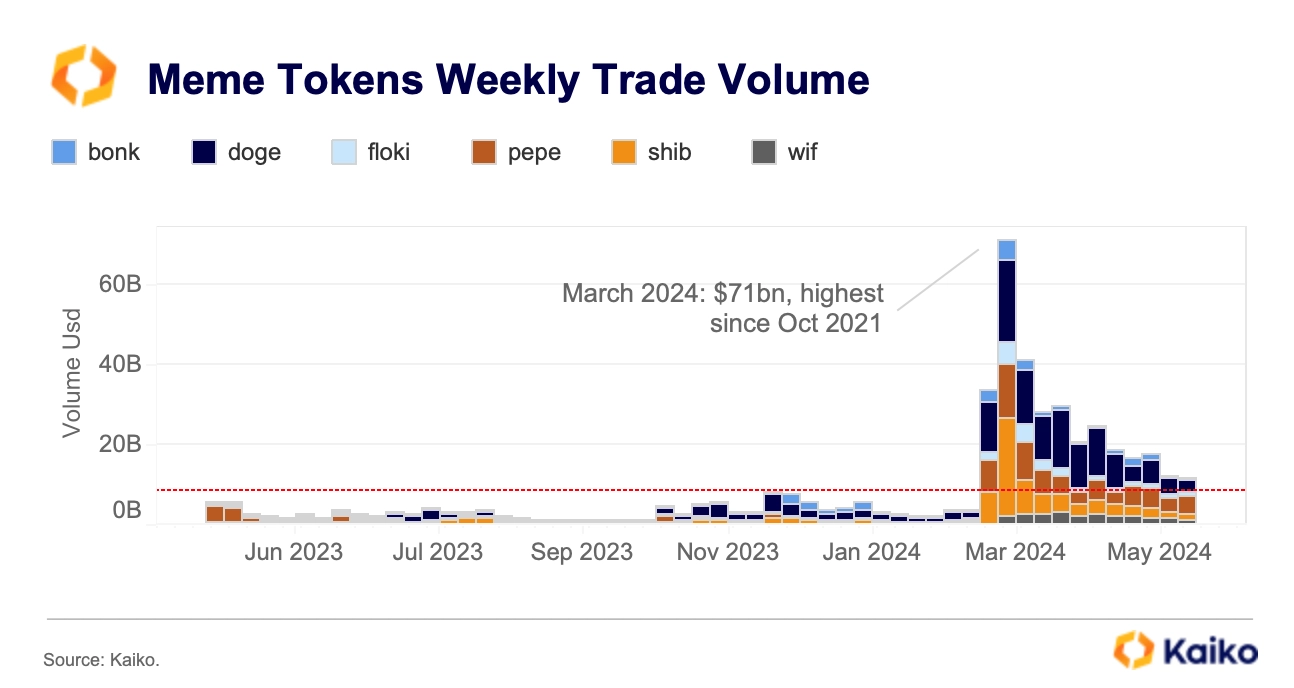
One possible explanation for their enduring popularity is their accessibility and ability to adapt to market trends, thereby attracting substantial community interest.
However, it is important to note that meme coins tend to have higher leveragecompared to most altcoins and are more driven by speculative appetite.
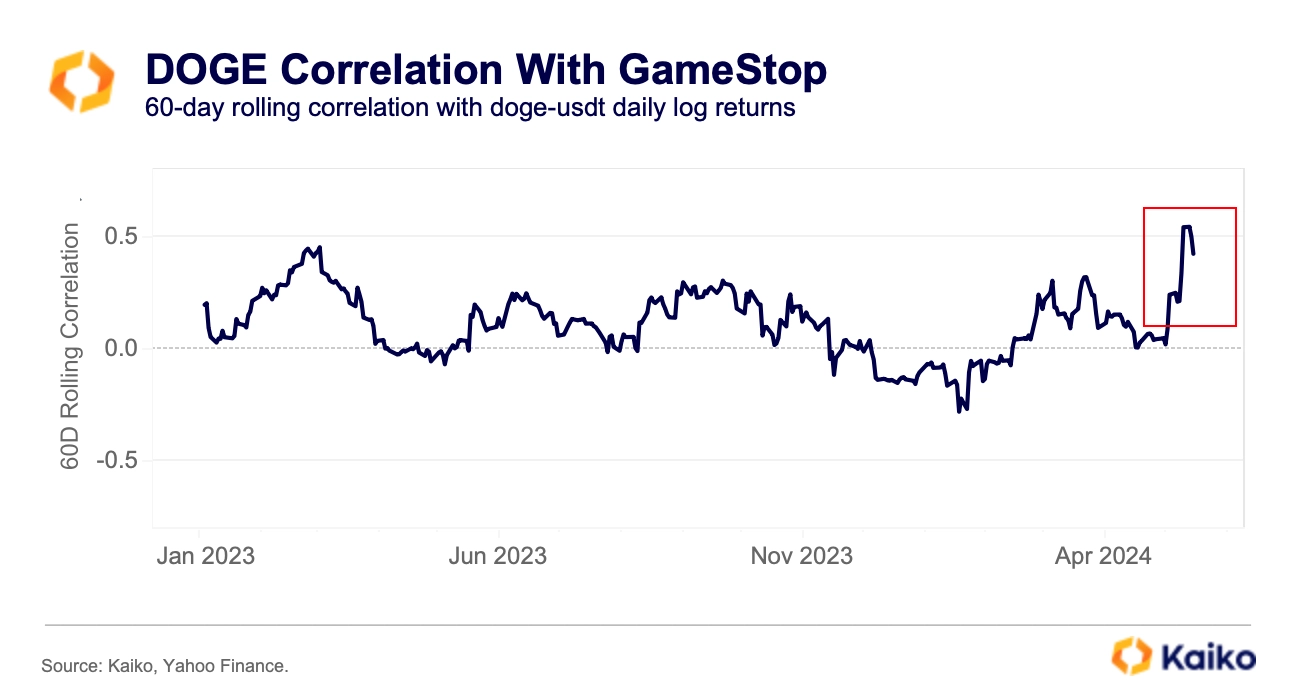
Interestingly, the correlation between meme tokens and other retail-driven speculative assets, such as meme stocks, has been relatively weak and highly volatile. For instance, the 60-day rolling correlation between the largest meme token, DOGE, and the video game retailer GameStop (GME) has mostly remained below 0.3 over the past year.
Last week, meme stocks experienced a surprise boost, with GME and the cinema chain AMC Entertainment (AMC) witnessing a surge on May 13-14. This caused the correlation between DOGE and GME to hit its highest level in more than a year.
The share of BTC traded during US hours hits ATH.
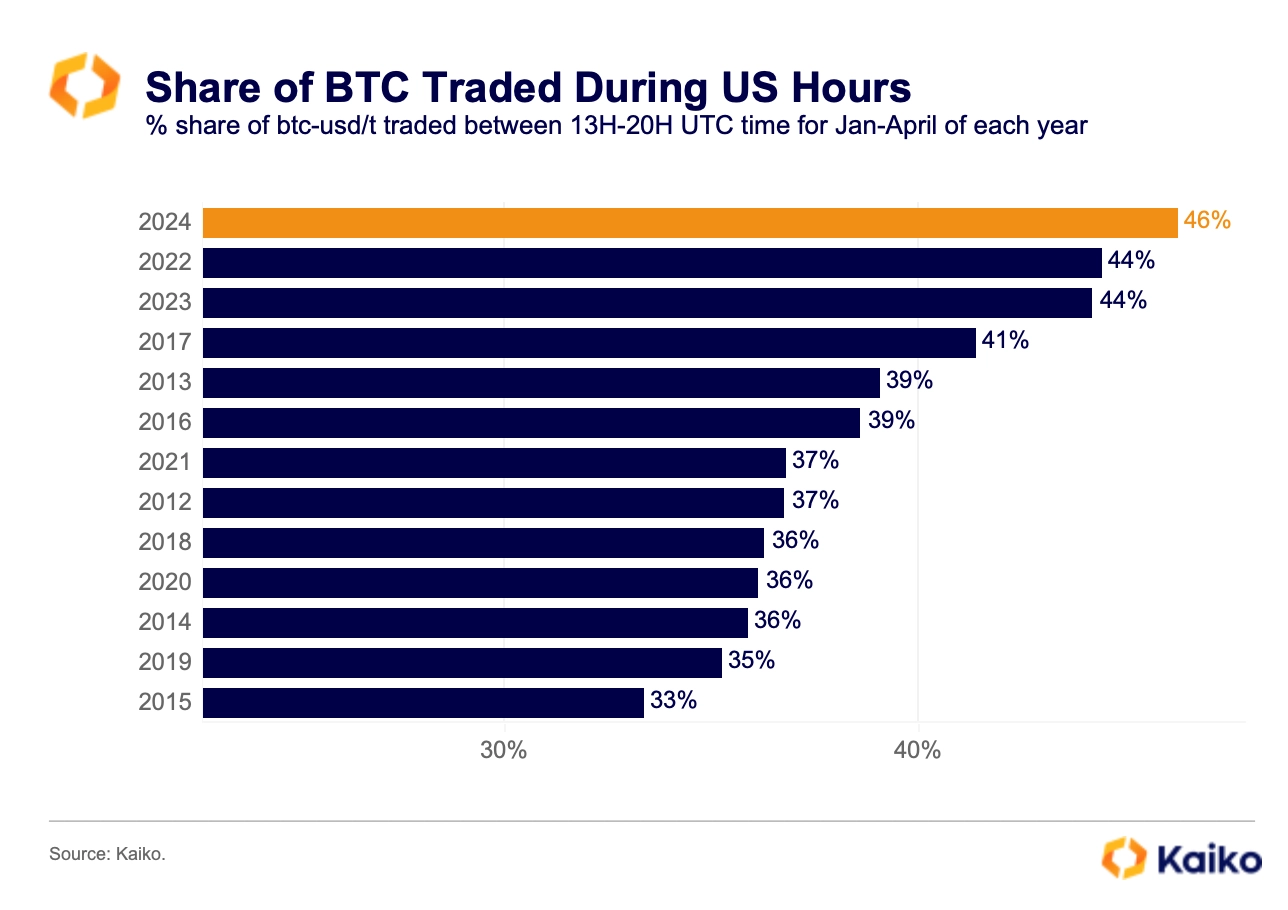
The share of Bitcoin traded during US hours (13H-20H UTC time) reached an all-time high in 2024, accounting for 46% of the cumulative volume in April. The data suggests this could be linked to the launch of the spot ETFs in January.
Looking at the breakdown by hour of day, BTC volume increased at the beginning of US hours, 14H UTC, and around the US close, 20H UTC.
The new ETFs calculate their net asset value (NAV) against dedicated benchmarks at the US close each weekday, thereby boosting arbitrage and price discovery.
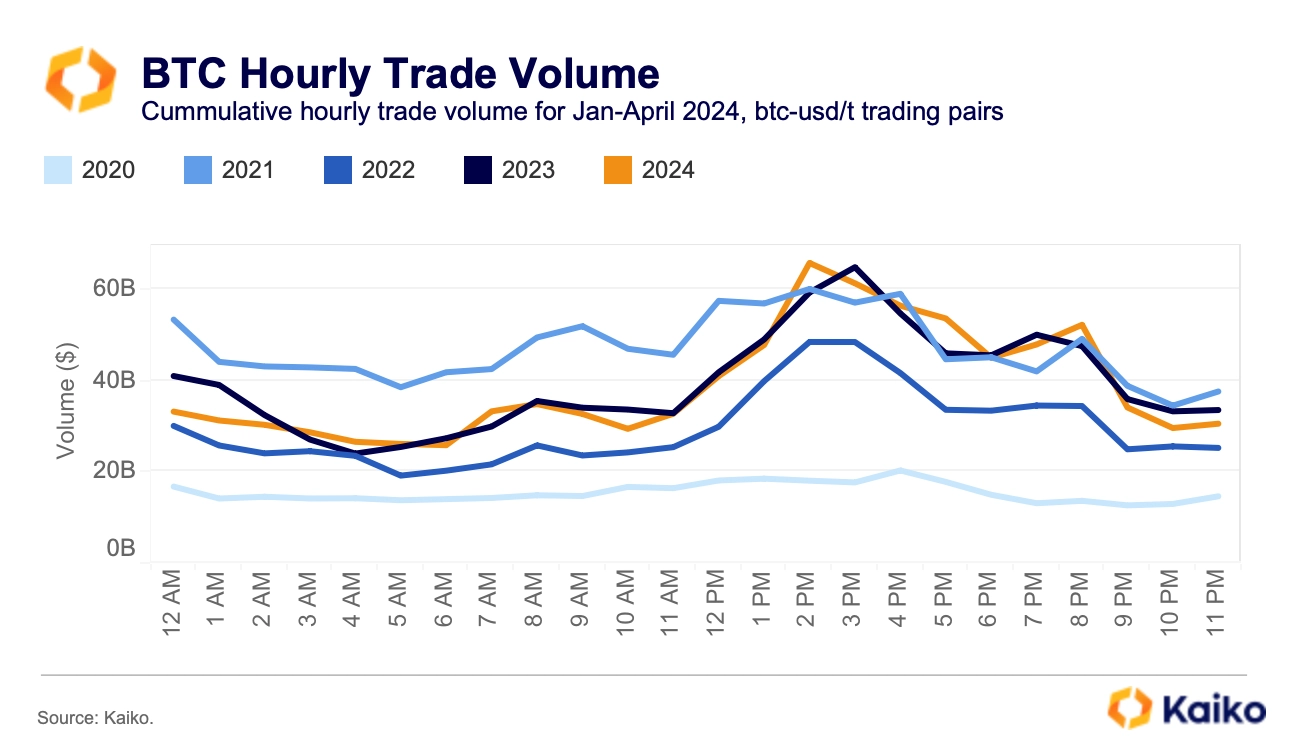
Interestingly, Thursday was the day of the week with the highest share of trading during these hours, nearing 15% of the cumulative daily volume. Overall, while BTC trade volume during US hours has mostly recovered to their 2022 levels, volume during APAC trading hours remains significantly less, suggesting this year’s rally was US-led.
Altcoin liquidity is improving.
Crypto liquidity is not only fragmented between exchanges, but also between assets, with BTC and ETH possessing the vast majority of liquidity. In 2024, Bitcoin’s average daily 1% market depth was over $270 million, which is more than ten times the daily liquidity of most top altcoins. The second most liquid crypto asset, ETH, had an average market depth of $190 million, which is still 30% less than Bitcoin’s.
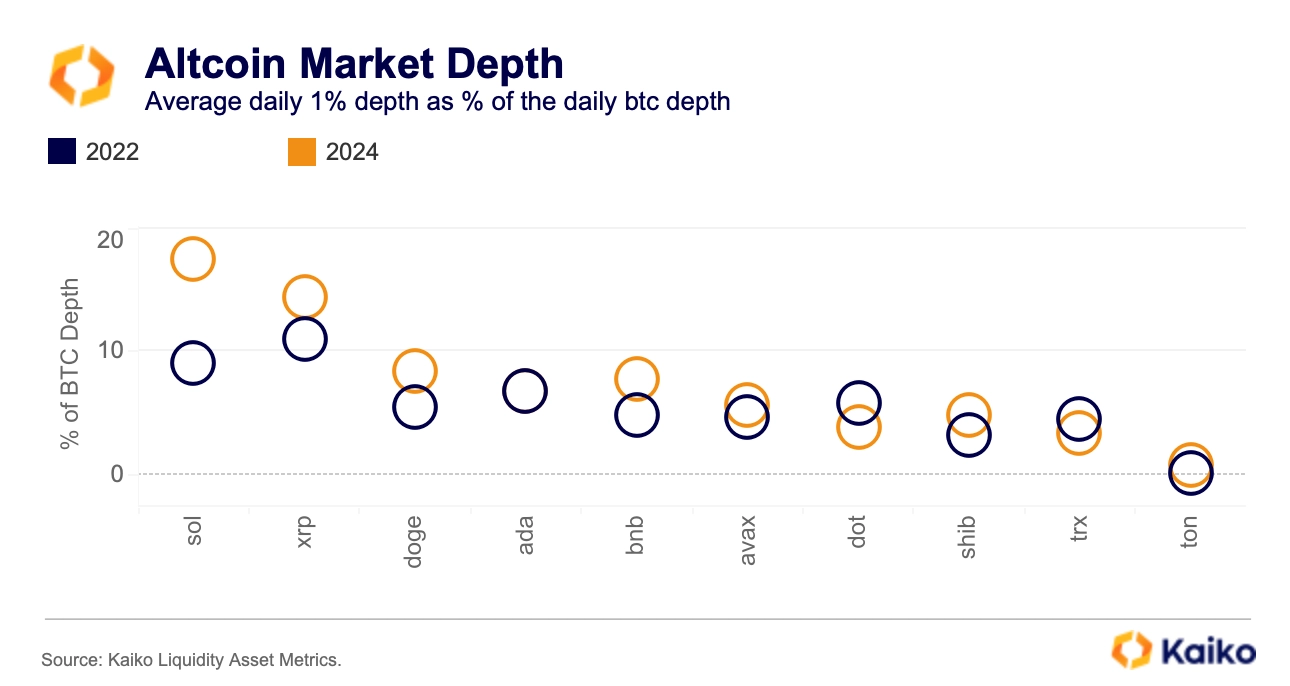
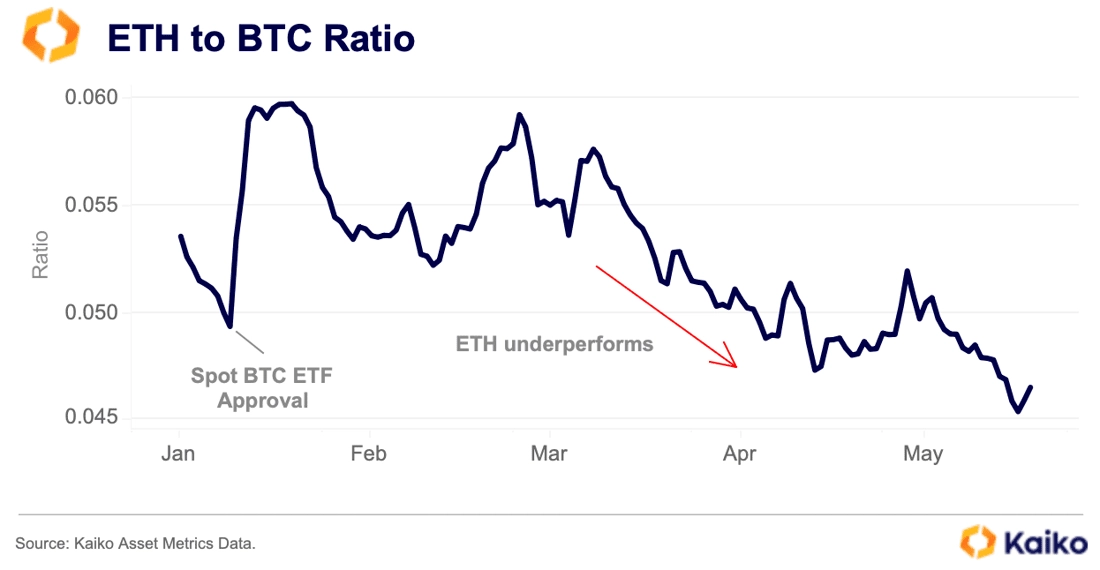
However, there is evidence that liquidity distribution is improving. Altcoin liquidity, as a percentage of Bitcoin’s daily market depth, has mostly increased over the past two years. This positive trend appears to coincide with a decline in ETH’s liquidity as a share of Bitcoin’s (not charted). As of 2024, the average ETH market depth was 72%, down from 83% in 2022.
Macro data sparks volatility.
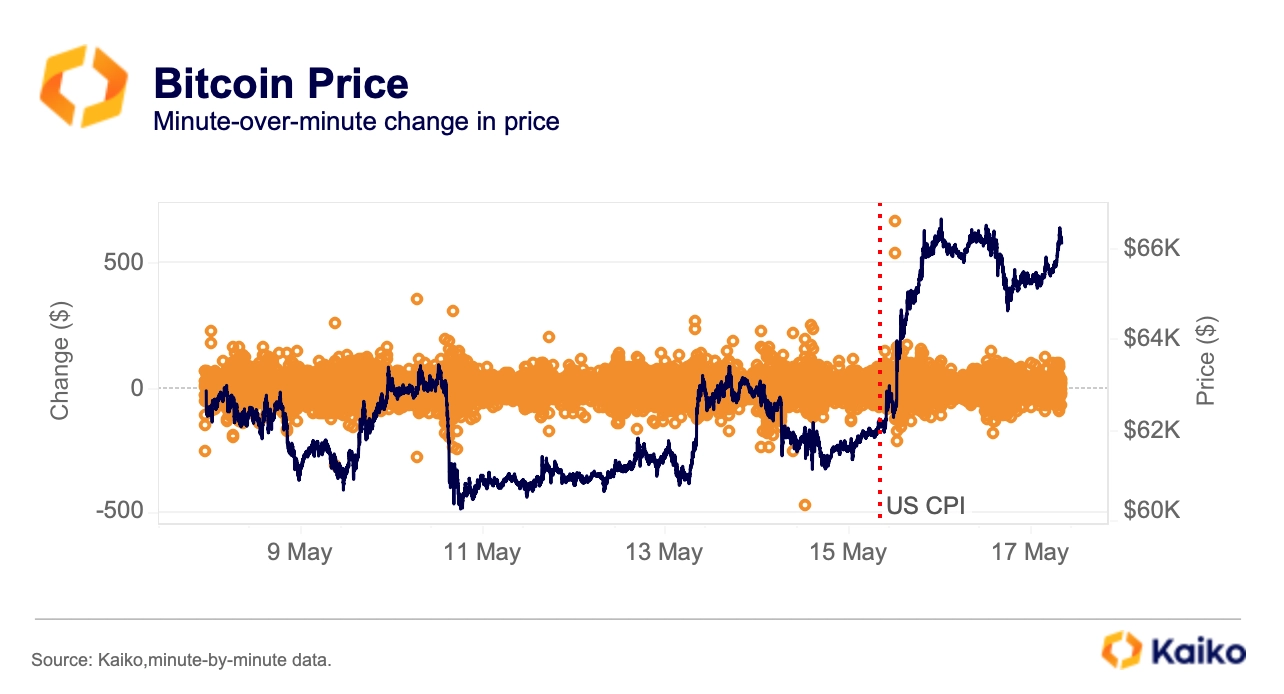
After three months of sticky price data, last week US inflation figures came within expectations, triggering a relief rally in risk assets. BTC surged by more than $600 within minutes of the data release, marking its most substantial move since April 13. The core CPI, which excludes volatile food and energy costs, rose 0.3% month-over-month marking the first slowdown in months.
As a result, markets have pushed their expectations to two rate cuts this year. Bitcoin’s 30-day historical volatility has significantly decreased since March, dropping from a multi-year high of 83% to 54%. As we transition into the typically quieter summer months, macroeconomic data could continue to be a source of volatility. Uncertainty around the US monetary policy path is rising following mixed economic data.


![]()
![]()
![]()
![]()


