Sign up for Free Kaiko Research


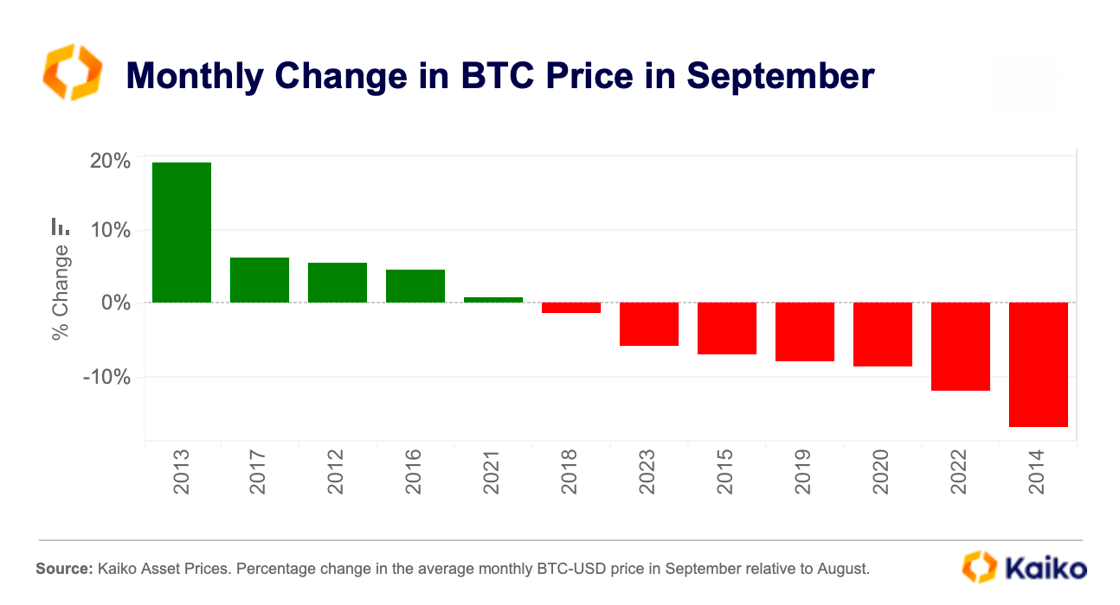
Can a US rate cut reverse the September effect?
Written by The Kaiko Research Team
09/09/2024

Welcome to the Data Debrief!
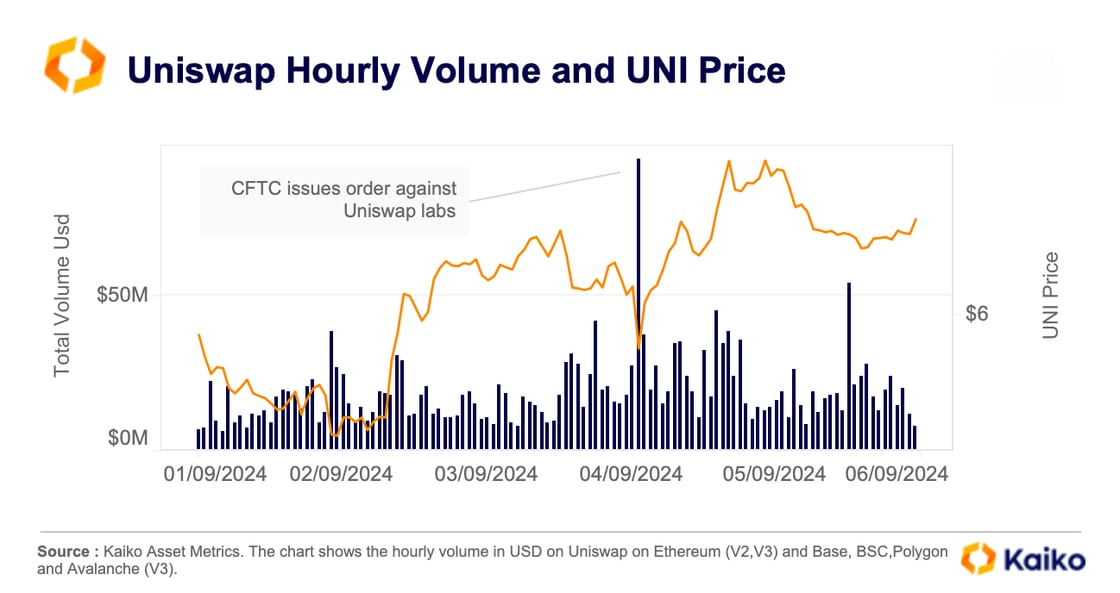
Welcome to the Data Debrief! Bitcoin’s price whipsawed following a disappointing US jobs data on Friday. In other news, Uniswap Labs settled charges from the CFTC over allegedly illegal leveraged and margined commodity trading, VanEck announced it will liquidate its ETH futures ETF, and the Fed issued a cease-and-desist order against crypto-friendly United Texas Bank. This week, we explore:
Data Used In This Analysis
Our industry-leading research is the direct result of combining our proprietary data with world-class in-house experts. Bringing the very best of Kaiko’s people and data together, we unlock the unique insights that form the basis for our discoveries and analysis. We believe in doing so, our data speaks for itself, helping both our clients and the wider industry get a better understanding of the crypto ecosystem, and the evolving trends and patterns in motion at a regional and global scale.

More From Kaiko Research
![]()
Hyperliquid
09/03/2026 Data Debrief
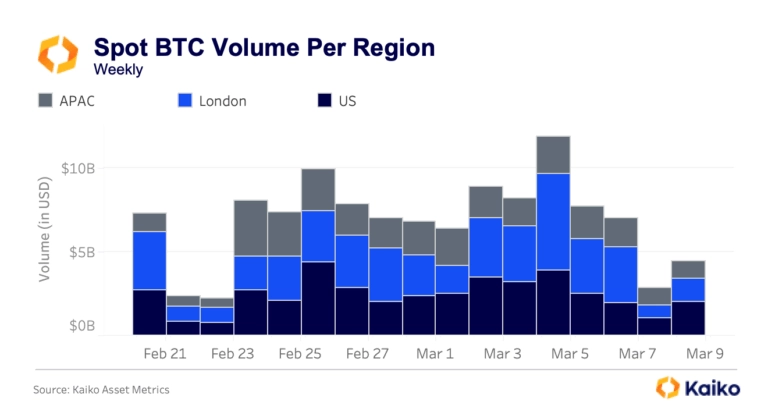
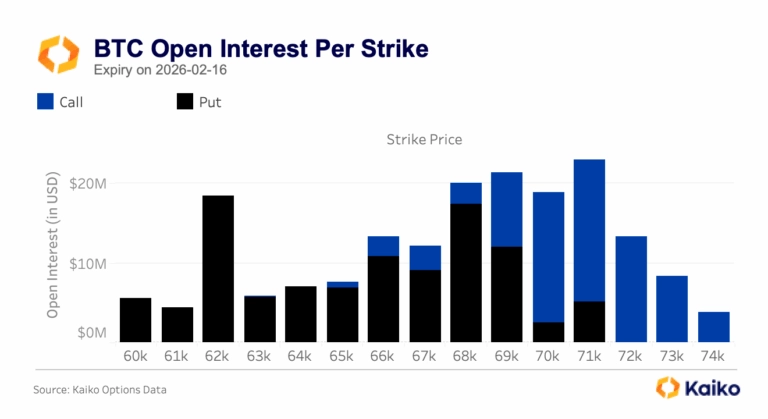
Bitcoin Ranges While Traditional Assets Find New Home on Crypto RailsAs Bitcoin ranges between $60k and $72k following the early February sell-off, the crypto market navigates competing forces, with geopolitical shocks testing 24/7 infrastructure and options markets pricing elevated volatility into the Federal Reserve’s March 18th decision.
Written by Laurens Fraussen![]()
Ethereum
02/03/2026 Data Debrief
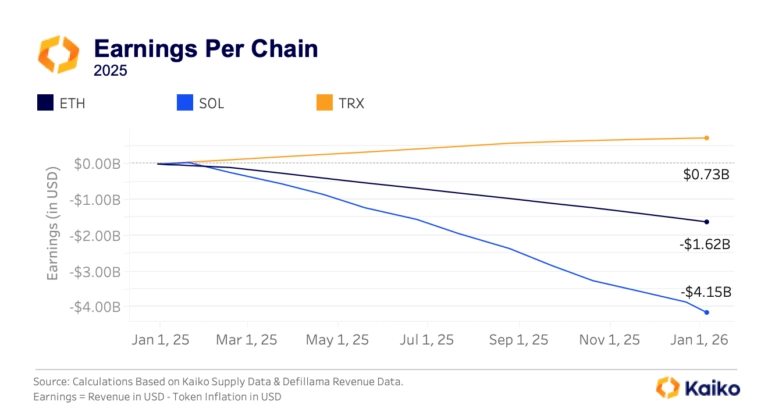
The Pressure of Dilution on Layer 1 ValuationsAs Layer 1 tokens are increasingly traded through ETFs and evaluated like equity investments, the market is discovering an uncomfortable truth, most major blockchains operate as loss-making businesses. With Ethereum posting $1.62B in annual losses and Solana bleeding $4.15B despite generating hundreds of millions in fee revenue, validator dilution costs consistently outpace income by 7-25x.
Written by Laurens Fraussen![]()
Ethereum
23/02/2026 Data Debrief
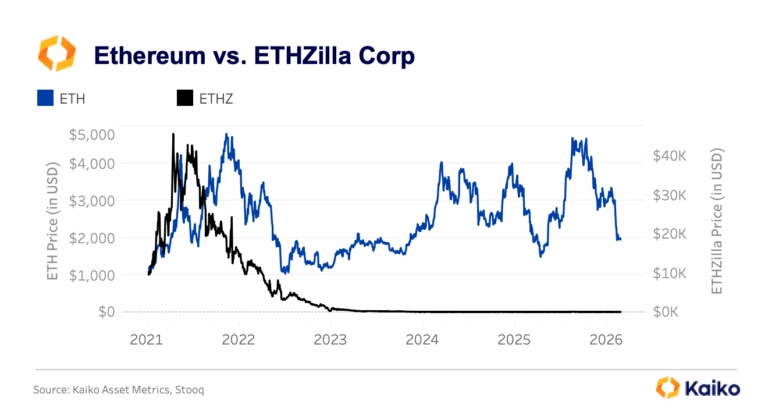
Staking Products Launch Despite Treasury FailuresAs crypto volatility continues, the markets are testing whether institutional ETH adoption follows price or infrastructure development. With ETH plunging 50% from its mid-2025 peaks to $2,000, this triggered a 95%+ collapse in equity treasury vehicles like ETHZilla and $4B in spot ETF outflows.
Written by Laurens Fraussen![]()
Prediction Markets
16/02/2026 Data Debrief
Prediction Markets Liquidity In FocusPrediction markets captured mainstream attention throughout 2025 as Polymarket processed over $2 billion in election-related volume. The post-election collapse from $1 billion to $200 million in open interest exposed fundamental questions about sustainability.
Written by Laurens Fraussen