Chart of the Week
Traders Position for Potential SOL ETF.
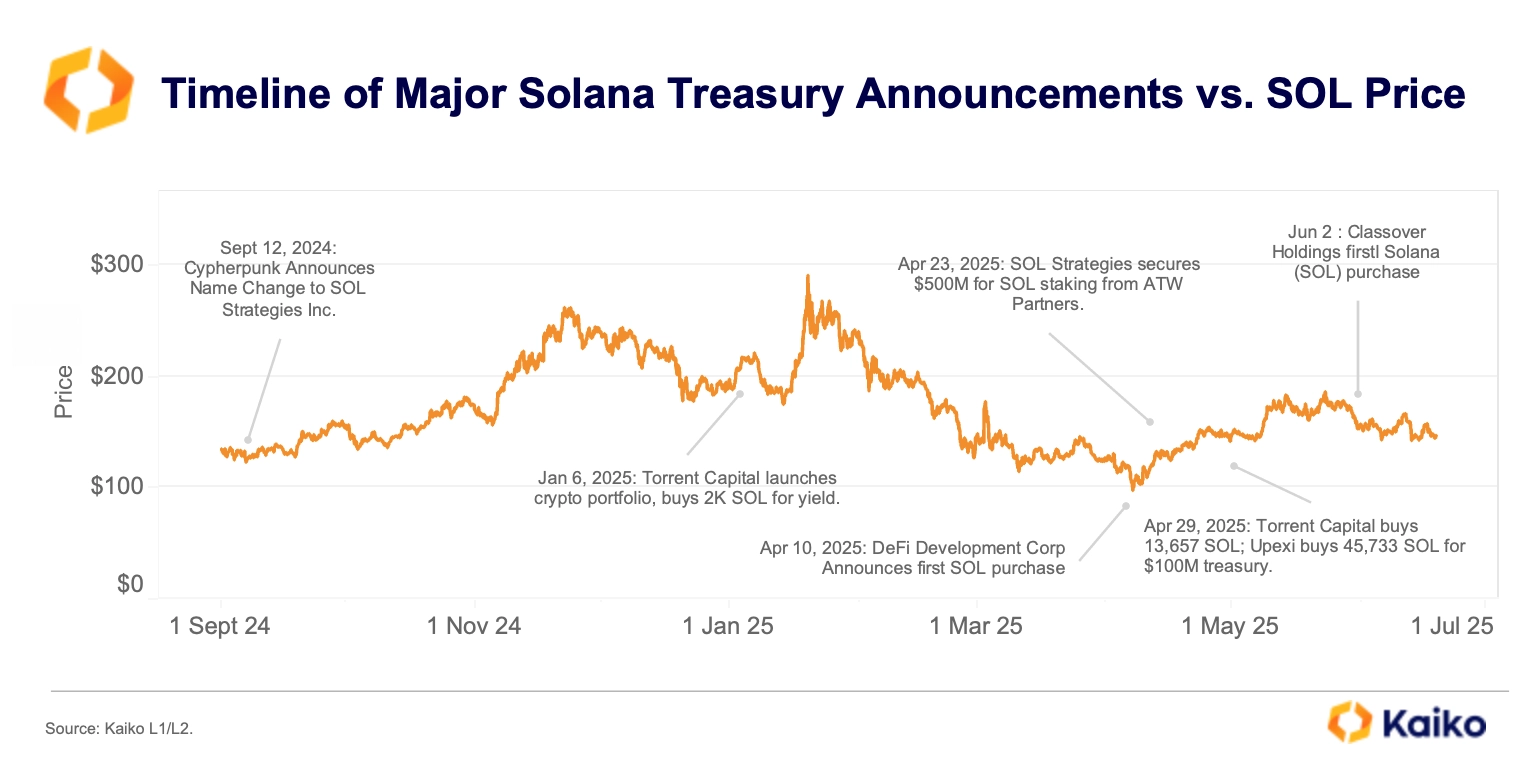
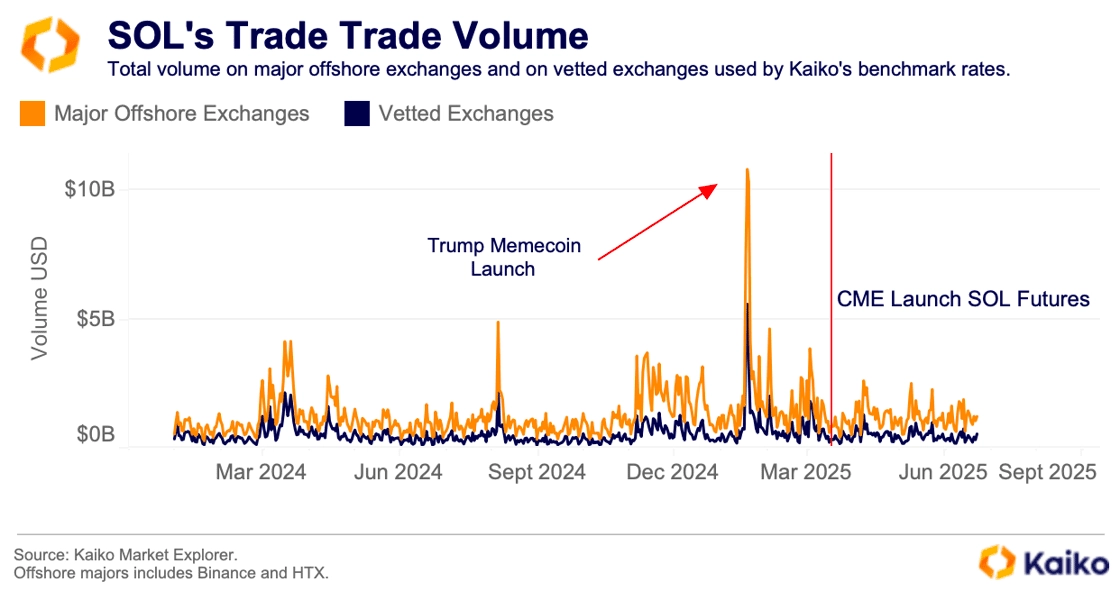
SOL began 2025 on strong footing, rallying to all-time highs in January after the U.S. President chose to launch a memecoin on the chain. However, prices have steadily declined since then.
The soft market backdrop persists despite several corporate treasury announcements, with multiple companies recently disclosing Solana allocations. Cantor Fitzgerald also issued bullish ratings on several SOL-exposed firms, citing up to 75% upside.
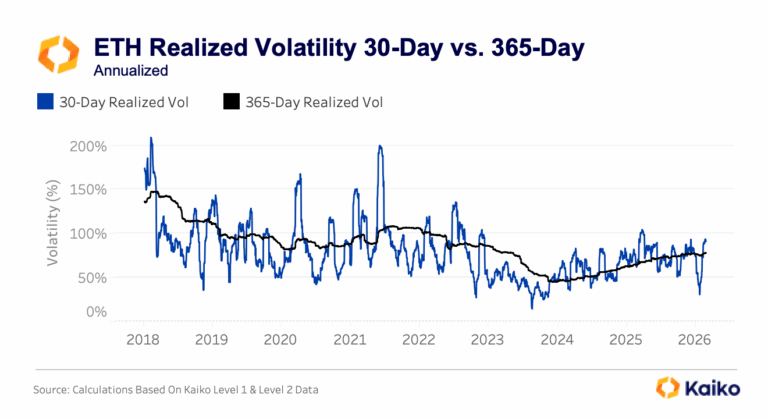
Despite signs of institutional interest, market momentum has not returned. Volatility has dropped from its April peak and selling pressure has eased, but buyers have yet to show conviction for a trend reversal.
This muted price action will be tested in the coming weeks as asset managers
work with the SEC to finalize applications for spot SOL ETFs ahead of key deadlines, according to reports.
Since news of these filings, SOL futures volume on the CME has spiked, with Friday marking the highest number of contracts traded since the exchange’s launch week.
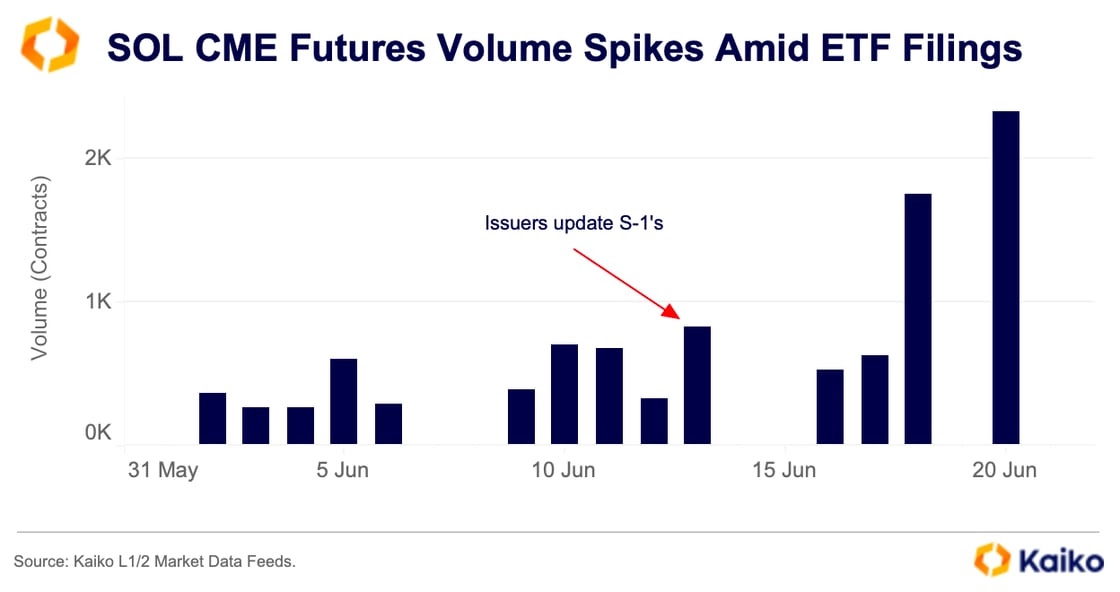
The CME has been a key venue for spot BTC ETF trading and, to a lesser extent, spot ETH trading. Traders take advantage of the price difference between spot and futures by shorting futures while holding spot, collecting the basis as expiration approaches. While this trade isn’t as easily available for SOL yet, the increased volume likely reflects positioning ahead of a potential spot ETF approval in the coming weeks or months.
However, part of the recent volume increase may also be due to traders rolling positions ahead of Friday’s monthly expiration.
Spot trading volumes on centralized crypto exchanges remain subdued as retail interest has slowed since Q1. Corporate purchases have had little impact on SOL’s retail traders, who tend to respond more to non-institutional signals. For example, SOL reached record highs and year-to-date volumes after President Trump launched his memecoin on Solana.
These meme-driven signals matter more to retail traders, but that’s not to say institutions are ignoring the shift, as evidenced by CME volumes.
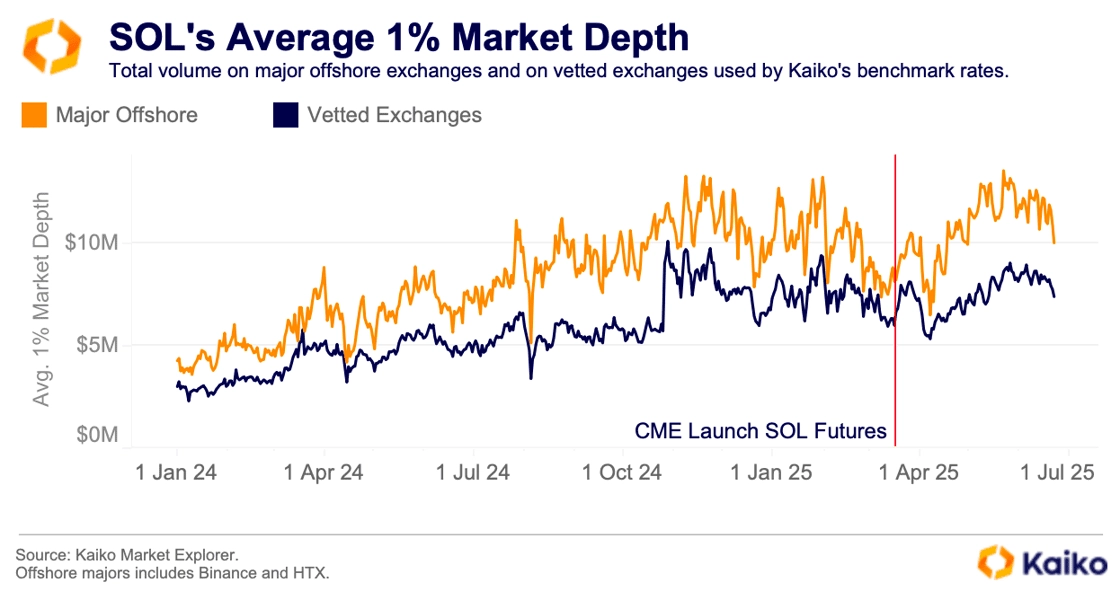
In fact, a closer look at SOL’s liquidity profile shows healthy and improving order books across exchanges. The average 1% market depth, which sums buy and sell orders within 1% of the mid-price, has been steadily increasing since March. This increased liquidity may suggest that more market makers are active.
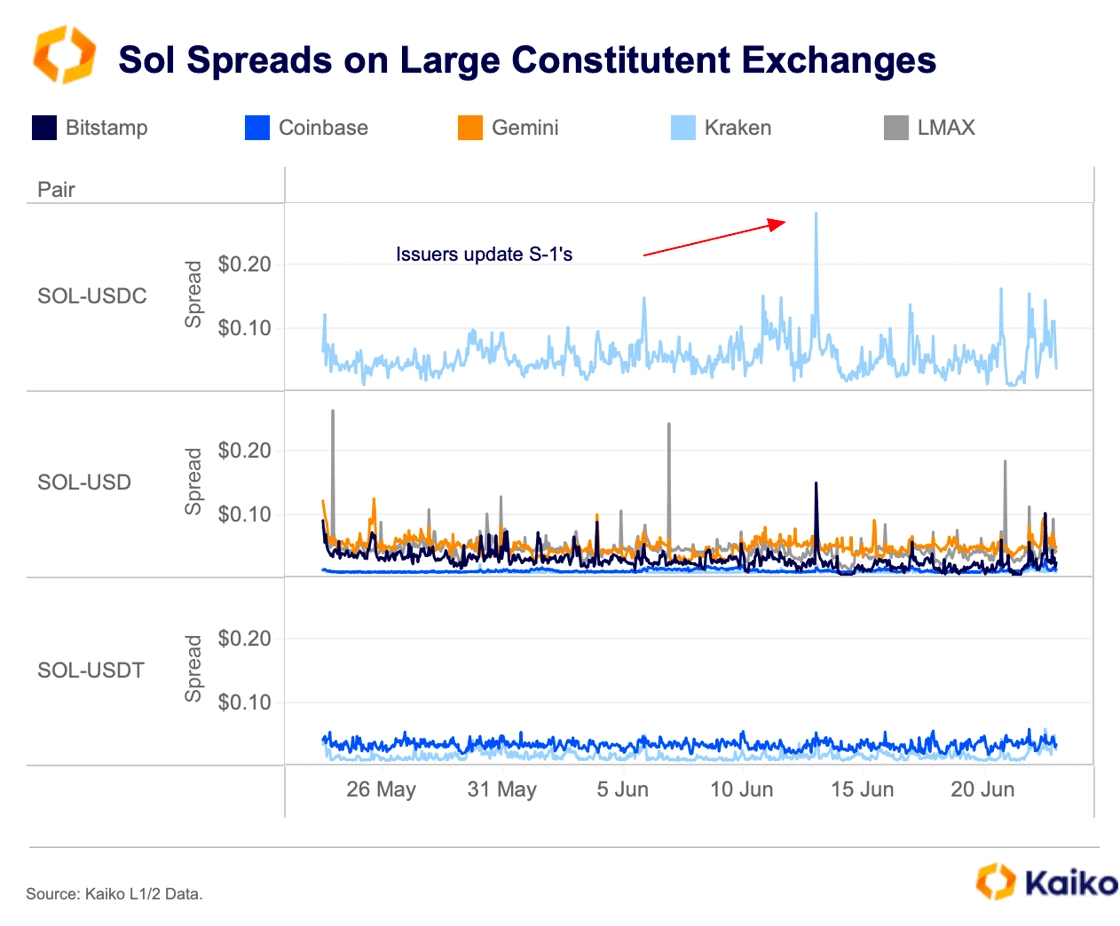
That increasing liquidity trend is also evident when looking at spreads for SOL pairs on most exchanges. The average spread for the SOL-USD pair has more than halved since the start of the year, with the decline accelerating after CME futures launched. This signals greater institutional interest and less retail-driven speculation, as retail traders tend to be less price sensitive.
Spreads have remained consistent over the past month, with only a few brief deviations. The largest occurred on June 13, when issuers re-filed, impacting Kraken’s SOL-USDC pair more than any other. While the spike on Kraken on coincides with the ETF news, there wasn’t a corresponding increase in trade volume or liquidity. This suggests that spreads widened due to traders repositioning based on the news and outlook on approval shifting.
Another consideration for these ETFs is the availability of SOL-USD pairs. Currently, there are 15 direct SOL-USD spot markets, compared to 20 for ETH and BTC, but SOL has greater coverage than other altcoins seeking spot ETF approval. Exchanges without a USD pair for an asset cannot be included in regulated benchmarks, which are used to calculate an ETF’s daily NAV.
The presence of these pairs, along with existing CME futures, strengthens the case for ETF approval. Additionally, the Commission’s engagement with issuers mirrors the BTC and ETH approval processes, further supporting this trend. As a result, it is unsurprising to see market structure changes as institutions prepare for potential SOL ETFs in the US.
What is surprising is the lack of retail-driven speculation in the market at present. Even bettors on Polymarket have shown little interest in speculating on the approval. A market asking if SOL ETFs will be approved by July 31 has seen just $320k in volume, with the “yes” bid currently at 53 cents.
The lack of retail speculation may reflect a belief that these ETFs will not drive significant price action. However, this should not discourage Polymarket bettors. Perhaps ETFs are simply less interesting to retail traders now.
BTC’s response to geopolitical jitters.
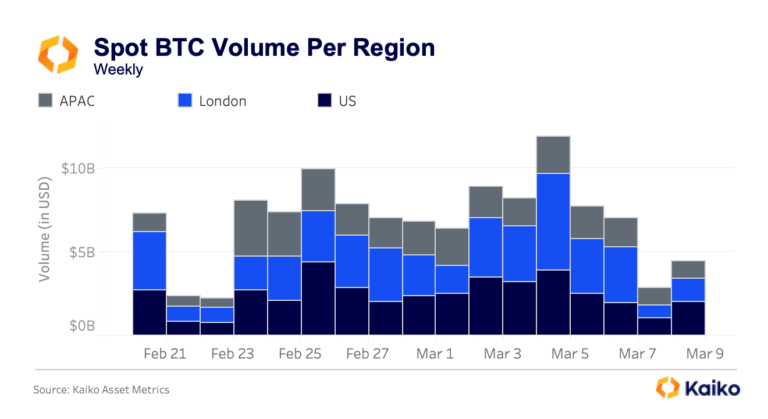
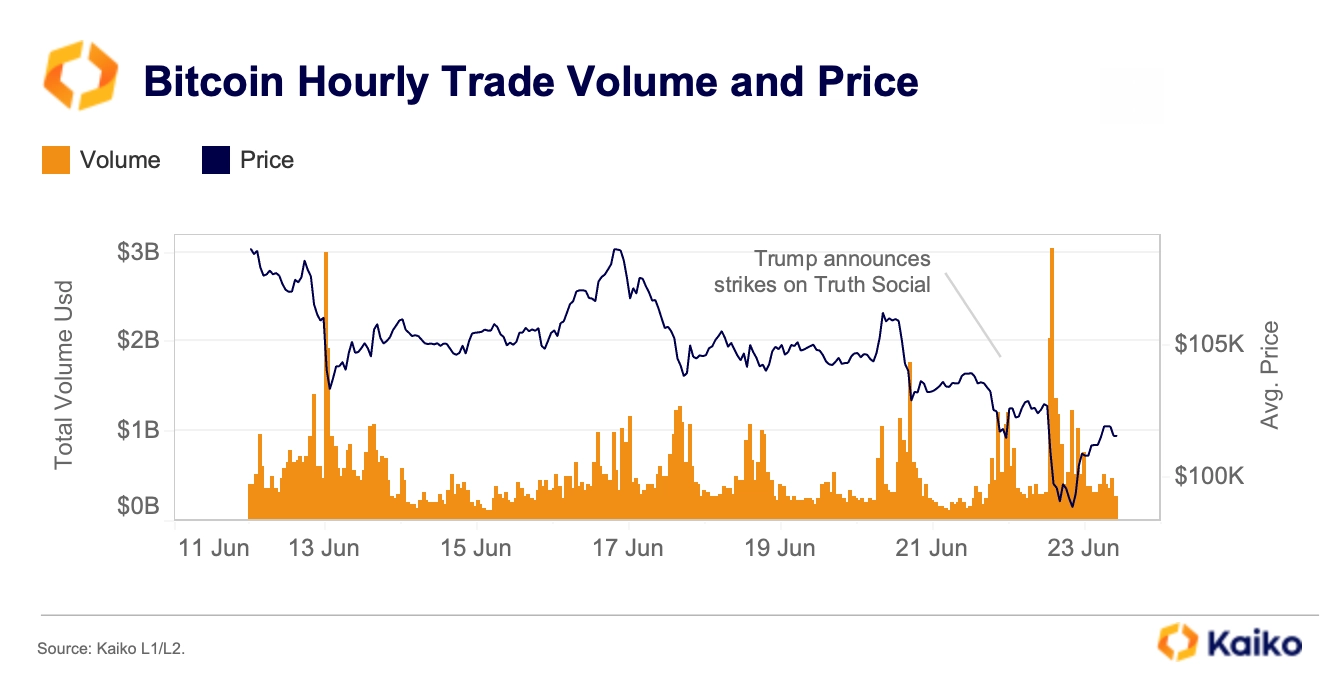
Although crypto trades around the clock, prices showed little reaction to the weekend’s tense headlines about a US attack on Iranian nuclear sites until Sunday evening, when US futures markets opened. At that point, crypto prices reacted sharply, and hourly BTC spot volumes jumped to $3 billion at the market open, marking a monthly high. Still, the response was relatively muted compared to past events, such as the $10 billion in volume seen during the January 20 Trump inauguration.
Despite the initial sell-off, prices quickly rebounded and have stabilized around $101K at the time of writing. Traditional markets followed a similar pattern, with equities recovering most losses by Monday morning.
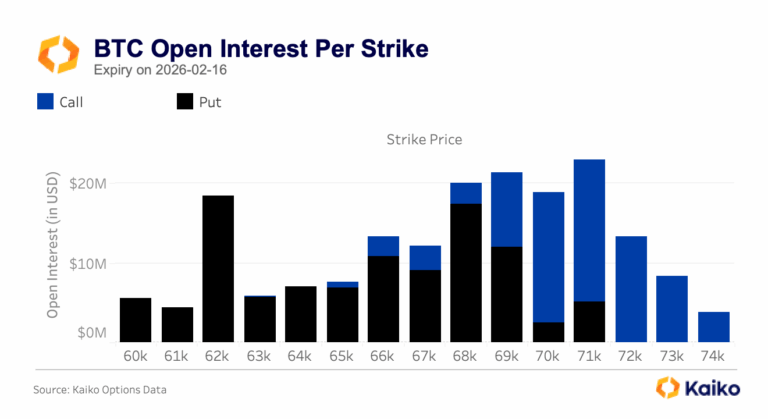
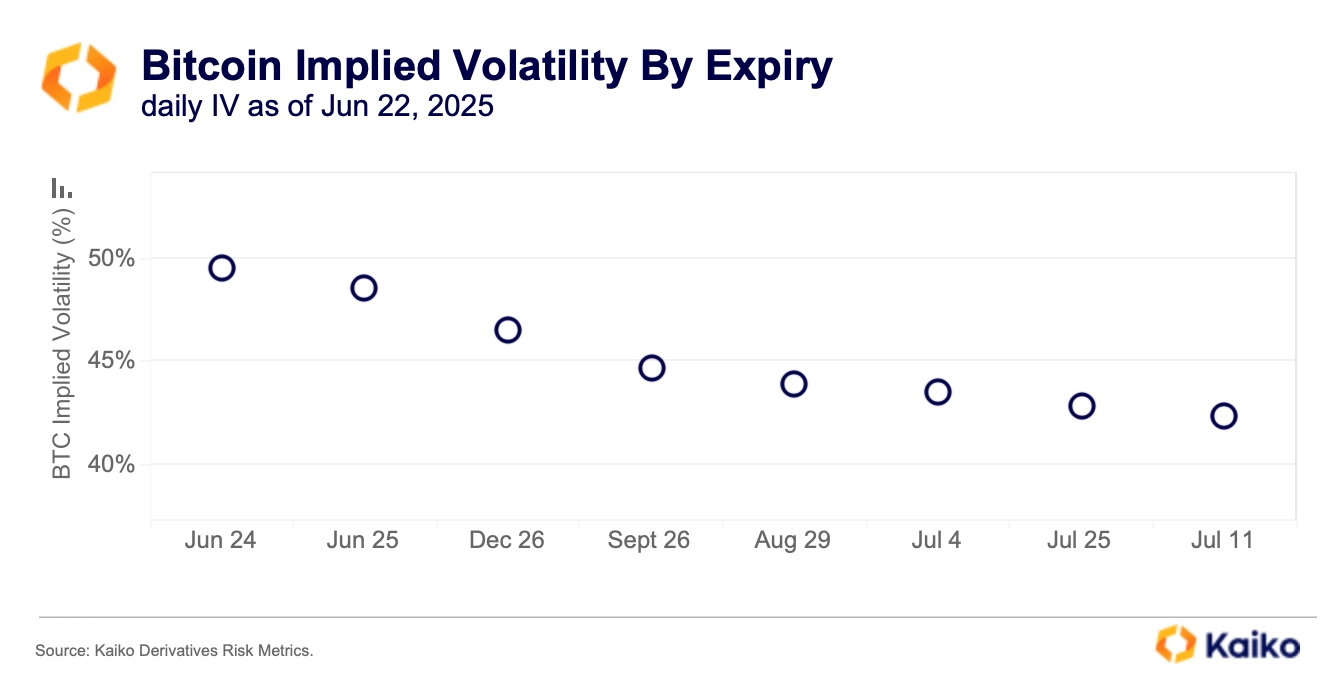
Yet, the derivatives market paints a more cautious picture. On June 22, implied volatility (IV) spiked, with short-term options expiries overtaking longer-term ones, typically a sign traders are bracing for near-term turbulence.
This likely also highlights demand for short-term protection, as the rapid price move over the weekend drove up demand for short-dated puts or calls.
LATAM defies global uncertainty.
Latin America rebounded this year, with monthly trading for top fiat pairs like BRL, ARS, MXN, and COP averaging over $3 billion in 2025, levels not seen since the 2021 bull run. Crypto adoption in the region is driven by rising institutional interest and ongoing demand for alternatives amid fiscal strain and inflation.
Despite a global slowdown in early 2025, LATAM posted its second-best year on record, with $16.2 billion in volume between January and May, up 42% from 2024 and nearly double 2022.
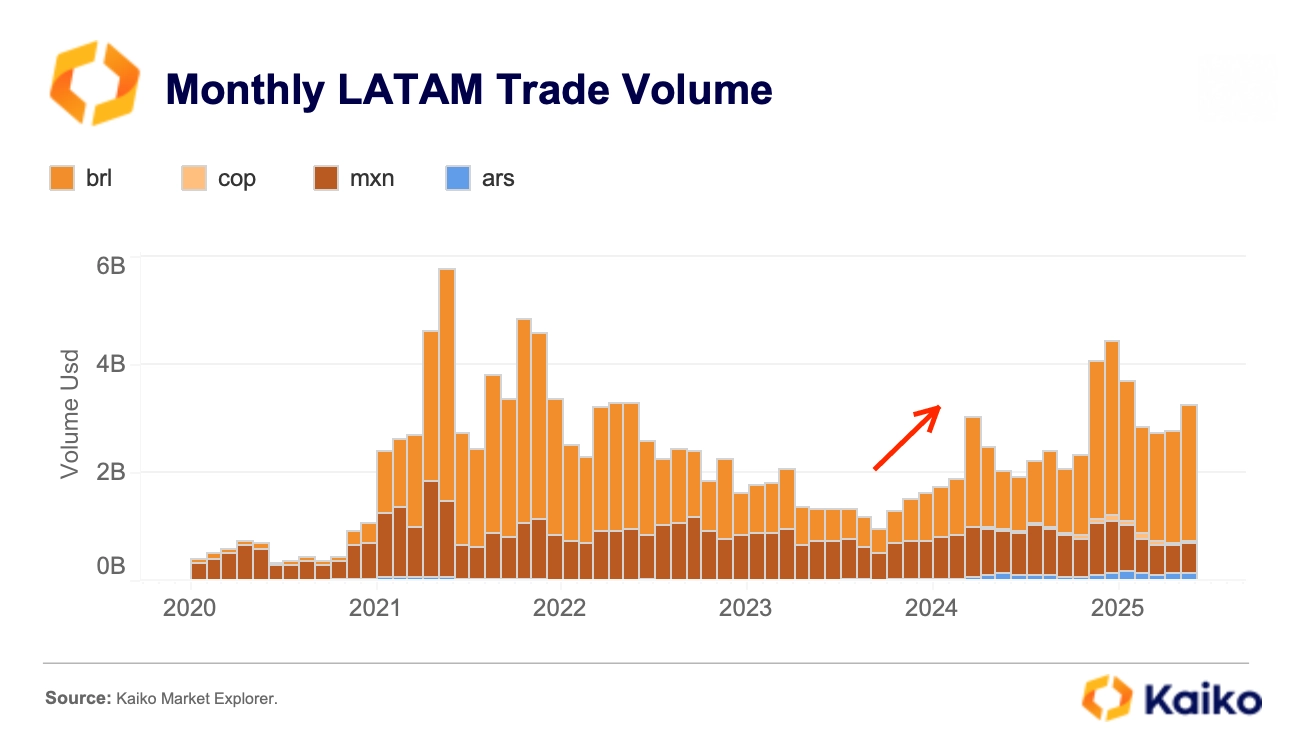
Brazil has led this growth, driven by robust institutional demand. However, Mexico has diverged from this trend. Bitso, the leading exchange for MXN-denominated trades, saw volumes stagnate in 2024 and decline by 27% to $607 million monthly in 2025.
What’s behind the MXN slowdown?
Bitso’s trading mix has shifted significantly, stablecoins have overtaken XRP as the top traded asset. This follows a decline in institutional demand for Ripple’s On-Demand Liquidity (ODL) product after the 2023 U.S. banking crisis.
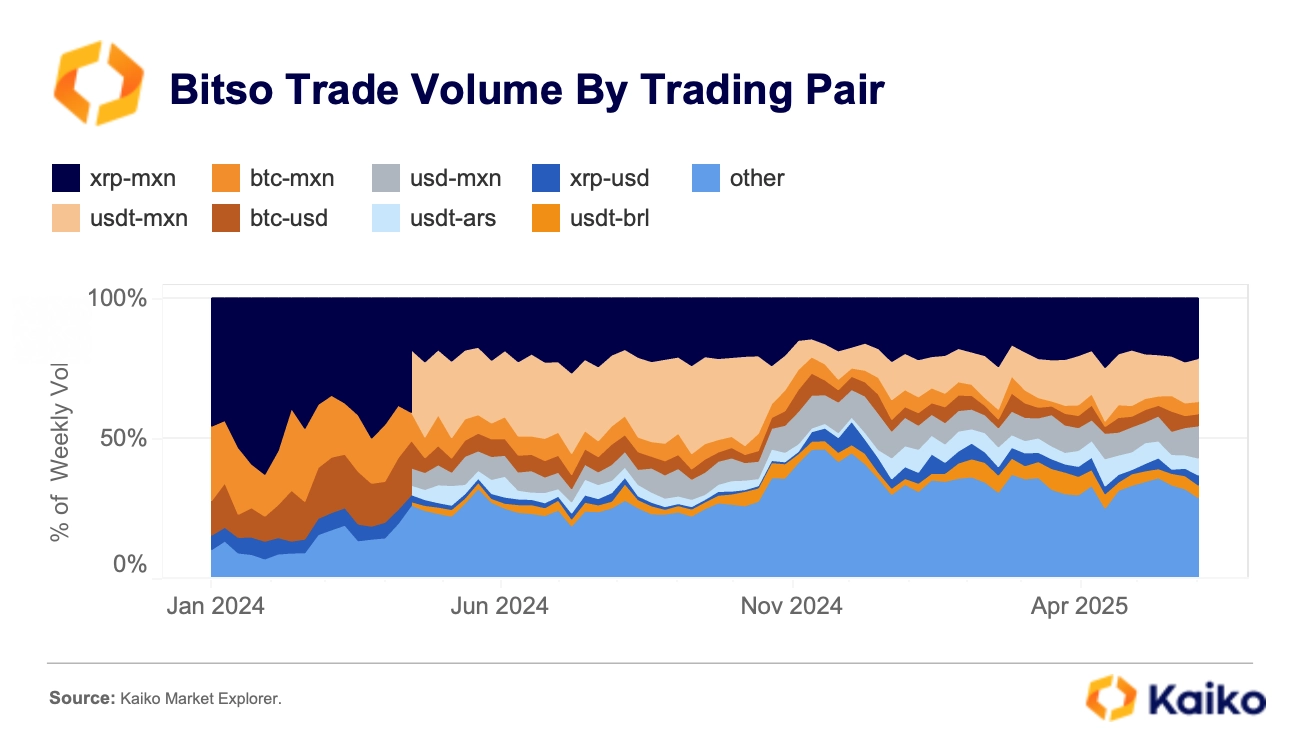
Liquidity issues during the 2023 U.S. banking crisis disrupted key ODL corridors and exchanges like Bitso, forcing institutional clients to pause ODL and revert to fiat prefunding. Ripple’s pivot to direct bank partners further diminished exchanges’ roles, while the April 2024 launch of USDT-MXN only partly offset falling XRP volumes, reflecting stablecoin competition.
Read more LATAM insights in our latest report.
Summer liquidity trends.
Summer is typically a quiet period for both crypto and traditional markets as traders step back. Yet this year, crypto isn’t short on potential catalysts, from the anticipated passage of the Genius Act before the U.S. Congress recess to the possible approval of SOL ETFs. However, if market liquidity dries up, these events could spark volatility rather than sustained momentum.
As of last week, 0.1% altcoin depth (covering 90+ tokens in Kaiko’s investable universe) stood near multi-year highs at $36 million. Kraken (40%), Coinbase (19%), and Crypto.com (14%) were the most liquid venues for altcoins. Notably, Gemini has gained ground since March, with its market share rising from 2% to 6%.
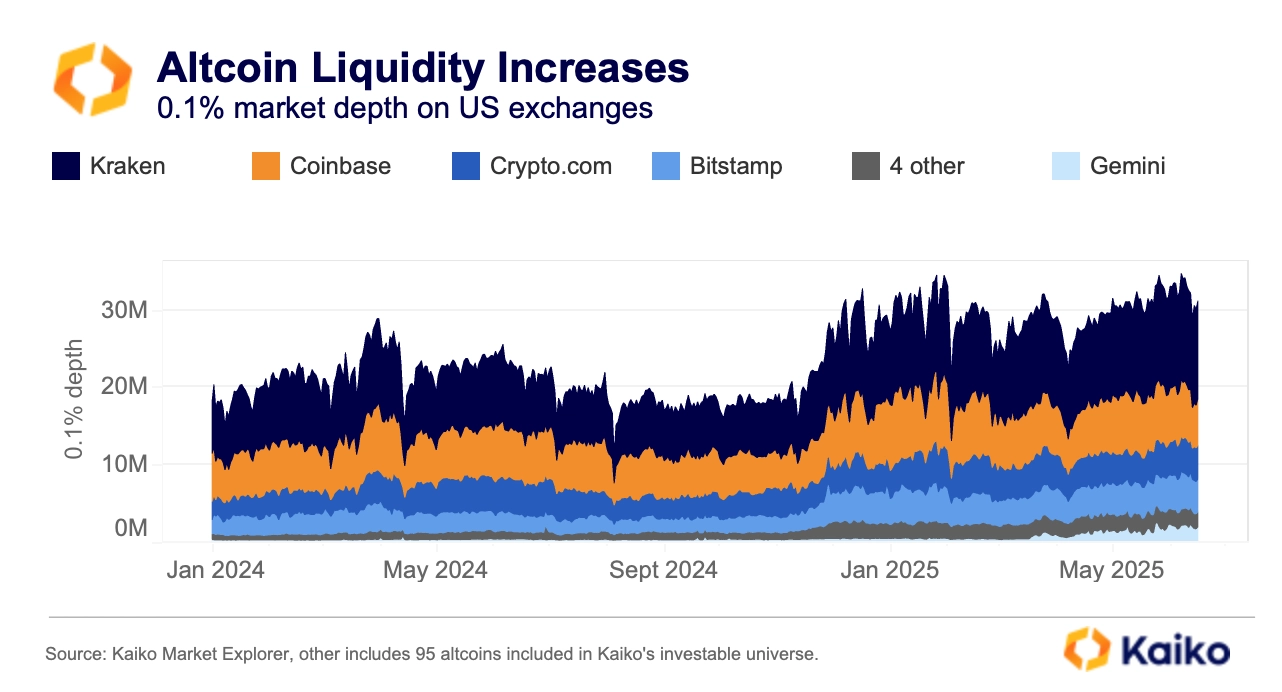
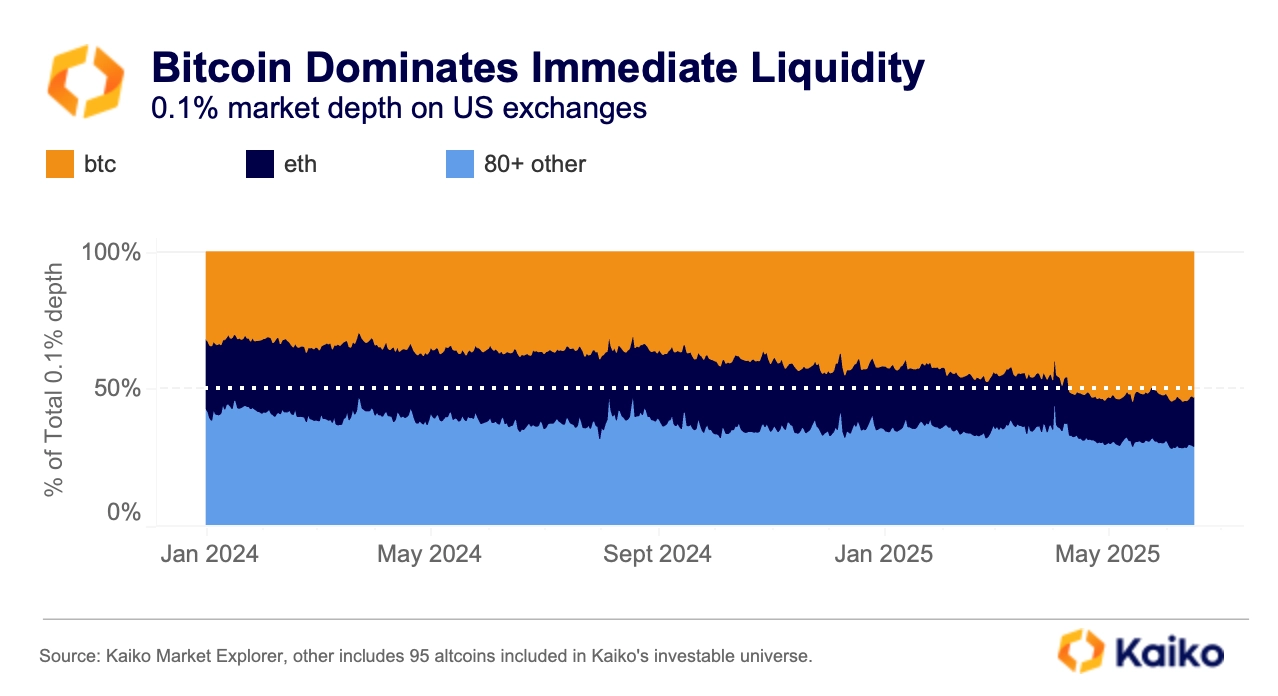
However, relative to Bitcoin, altcoin liquidity has declined in volume share. BTC’s 0.1% depth now accounts for over 50% of total immediate liquidity, which is especially relevant for retail traders and small order execution. This reflects a broader trend of liquidity concentration, as altcoin markets remain fragmented and sensitive to macro shifts.