Join us for our latest webinar in collaboration with Cboe

BLUR’s Big Debut

Welcome to the Data Debrief!
Crypto markets continued to soar despite another week packed with regulatory punches. Last week, the SEC formally charged Terra founder Do Kwon, alleging a “multi-billion dollar fraud” against investors in the UST stablecoin and LUNA.
-
Huobi lists a token representing a claim on FTX’s debt
-
Coinbase trade volume is outpacing Uniswap’s
-
Silvergate share price collapses amid the FTX fallout
Trend of the Week
Anatomy of a token launch: BLUR’s big debut.
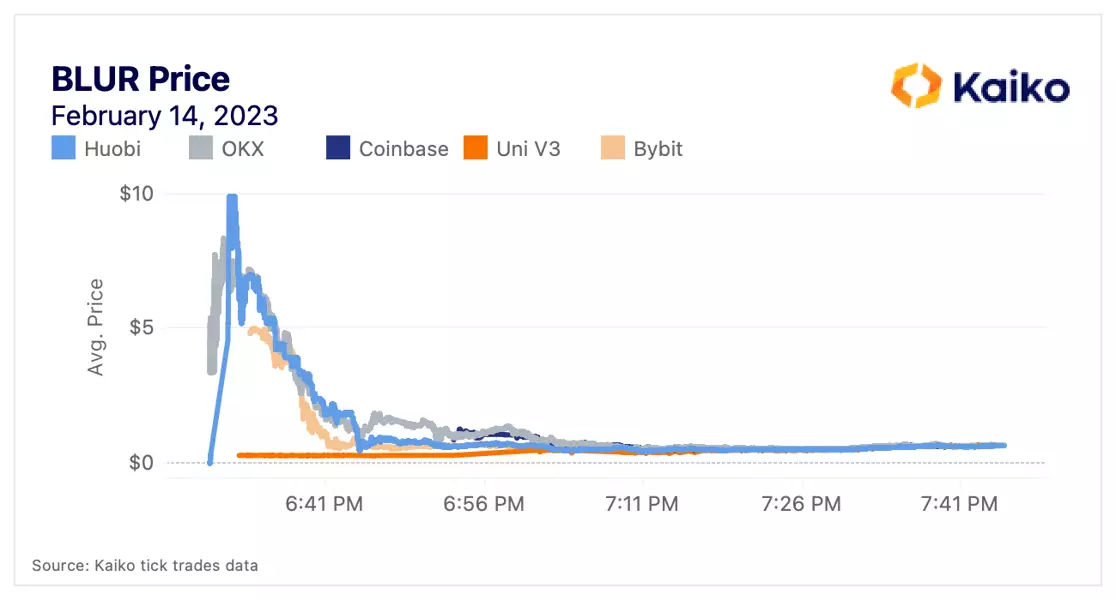
Trading of BLUR — the token associated with Blur, the NFT aggregator that has captured significant NFT volumes — commenced on February 14 at 6:30pm UTC, with the very first trade executed on Huobi at a price of $0.01. Despite the crypto market maturing, there are still arbitrage opportunities, especially immediately after a highly anticipated launch like BLUR.
Prices on Huobi and OKX, the first exchanges to begin trading, quickly surged above $8, with Huobi nearly hitting $10. Trading on the Uniswap V3 BLUR-USDC pair began at 6:33pm UTC at a price of $0.29. Coinbase entered the fray at 6:53pm at a price of $0.88. Prices did not fully converge until 7:30pm UTC, a full hour after trading began.
Notably, Binance has not yet opened BLUR trading, and as a result OKX has dominated CEX market share. When viewing hourly market share, it becomes clear that Coinbase and OKX are serving different markets. Coinbase’s market share has consistently surged more than 10% at 7pm UTC (2pm EST), the middle of U.S. trading hours. During these times, OKX’s market share has dipped as low as 35% while Kucoin’s, the second largest by volume, has remained more stable. It’s unclear if and when Binance will list BLUR, though it is likely that the exchange will quickly capture more than 50% of volumes, primarily siphoning from OKX, its top international competitor.

Meanwhile, market depth within 1% of the mid price grew steadily from February 14 to February 19. OKX began with the most liquidity, suggesting that market makers correctly anticipated that the majority of volume would go to the exchange. OKX’s average 1% market depth on the day after listing was over $315k, almost double Coinbase’s $185k. However, Coinbase’s has since surged to $450k while OKX stands at $300k, roughly equal to Bybit and Huobi, suggesting the same market maker(s) may be operating on these exchanges. As of this writing, OKX’s USDT pair has the lowest spread at just 13.5bps compared to 23bps on Coinbase.

Never miss an analysis.
Subscribe to our free weekly Data Debrief email, or learn more about our premium research subscriptions here.
Price
Markets brace for regulatory impact.

Crypto markets continued to soar despite another week packed with regulatory punches. Last Thursday, the SEC formally charged Terra founder Do Kwon, alleging a “multi-billion dollar fraud” against investors in the UST stablecoin and LUNA. The SEC also proposed new custody rules that would make it harder for investment firms to work with crypto companies. On a brighter note, Layer 2 networks Polygon and zkSync each announced a launch date for their competing zero-knowledge solutions.
Binance’s BNB underperforms in February.

Binance’s BNB token has underperformed the broad market in February as the Paxos-BUSD situation continues to weigh on the exchange, which experienced massive outflows last week. The BNB to BTC price ratio, which measures the relative performance of the two tokens, fell to its lowest level since August 2022. BNB holders benefit from lower transaction fees, can vote on new coin listings, and earn passive staking rewards, but the token can also be interpreted as a proxy of the exchange’s performance. BNB had mostly outperformed BTC until November 2022, when the ratio started trending downwards as sentiment deteriorated following the collapse of FTX.
Huobi lists token representing claim on FTX debt.

On February 6, Huobi listed a FUD token, designed to represent a claim on the debt of FTX. The debt is supposedly held by a DAO, and Justin Sun has tweeted his attestation of the debt and hinted it is in the tens of millions. The DAO released 20mn tokens at a discount of $1 per token, while Huobi claimed fair value was between $1 and $5, hinting at between $20mn-$100mn in debt. If the debt is greater than $20mn, the DAO will airdrop the remaining FUD to holders. Market speculation on this amount seems to have taken over as FUD is now trading at $13, down from as high as $100 dollars on listing. It’s not clear why the token is trading so high, particularly after guidance from Huobi on the fair value of the token. The listing has come under fire from investors for closely resembling a security, as well as the fact the DAO has yet to offer any proof that they hold any claim to FTX debt.
Liquidity
Coinbase trade volume increasingly outpacing Uniswap’s.

In the aftermath of FTX’s collapse, a prominent narrative emerged that retail investors would migrate towards decentralized exchanges, especially amid growing regulatory uncertainty. Yet, Coinbase, who many feared might be next in line for a SEC crackdown, has had persistently higher volumes than Uniswap this month and since the start of the year. Cumulative volumes so far this year for Coinbase have reached over $185bn, compared to just over $93bn for Uniswap.
Last year we reported on Uniswap trade volumes consistently equalling Coinbase’s. That trend appears to have been temporary, with Coinbase reaffirming its position as a top exchange in trading volume.
The Coinbase/Uniswap indicator seems to be one of the best metrics for tracking trader preferences, and it will be interesting to keep an eye on it amid the latest round of centralized exchange fears.
SAND token endures sell pressure after unlock.

In a recent Deep Dive we took a look at investor behavior around token unlocks and in our examples we found that the higher the percentage allocation towards early investors, the more sell pressure the token endures. We used SAND’s unlock last August as an example, and the recent unlock on February 14 appears to have been no different.
As was the case in August, 12% of the total supply of SAND was unlocked last week, with about 50% of that allocation going to investors — a relatively high amount compared to other unlocks. In the day or two following the unlock we observed several large sell orders of SAND for its most liquid USDT pairs: On February 15 55% of those orders were sells, equating to an extra $7mn of sell pressure on the USDT pair alone. However, in terms of price action, SAND moved largely in line with ETH after the unlock, and has gone on to outperform by a staggering 18% in the last 24 hours.
BUSD liquidity worsening versus USDT on Binance.

Last week was a pivotal moment in the stablecoin space as Paxos halted BUSD mints. Liquidity on Binance has undergone some radical shifts since the announcement as market makers are becoming more reluctant to offer liquidity on some of the biggest BUSD pairs.
Compared to February 1st, 1% market depth for the top 8 BUSD pairs by market cap is down 31%, compared to a decline of only 1% for the same USDT pairs. A reduction in liquidity for BUSD pairs is expected, however what remains to be seen is if the missing liquidity will move to Tether pairs, disappear completely, or move to another stablecoin pair. Worsening BUSD liquidity can also be seen in spreads on Binance.

Spreads on Binance have been volatile this month for both BUSD and USDT pairs, however we seem to be observing a new norm in liquidity differences between the two stablecoins on Binance. As we can see at the start of the month, the difference between the two spreads was minimal.
However, since the Paxos announcement, the difference between BUSD and USDT spreads has increased, even as the nominal spread figure has decreased in the last few days. As liquidity has worsened disproportionately between the two, BUSD spreads have been harder hit and now look to be persistently wider than the same USDT pairs .
The Alameda Gap persists.
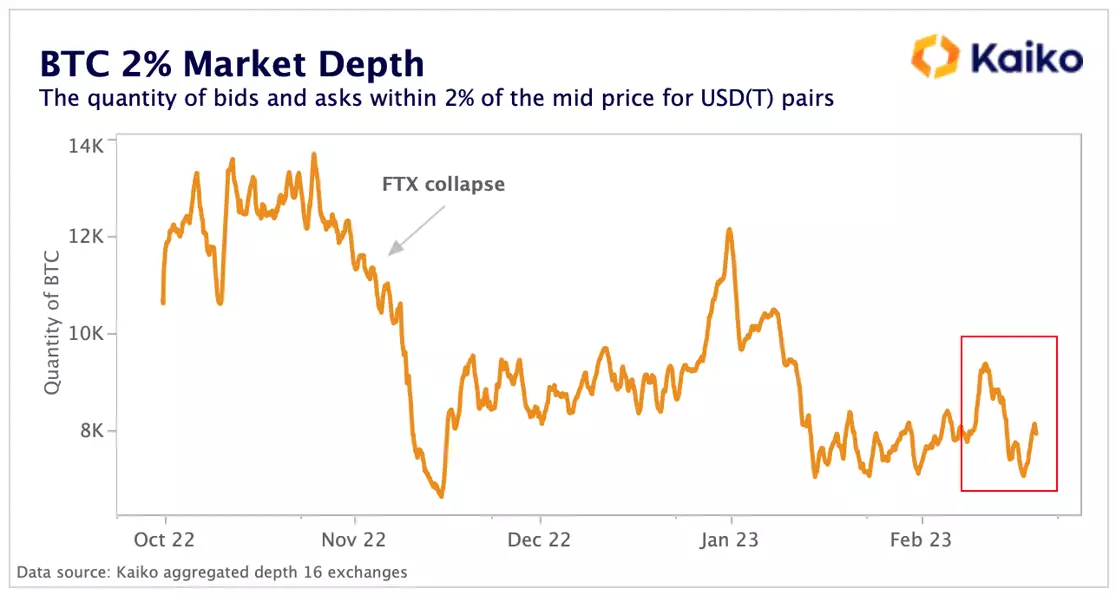
The liquidity gap left by the collapse of FTX and Alameda, which we dubbed the “Alameda Gap,” has persisted into February, with BTC market depth still well below its November levels. The quantity of BTC-USD(T) bids and asks within 2% of the mid-price aggregated on 16 exchanges hovered around 8k BTC in February. This is over 40% less than in October, when market depth exceeded 13K. BTC liquidity fell the most on smaller exchanges, with Gemini and Kraken registering a decline of over 60%.
Heightened volatility likely kept market makers on edge with market depth dropping by over 2k BTC in February despite edging up slightly last week. The drop was driven by Binance’s USDT markets which declined nearly 50% between Feb 11–17.
New DeFi Coverage
Now Live
We are proud to have expanded our DeFi coverage with the launch of Curve v2, Maker, and Balancer v2. Kaiko’s DeFi data allows clients to visualize swaps, mints, burns, and more for the top decentralized protocols. Now covering:
-
Curve v2: trading, and liquidity data for uncorrelated assets
-
Maker: L&B activity + real-world asset events data
-
Balancer v2: trading and liquidity data in smart pools
Derivatives
Binance offers most perpetual futures with Bybit not far behind.

A useful gauge of market leaders in the perpetual futures space can be the number of pairs each exchange offers. Prior to FTX’s collapse, FTX had the most pairs listed of any exchange and was one of the market leaders for perpetual futures contracts due to the number of contracts it offered. Post-FTX, Binance leads the way with 236 different perpetual futures pairs listed, with Bybit and OKX not far behind. Interestingly, BitMEX ranks poorly in terms of number of perps despite pivoting late last year to a “derivatives-focused strategy” after a round of layoffs.
Bitcoin open interest flat despite price volatility.

BTC open interest for perpetual futures contracts, measured in units of BTC, remained relatively flat last week hovering around 280K BTC despite volatility surging to its highest levels since the FTX collapse. The amount of liquidations on derivative markets was limited compared to past market events. Open interest is still down 17% relative to November suggesting leverage has declined significantly over the past months.
Funding rates, on the other hand, moved sideways hitting both their lowest and their highest levels since mid-January throughout the week. Market sentiment remains fragile on heightened regulatory risks and volatility is unlikely to go away.
Macro
Bitcoin’s correlation with equities hits 4-month low.

Crypto has been decoupling from traditional assets in 2023 as macro headwinds subside and crypto-specific events increasingly drive the market.
BTC’s negative correlation with the U.S. Dollar has seen the sharpest shift towards positive territory, and currently hovers around -0.1, its weakest negative level since August 2022. The greenback has gained some support as U.S. economic data remains robust with the Atlanta Fed expecting U.S. growth of 2.4% in the first quarter.
While BTC exhibited strong volatility in February, it largely outperformed traditional assets as global liquidity improved. BTC’s correlation with the Nasdaq 100 has also weakened, falling below 0.4 for the first time since the FTX crash. Its correlation with U.S. investment-grade bonds currently hovers around zero.
Silvergate share price de-correlates from crypto market.

Silvergate made a name for itself as the bank of choice for some of the largest crypto companies, most notably working with FTX, which accounted for around 10% of crypto-linked deposits. Due to its large crypto exposure, Silvergate’s share price moved in line with BTC returns for most of 2021–22. However, its correlation has weakened significantly in 2023 due to growing legal and regulatory risks around the bank’s dealings with FTX and Alameda..
The bank lost nearly 70% of its value since November and has been heavily shorted. In early January Silvergate revealed it sold assets at a loss to cover massive withdrawals of digital-assets deposits of over $8bn in the last quarter of 2022. Last week, its share price surged to its highest levels since December 2022 after Citadel Securities joined the list of other major investors disclosing a share in the company.
Overall, crypto-linked banks in the U.S. face a tightening regulatory environment which could lead to a reappraisal of the industry with smaller projects and offshore unregulated exchanges deemed too risky. In early February, another major crypto-friendly bank, Signature, cut its ties with Binance which has since suspended USD bank transfers.
Data Used in this Analysis
DeFi Market Data
![]()
Block by block market data for decentralized finance (DeFi) DEX and L&B protocols.
Liquidity Metrics
![]()
The most granular order book data in the industry optimized for quantitative analyis.
Trade Volume
![]()
Centralized exchange data sourced from the most liquid venues, covering all traded instruments.

More From Kaiko Research
![]()
Macro
13/01/2026 Data Debrief
Positioning for $100K: Signals and Key CatalystsThis week’s Data Debrief examines the positioning dynamics beneath the surface of the early January rally. Extraordinary call volume concentration at and around the $100,000 strike, an inverted volatility term structure, and neutral funding rates suggesting balanced leverage.
Written by Adam Morgan McCarthy![]()
Indices
06/01/2026 Data Debrief
The Rise and Repricing of Digital Asset TreasuriesAs digital assets mature and market structure deepens, corporate and institutional crypto holdings are being reclassified from speculative bets to managed treasuries. Instead of sitting passively on balance sheets, these positions are increasingly treated as a distinct asset pool, with dedicated strategies for liquidity, risk, and yield.
Written by Laurens Fraussen![]()
Derivatives
29/12/2025 Data Debrief
Santa Rallies, Cycles, and Year-End Reflections for BitcoinAs markets approach the end of the year, Bitcoin finds itself at a familiar crossroads, caught between cyclical behavior and a steadily developing market. While year-end seasonality has historically played a role in shaping price action, recent data suggests that cyclical drivers are increasingly dominant.
Written by Laurens Fraussen![]()
Derivatives
22/12/2025 Data Debrief
Crypto in 2026, What Breaks, What Scales, What ConsolidatesCrypto markets enter 2026 in a markedly different position than in prior cycle transitions. Rather than resetting after a speculative peak, the market appears to be progressing through a phase of institutional consolidation.
Written by Thomas Probst


