Now Available: Q2 2024 Crypto Market Report

Bitcoin’s supply overhang lingers

Bitcoin

CEX

Liquidity

03/06/2024

    Welcome to the Data Debrief!

    Welcome to the Data Debrief! Although we’re still waiting for a spot ETH ETF launch date, a leveraged ETH ETF is set to debut on Tuesday. Elsewhere, US President Joe Biden vetoed the resolution to overturn the SAB 121 over the weekend, as expected. This week we explore:

    • Mt. Gox transfers and the potential market impact from repayments.

    • How trade volumes fare during the summer months.

    • ETH’s outperformance on ETF approval.


    Trend of the Week

    Mt. Gox Transfers

    Last Tuesday, wallets linked to the defunct crypto exchange Mt. Gox initiated transfers of 140,000 BTC, valued at around $9.2 billion, as the bankruptcy estate prepares to repay creditors. This unexpected activity from dormant accounts triggered a wave of selling pressure in the market.

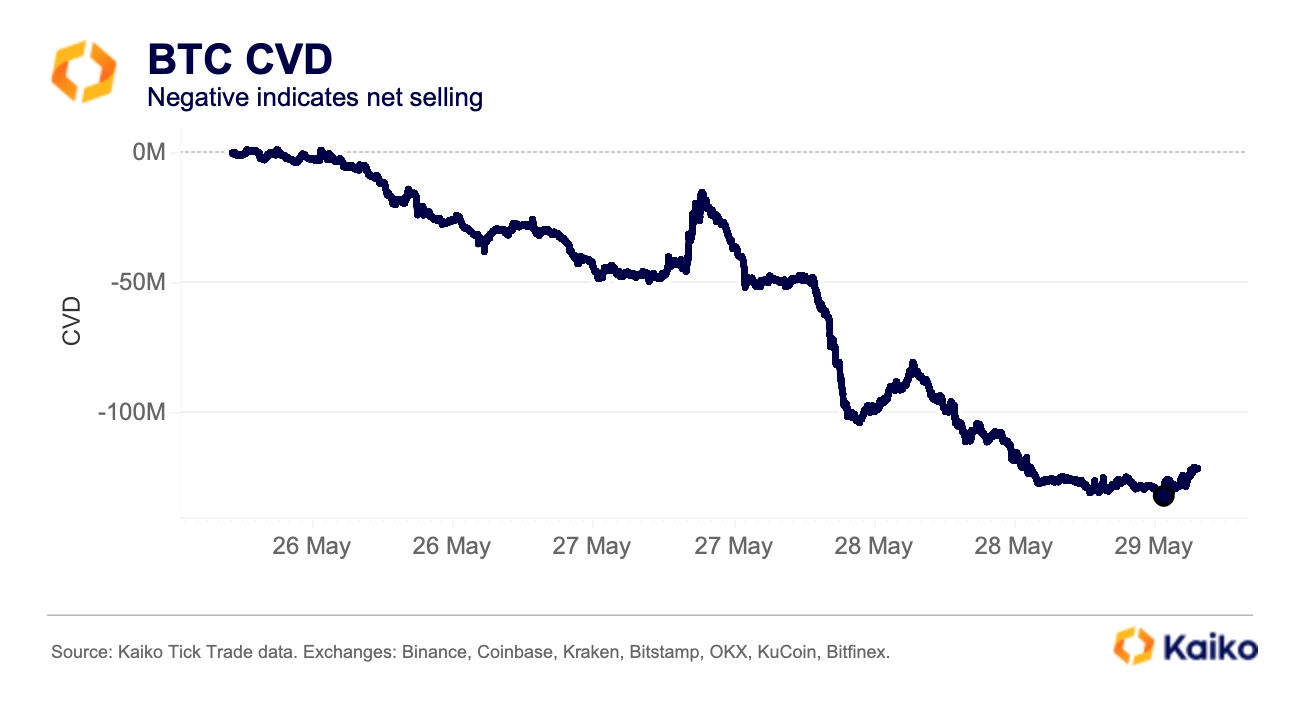
    A reliable indicator of such selling pressure is the cumulative volume delta (CVD), which for BTC recorded a total of negative $120 million between Sunday and Wednesday. This indicates a higher number of sellers than buyers.

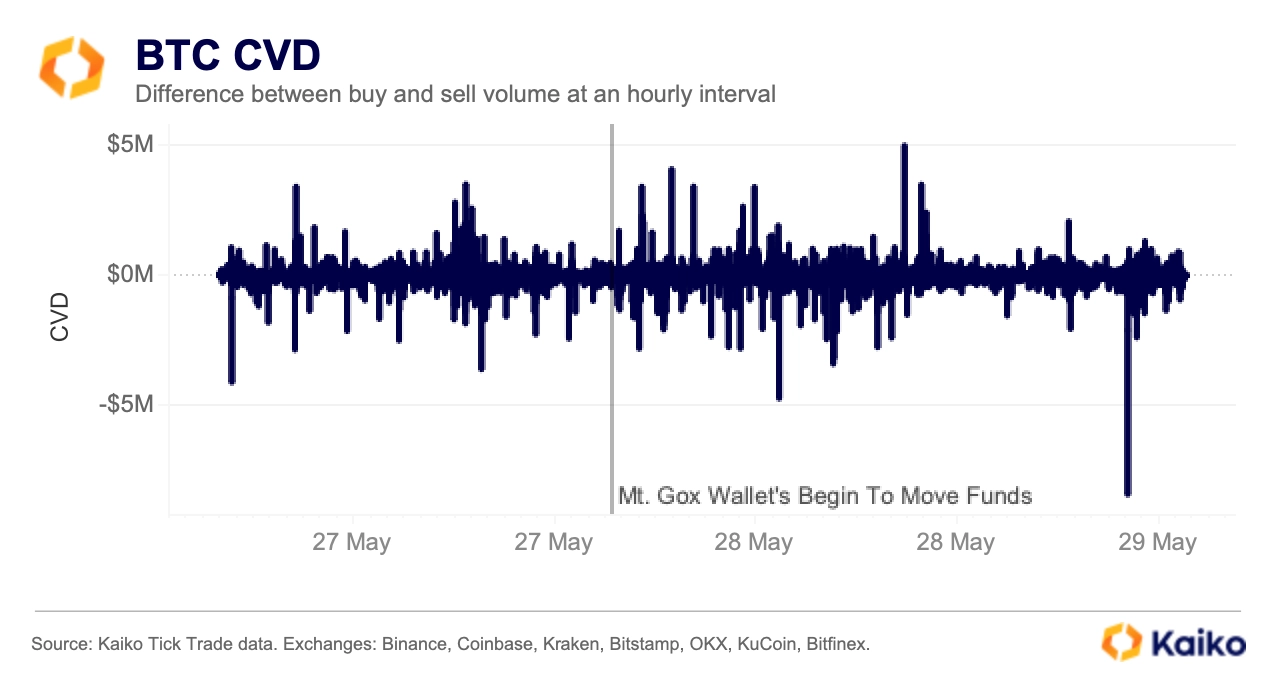
    Breaking down the volume by hour shows that the amount of trading activity increased substantially on May 28, following the initial transfers from the Mt. Gox wallets. Hourly selling activity heavily outweighed buying between Tuesday and Wednesday of last week, leading to a large negative CVD for BTC.

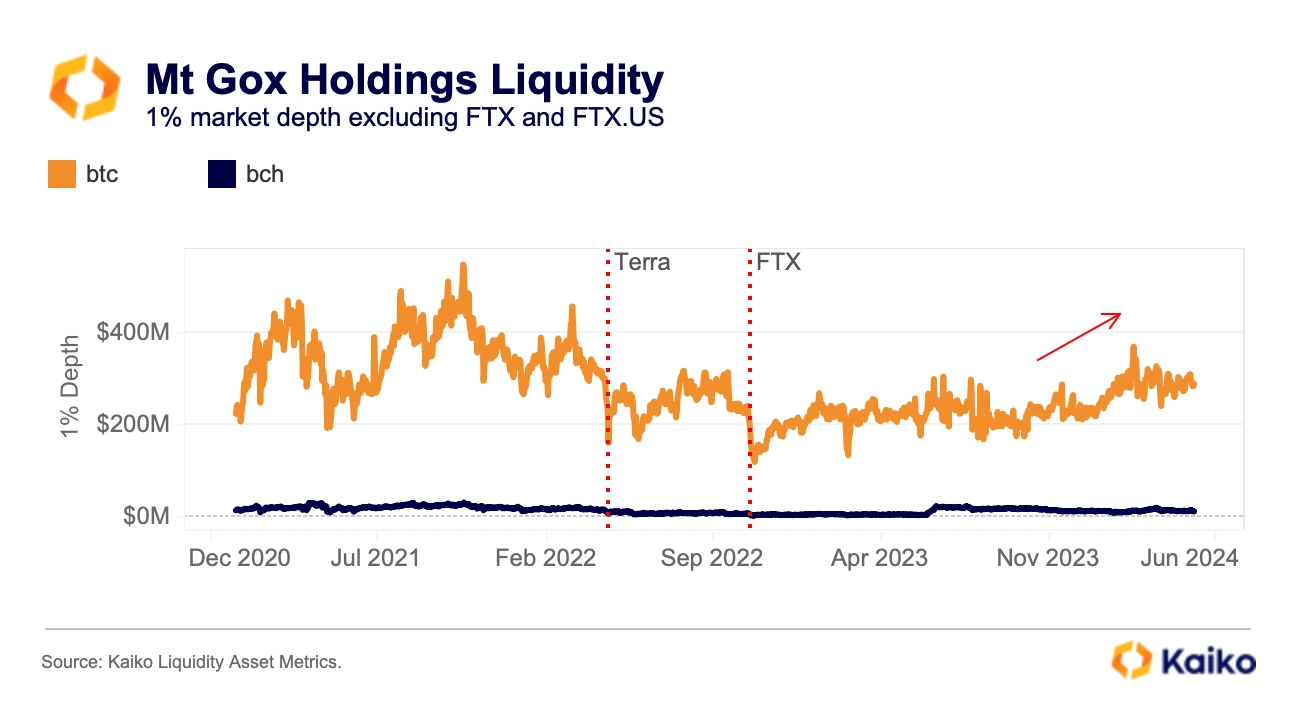
    Mt. Gox will repay creditors in BTC, BCH, and fiat currency. The creditor’s decision to sell their holdings is uncertain and will likely depend on the market’s ability to absorb large orders. Fortunately, the market depth for BTC and BCH has improved by roughly 30%, reaching pre-FTX collapse levels, which may help mitigate potential price fluctuations if the sell-off occurs soon.

    However, looking at the dollar amount of available liquidity, the divergence between the two assets is striking.

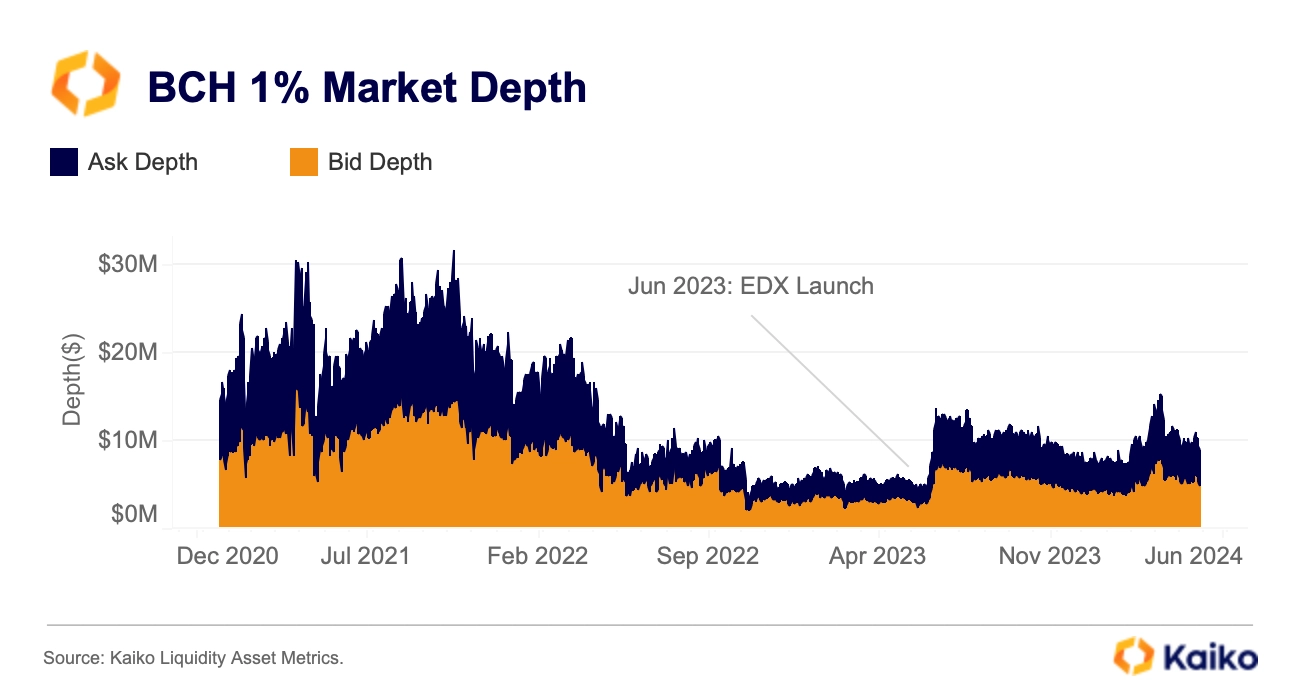
    Bitcoin Cash has significantly lower liquidity than Bitcoin, with a daily average depth of only $9 million or 3.5% of Bitcoin’s depth. Despite benefiting from the recent bull run and the launch of EDX, a Fidelity, Charles Schwab, and Citadel Securities-backed exchange last year, BCH underperformed in Kaiko’s latest liquidity ranking.

    Currently, BCH’s bid-side depth is just $4.8 million, meaning that sell orders of the same magnitude could cause a 1% decline in the BCH price. BCH’s market depth is substantially lower than its level in September 2021 when prices were similar.

    This suggests that Mt Gox repayments could have a significant impact on BCH should creditors sell their assets.

    Never Miss An Analysis

    Get our research twice a week, directly to your inbox.

    Data Points

    Bitcoin enters summer doldrums.

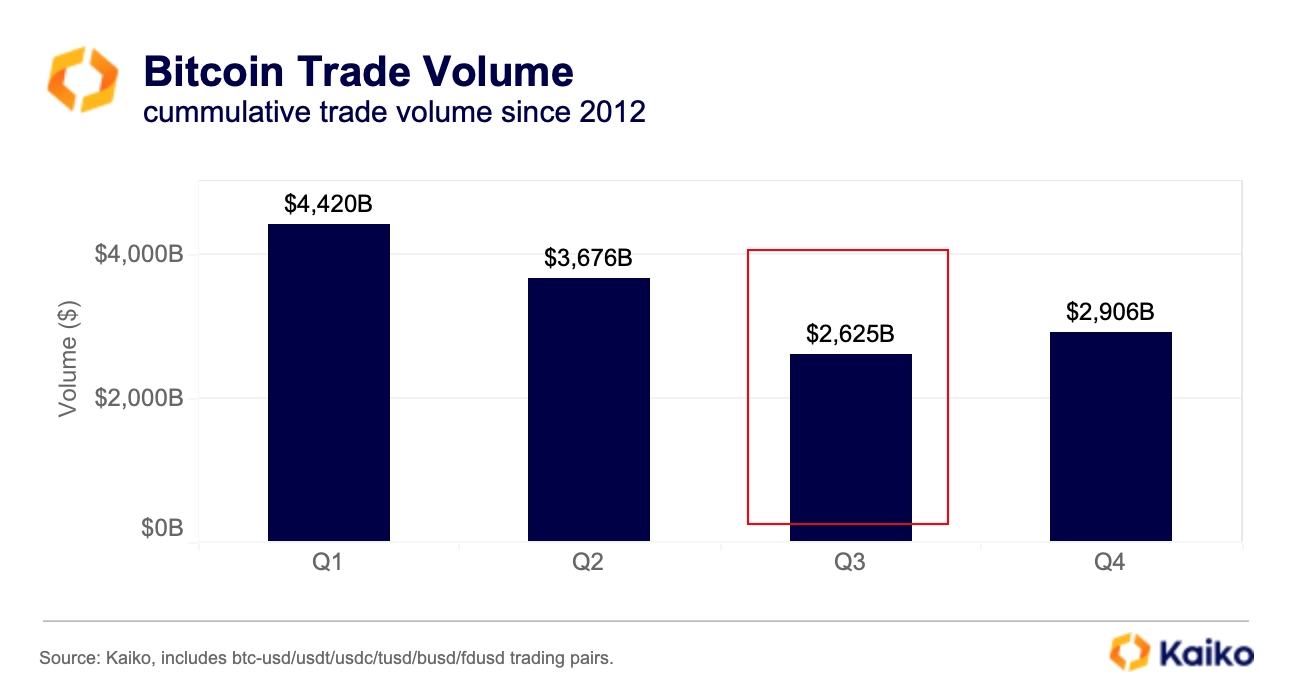
    As we enter June, both crypto and traditional financial markets are experiencing the typical summer trading lull. Historically, Q3 has had the lowest volume by a significant margin, with cumulative BTC trade volume over 40% below the highest-volume quarter.

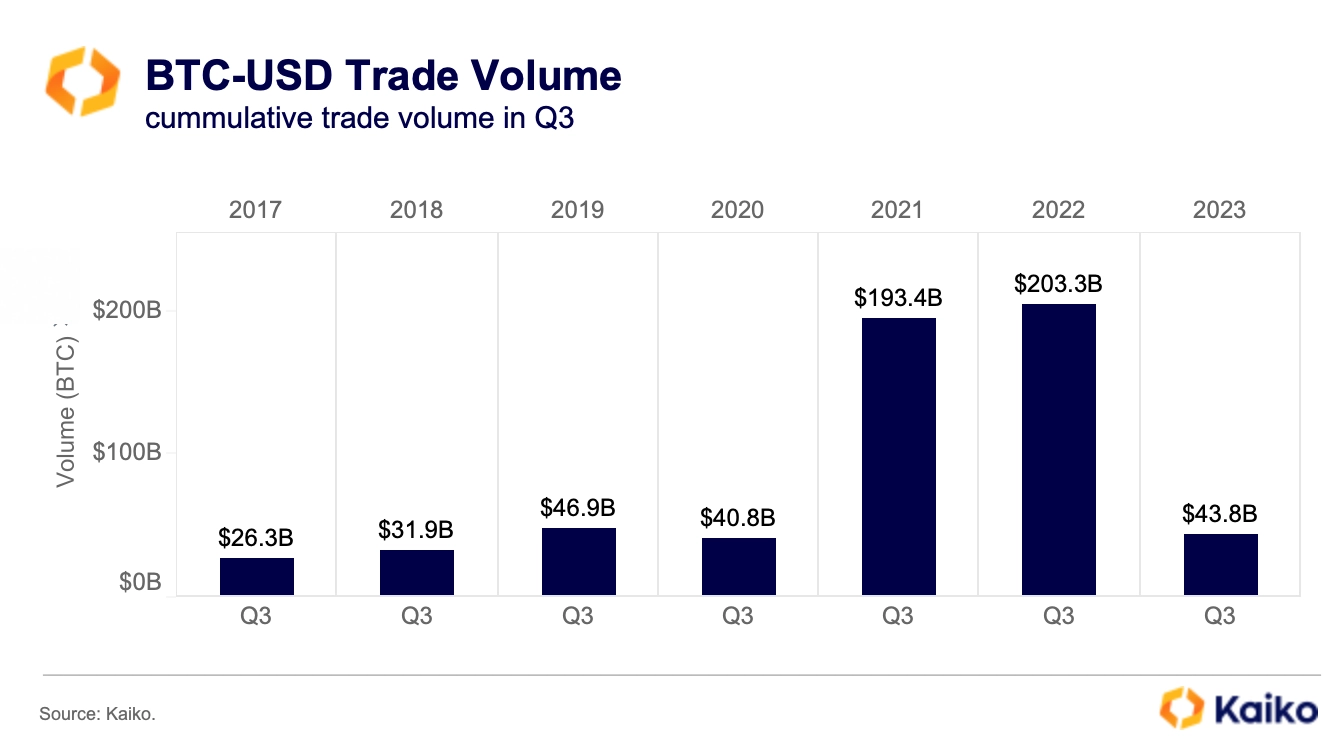
    This trend has been particularly pronounced for BTC-USD volumes, which reached a multi-year low of $44 billion in Q3 2023, despite BlackRock’s spot ETF filing. Tightening regulations and worsening liquidity infrastructure following the US banking turmoil could be partly responsible.

    However, with the launch of 11 spot ETFs in the United States, which has been beneficial for BTC price discovery and liquidity already, there is hope that this summer’s volumes will not be as low as in the past. Nevertheless, the increasing interconnectedness between cryptocurrency and traditional financial markets could pose risks and potentially exacerbate the trend of low-volume trading.

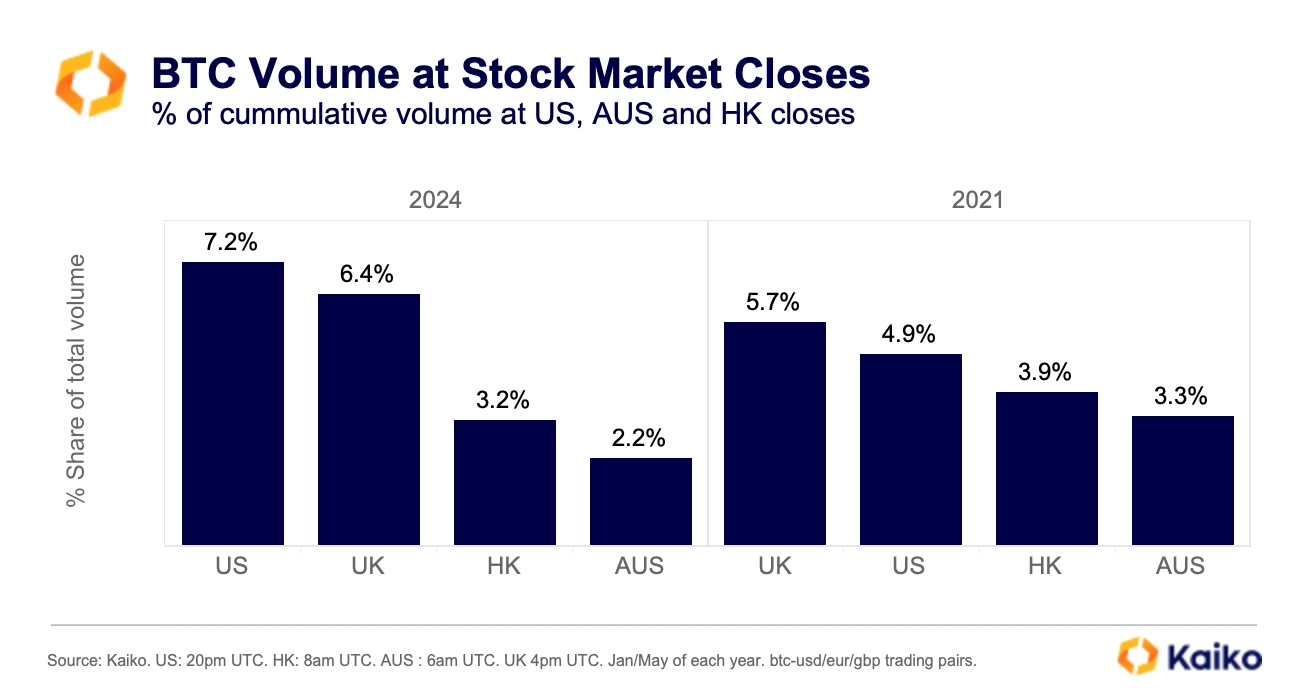
    As previously mentioned, daily Bitcoin liquidity has become more concentrated around US trading hours, with volumes spiking at the market open (14H UTC) and close (20H UTC). This trend is likely linked to Bitcoin ETFs, which calculate their net asset value (NAV) against dedicated benchmarks at the US close each weekday, encouraging arbitrage and price discovery.

    The share of cumulative trade volume between 19H and 20H UTC has increased to 7.2% this year, up from 4.9% during the 2021 bull run. In contrast, Bitcoin trading during Hong Kong and Sydney market closes has declined. This concentration of liquidity in a short time frame could potentially increase intra-day volatility, especially during periods of market stress.

    USD trade volume gains traction.

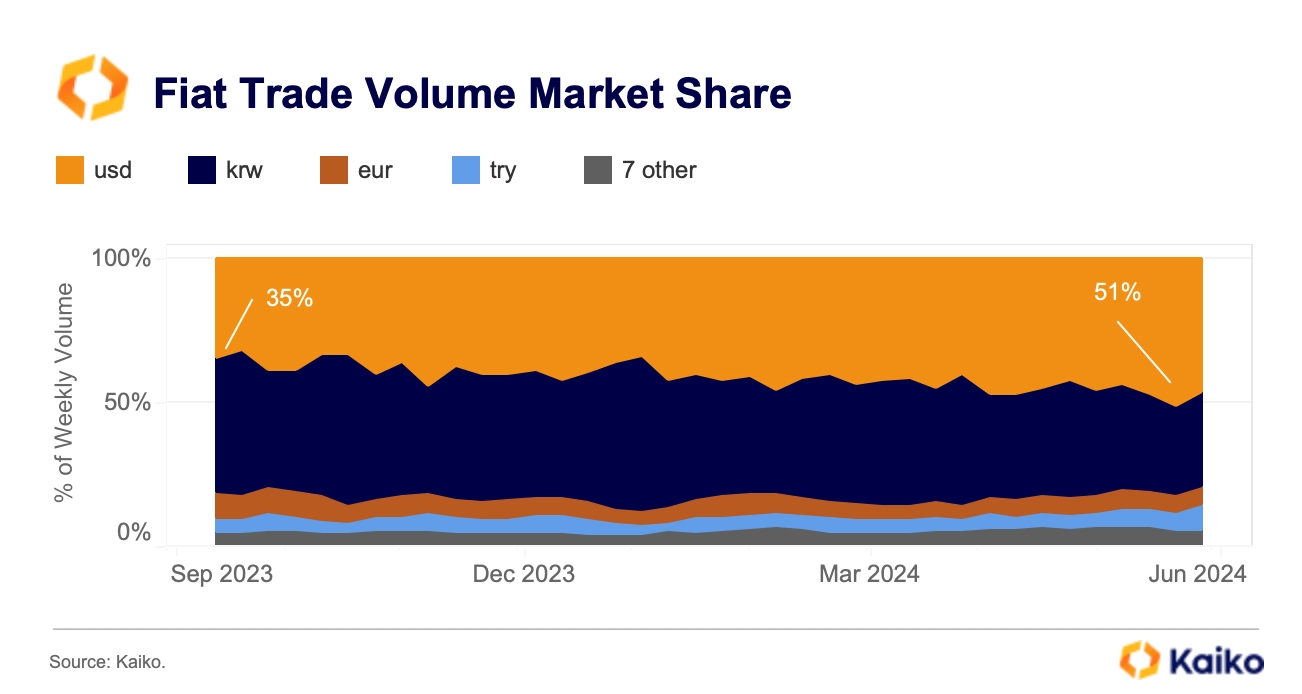
    The share of USD crypto volume, relative to other fiat currencies, has surged from 30% in September 2023 to over 50% in early May, driven by rising institutional interest in spot BTC ETFs. As a result, the USD is outperforming other fiat currencies, such as the KRW and EUR.

    Meanwhile, KRW trade volume lost momentum in Q2, after briefly surpassing USD volumes in Q1. Interestingly, the Turkish Lira (TRY) has overtaken the EUR and is now the third-largest fiat currency in terms of volume, highlighting the growing adoption of crypto assets in emerging markets.

    ETH outperforms on ETF news.

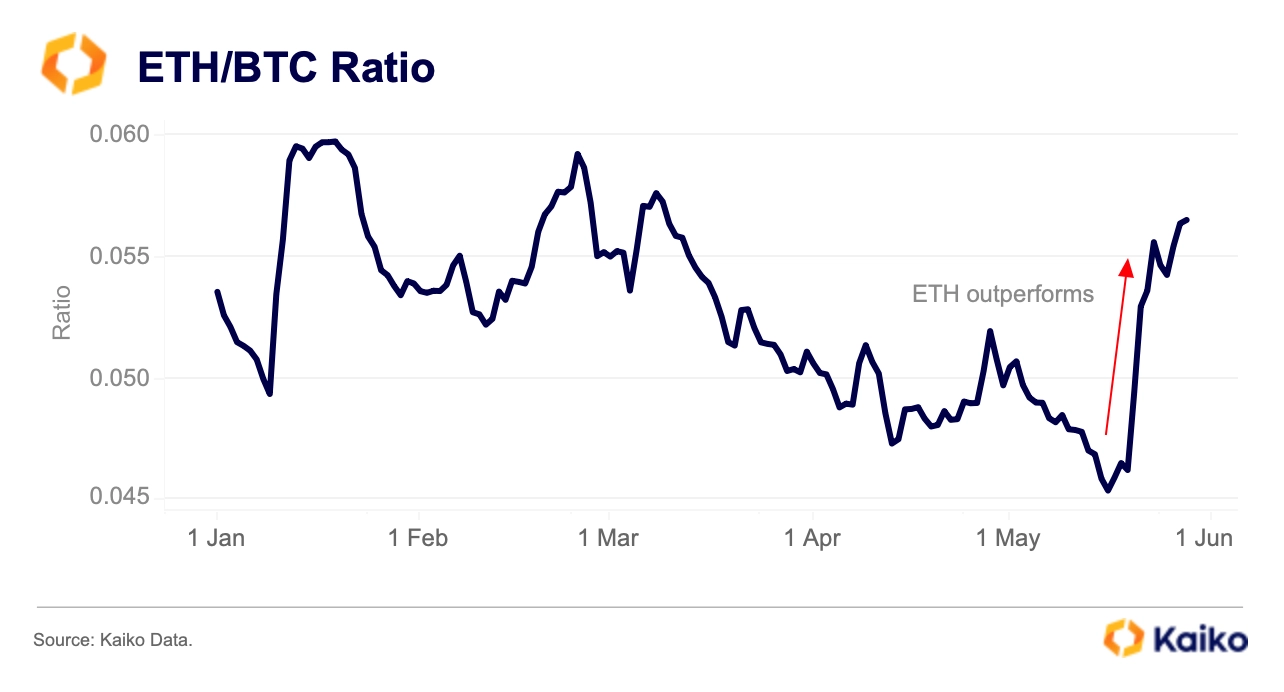
    The ETH to BTC ratio, which measures the relative performance of the two assets, had been trending downwards since March. However, following the SEC’s approval of 19b-4 filings from multiple US exchanges, ETH outperformed BTC, with the ratio spiking above 0.055 that day.

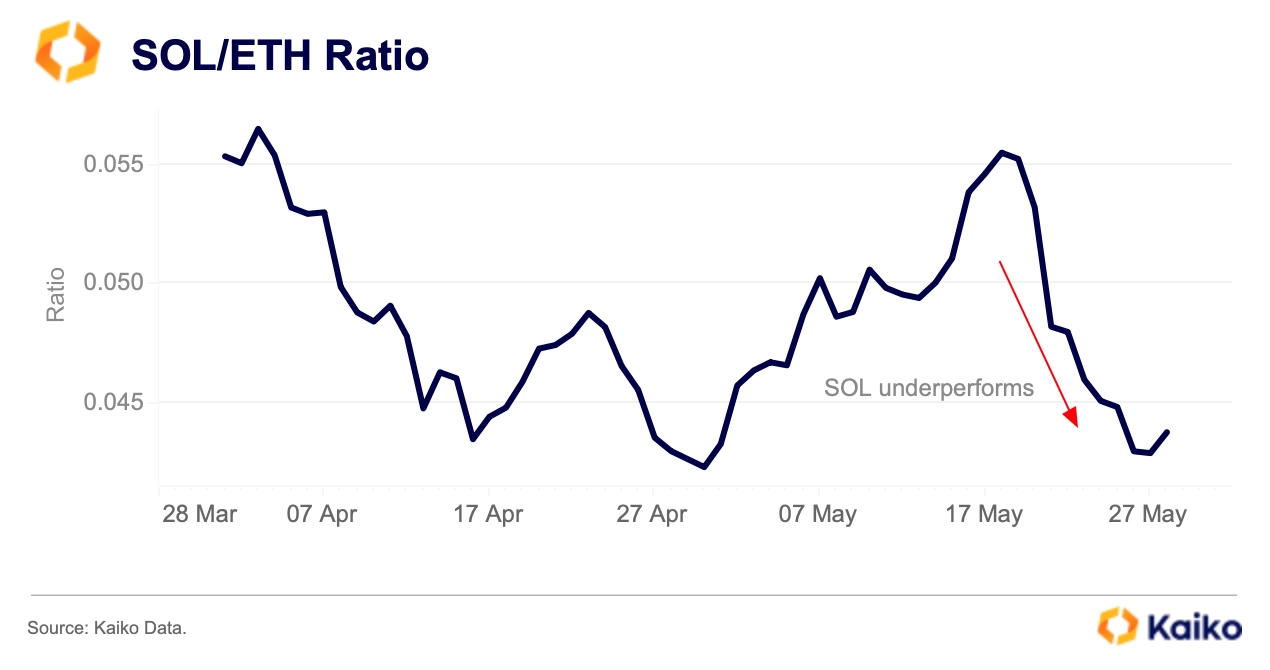
    ETH’s ETF nod has thus far proven to be bad news for SOL. The SOL to ETH ratio fell to its lowest point since April following the SEC’s decision on May 23, despite SOL’s increased network activity earlier in 2024.

    Bitcoin ETF inflows pick up.

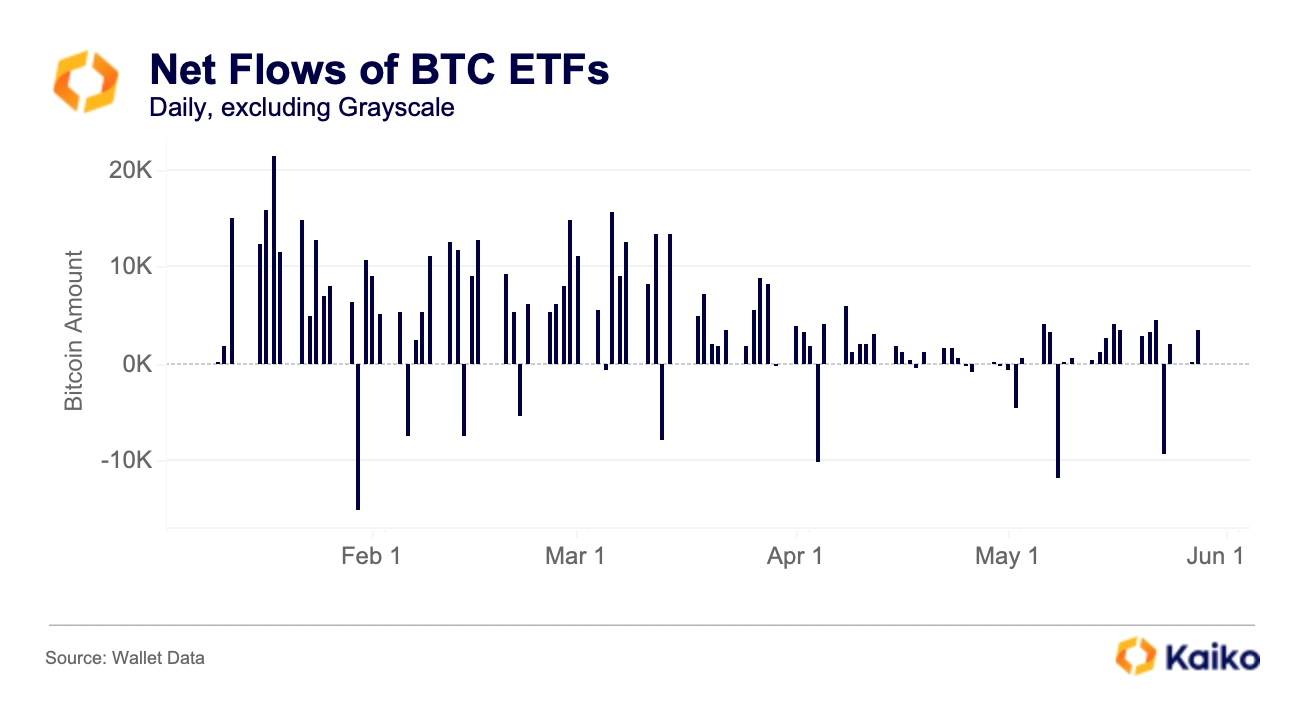
    The nine new Bitcoin ETFs saw a reversal from April’s negative trend, with positive inflows in May. Last month, major funds made 13F filings that revealed some impressive Bitcoin ETF statistics. For instance, BlackRock’s IBIT attracted over 400 institutional investors, including hedge fund Millennium, and surpassed Grayscale’s GBTC as the world’s largest spot Bitcoin ETF last week. Although 13F filings only offer a glimpse of funds’ portfolios as of March, the institutional demand has been viewed as an encouraging factor by most market participants.

    Data Used In This Analysis

    • Trade Data

      Price and transaction volume for centralized exchanges.

    • Market Depth

      All bids and asks on an order book

    • Wallet Data

      All users, all transactions, and all history for blockchain wallets.

    More From Kaiko Research