Data Points
Defining Depegs: A New Metric for Stablecoin Stability
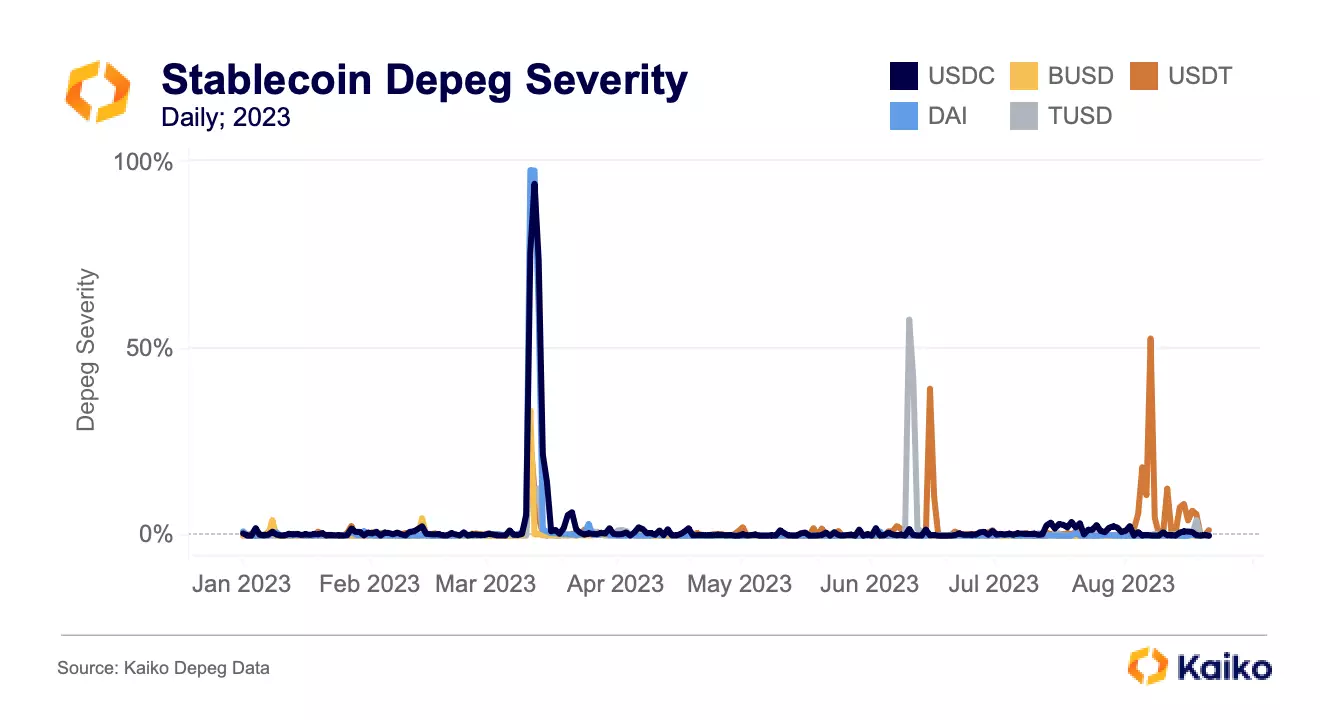
In case you missed it, our Thursday Deep Dive introduced a brand new methodology for measuring the severity of a stablecoin depeg. The term “depeg” has never been successfully defined and is consistently either over- or under-used. This new methodology examines USDC, BUSD, USDT, DAI and TUSD to understand the severity of de-pegs since the start of 2023.
View Deep Dive
Aave’s GHO stablecoin struggles to reach peg.
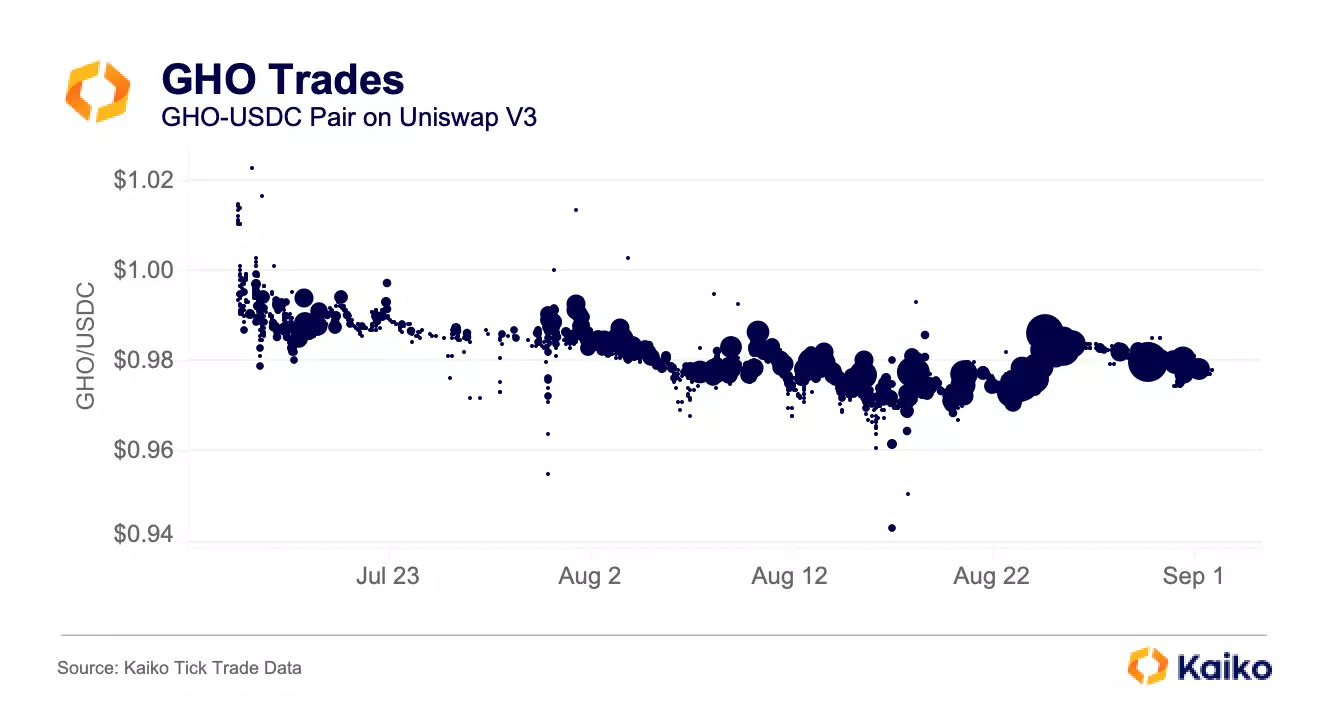
Speaking of depegs, Aave’s new stablecoin GHO has been unable to reach its $1 peg since it was first released in mid-July. GHO is minted against collateral held in the Aave lending protocol and currently holds a borrow rate of about 1.5%. Last week, Aave governance proposed increasing the borrow rate to 2.5% in an attempt to fix GHO’s peg.
Currently, there are few use cases for GHO, meaning that many who minted GHO immediately sold it for another stablecoin. By increasing the borrow rate, users with outstanding GHO loans would be more likely to buy back GHO and repay their loan, helping to push its price up while potentially slowing the token’s supply growth. The DAO voted overwhelmingly in favor of increasing the borrow rate.
XRP price analysis: heavy selling on Upbit and OKX.
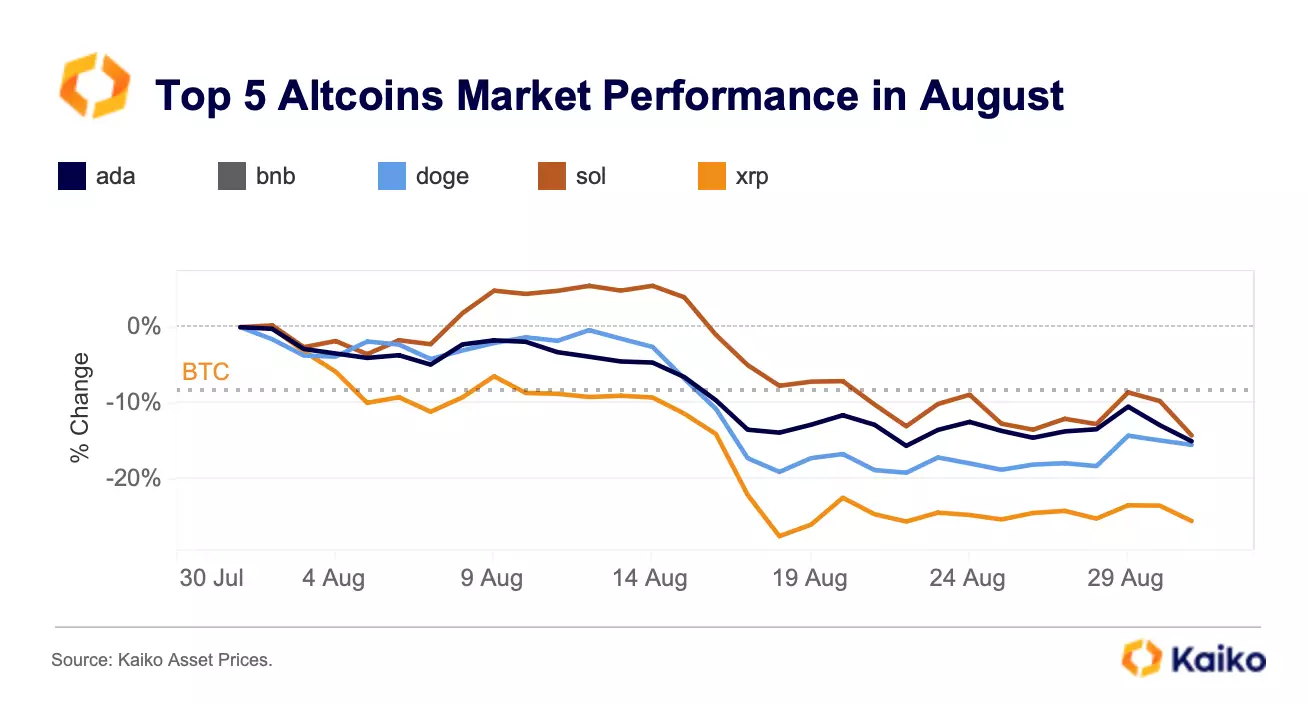
XRP rallied in July after a U.S. court ruled that the token is not a security when traded on secondary markets, but it has since failed to keep its gains. XRP’s price plummeted by more than 25% in August, underperforming the top altcoins as traders took profit.
Despite the summer lull, XRP saw far stronger trading activity relative to other altcoins.
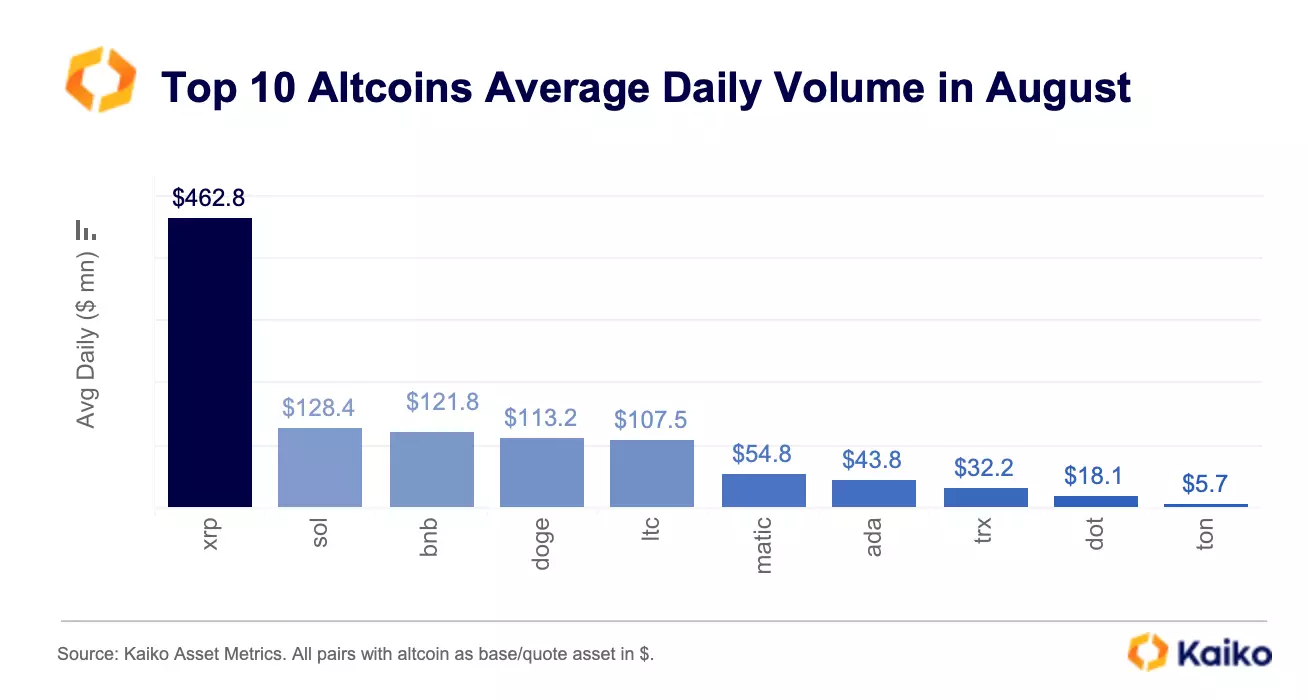
XRP average trade volume was $462mn last month, four times higher than the next largest altcoins by trade volume, SOL and B, which each had $128mn and $121mn, respectively.
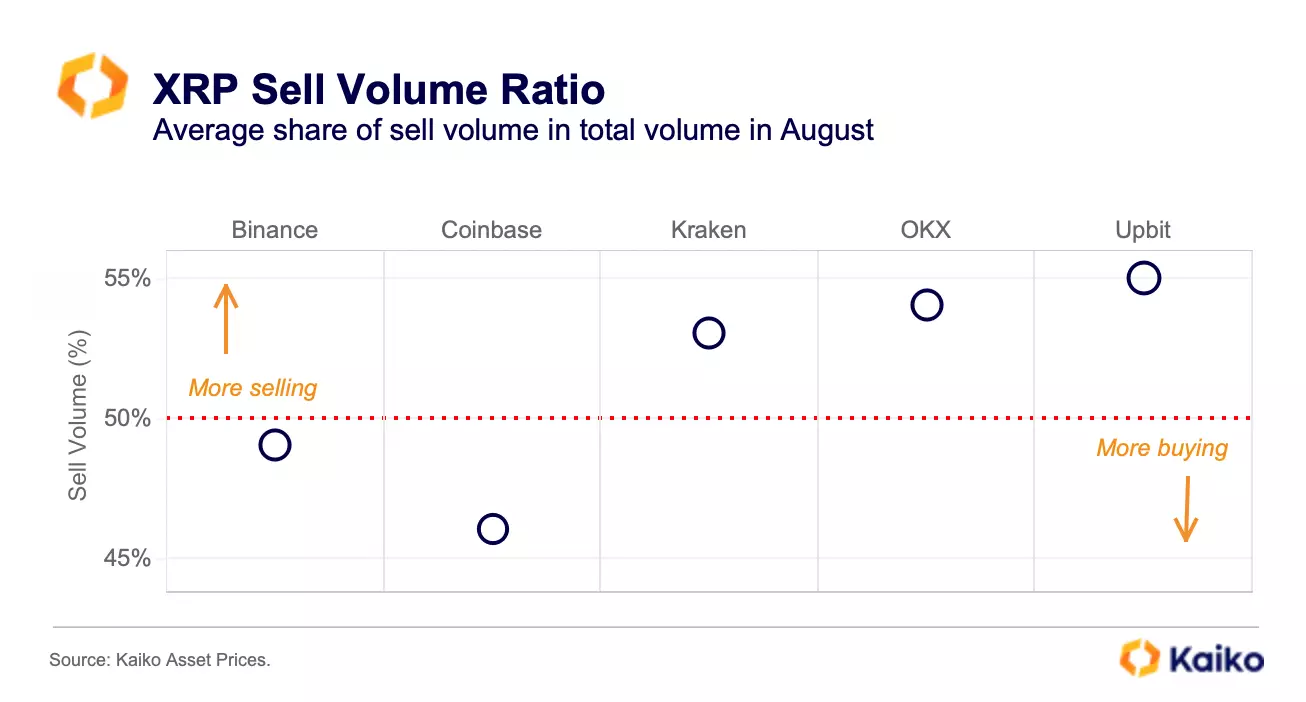
So why has XRP failed to maintain its gains? When looking at the average share of sell volume for XRP, the largest Korean exchange Upbit and OKX saw the strongest selling pressure, while buying was higher on Coinbase throughout last month.
XRP average trade size has also increased on Coinbase, surpassing all top ten altcoins. This could suggest that buying demand was driven by large traders in the U.S. as investors re-gained access to the token after the July court ruling. Overall, the share of XRP traded on U.S. markets remains lower than on offshore exchanges. XRP is only the sixth most traded altcoin in the U.S. by cumulative trade volume while it tops the list on offshore markets.
Binance tightens restrictions for Russian users.
Last week, Binance tightened restrictions for Russian citizens amid reports that the U.S. DOJ is investigating whether the exchange was used to circumvent sanctions. After the start of the war in Ukraine, Binance introduced restrictions for trading on its main platform in line with Western sanctions. However, the exchange continued facilitating RUB transactions via its P2P platform including through sanctioned Russian banks.
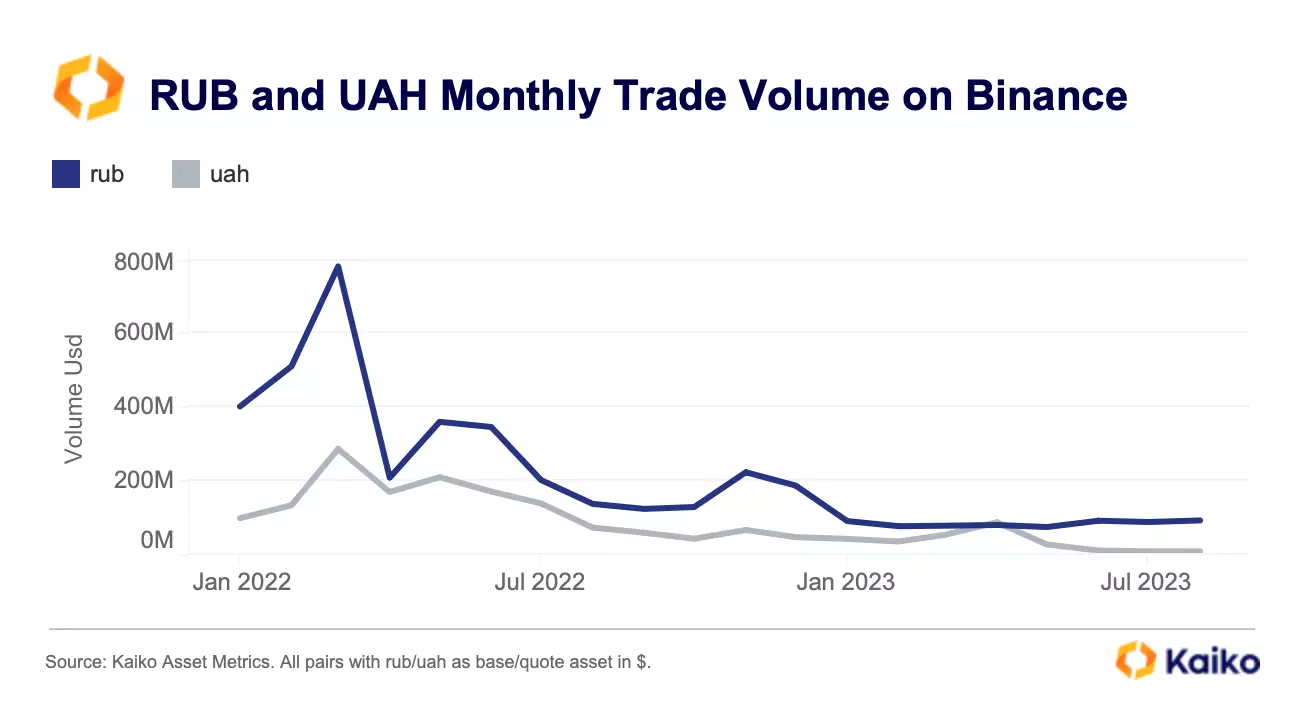
P2P volume is not publicly available, thus it is unclear the impact of the new restrictions. However, on the main spot exchange, RUB and UAH (Ukranian Hryvnia)-denominated trade volume have both declined significantly relative to their peak in March 2022.
In 2023, RUB monthly trade volume averaged just $85mn, down from $507mn in 2021. UAH trade volume declined even more over the same period to around $10mn, down from more than $140mn. RUB-denominated trading represents only 0.2% of overall fiat volumes on the spot exchange.
AI token volumes remain flat despite buzz.
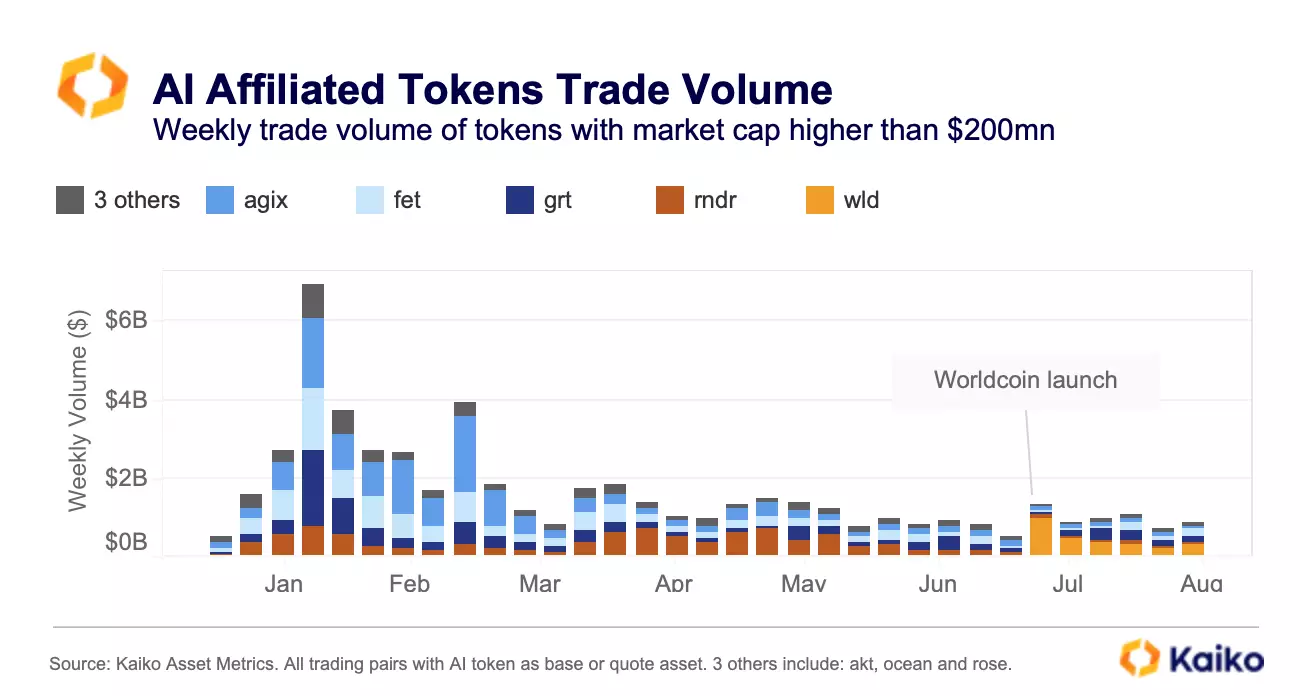
Weekly trade volume for AI-affiliated tokens increased moderately in August, closing last week at around $870mn, up from a yearly low of $570mn hit at the end of July. Overall, volumes are significantly lower relative to the beginning of the year, even after the controversial launch of Worldcoin at the end of July (which we explored here). Worldcoin’s WLD underperformed BTC and most altcoins, registering the largest drop of more than 50% .
Decentralized machine learning platform Fetch.ai and data sharing platform Ocean have gained some traction since mid-August after launching a decentralized data exchange system designed to provide data recommendations while preserving users’ privacy. Open interest for Fetch.ai’s FET also surged by nearly 90% last month while funding rates turned positive suggesting bullish positioning.
FTT lives on.
FTX’s exchange token FTT continues trading on CEXs even though its use cases are unclear after the exchange’s spectacular collapse. Exchange tokens enable holders to benefit from lower transaction fees, vote on new coin listings and earn passive staking rewards. They are typically traded on their affiliated exchanges. Huobi’s HT is almost entirely traded on Huobi while more than 80% of Binance’s BNB is traded on Binance.
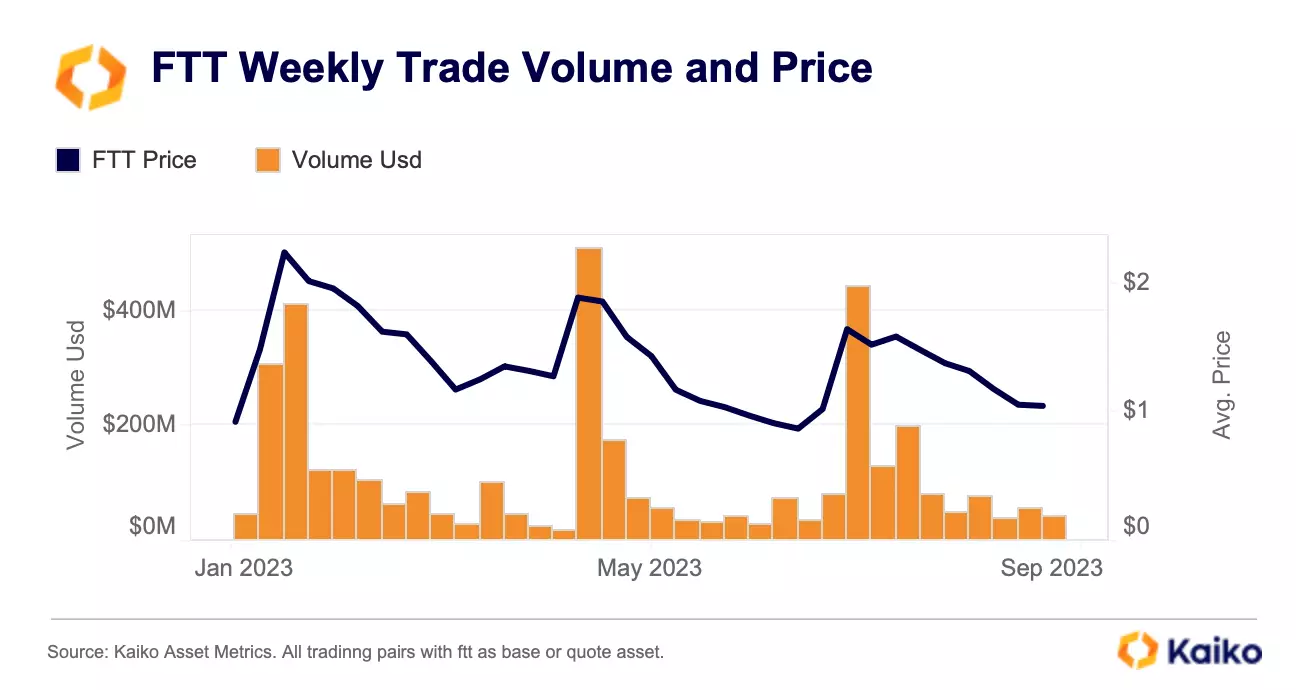
FTT lost most of its value after the collapse of FTX and currently trades at around $1, down from an all-time high of $74 in Sept 2021. However, in 2023, FTT trade volume in native units averaged 67mn FTT (around $109mn).
So where is the token traded? Looking at the breakdown by exchange, Binance and Huobi are the two largest markets.
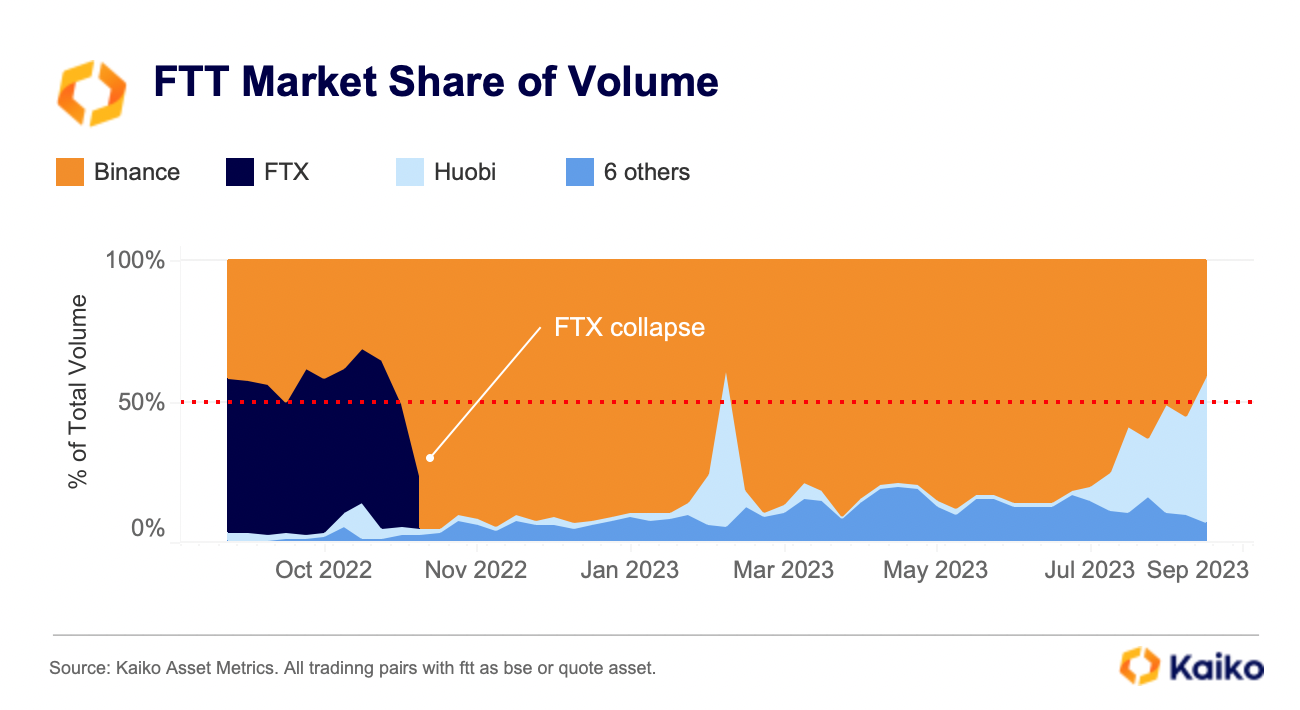
Huobi has gained significant market share in August, which as we noted last week raises some questions. It is notable that even prior to the FTX collapse, Binance was one of the main markets for FTT accounting for a robust 42% of overall FTT trade volumes.