Kaiko's Q1 market report is now live!

Market Makers Flee Binance.US

CEX

Liquidity

Stablecoin

12/06/2023

Welcome to the Data Debrief!

What a week. Binance and Coinbase were each hit with major lawsuits by the SEC, causing heavy volatility and an altcoin sell-off. In other news, Tether invested in a BTC mining company, the Arbitrum network stopped for one hour, and Australia’s largest bank will limit crypto transactions. This week, we explore:

  • The chaos unfolding on Binance.US

  • Fiat-denominated crypto volume and liquidity

  • TUSD’s depegging event

Trend of the Week

Market makers flee Binance.US

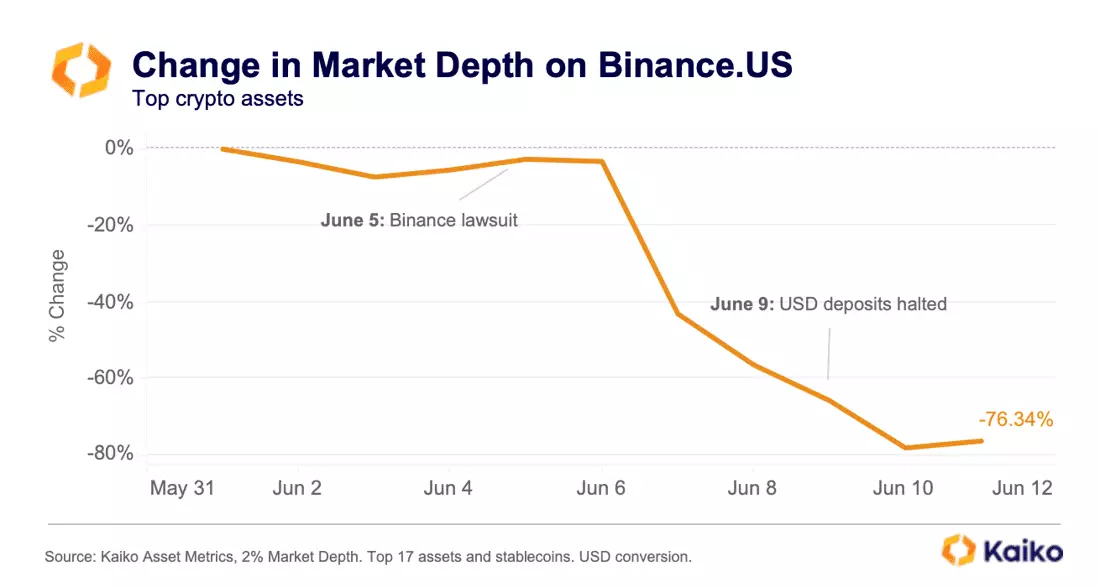
Binance.US is bleeding. One week after the SEC lawsuit, market makers and traders have fled the exchange en masse. Liquidity, as measured by aggregated market depth for 17 tokens on the exchange, has fallen nearly 80% over the past week. On June 4, the day before the SEC lawsuit, market depth was $34mn. Today, market depth is just $7mn.

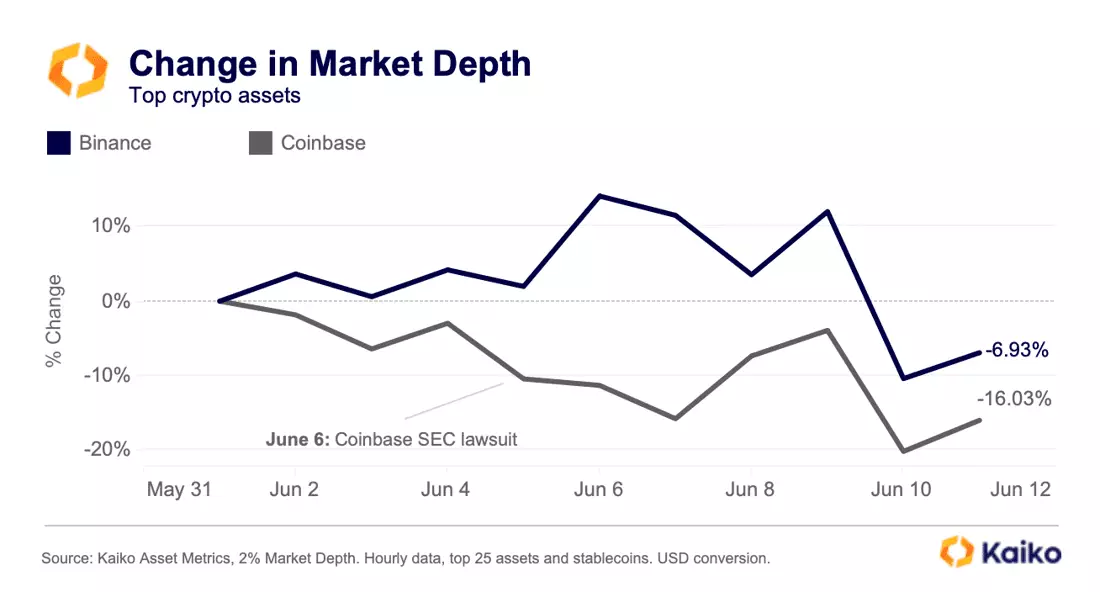
Coinbase and Binance (global) have also experienced a drop in market depth since the lawsuits. Coinbase liquidity is down ~16% while Binance is down ~7% since the start of June. Binance’s market depth initially held steady, even increasing in the immediate aftermath of the lawsuit, but over the weekend fell as altcoin markets sold off.

The sharp drop in liquidity suggests market makers are nervous and want to avoid volatility-induced losses and the non-negligible possibility that their assets could get stuck on an exchange à la FTX collapse.

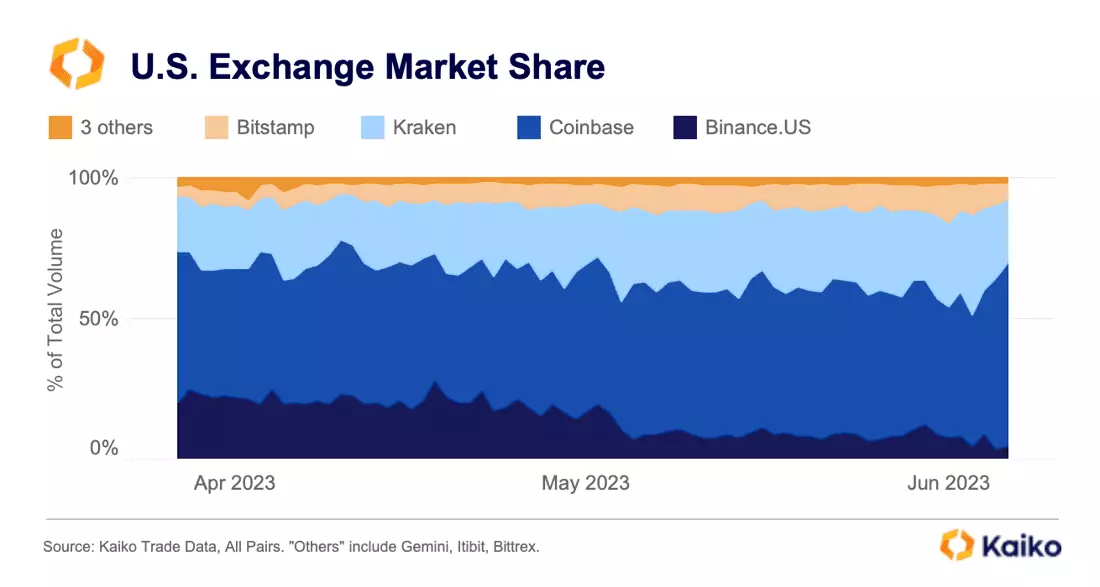
Binance.US has by far suffered the most out of the three exchanges targeted in the lawsuits, and we can see this in its market share relative to other U.S. exchanges. In April, Binance.US possessed 20% market share. Today, it has just 4.8%.

Meanwhile, Coinbase’s market share has soared over the past week, from 46% to 64%, for unclear reasons. No particular asset saw an unusual surge in trade volume.

Ultimately, Coinbase may have the most to lose in the lawsuits, considering 80% of its business is in the United States, whereas the Binance.US entity accounts for just a small fraction of global Binance activity. However, the allegations in the Binance/Binance.US suit are far more explosive, as detailed in last week’s Deep Dive.

This analysis was powered by Asset Metrics.

Never Miss an Analysis

Price

TUSD loses its peg amid minting drama.

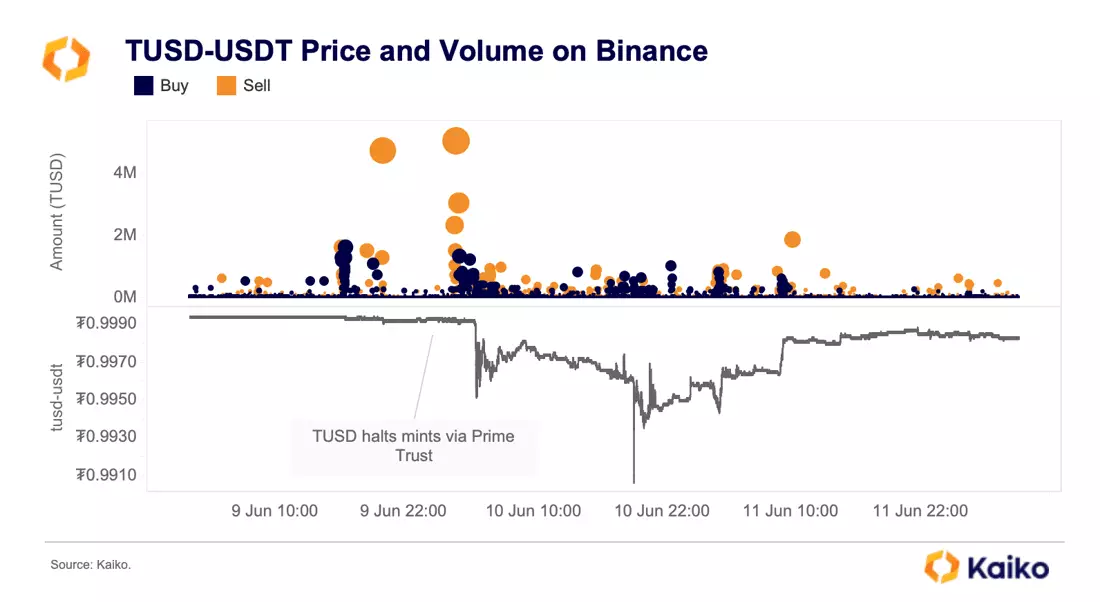
In the early hours of June 10, the stablecoin TrueUSD (TUSD) fell to its lowest level against USDT since March, hitting ₮0.994 following a wave of large sell orders on Binance. The selling started after news broke that one of the stablecoin’s partners, Prime Trust, would temporarily halt minting.

TUSD’s market cap and trade volume have soared ever since Binance promoted the stablecoin by maintaining a zero-fee BTC-TUSD pair. The pair has overtaken BTC-USDT as the most traded BTC market in crypto and currently accounts for 61% of all BTC volume on Binance. However, while trade volumes have surged, liquidity as measured by order book depth has lagged, which suggests market makers are cautious about providing liquidity for the stablecoin. Market depth fell to just $39mn during the depegging, down from $61mn.

SOL, MATIC, and ADA suffer after lawsuits.

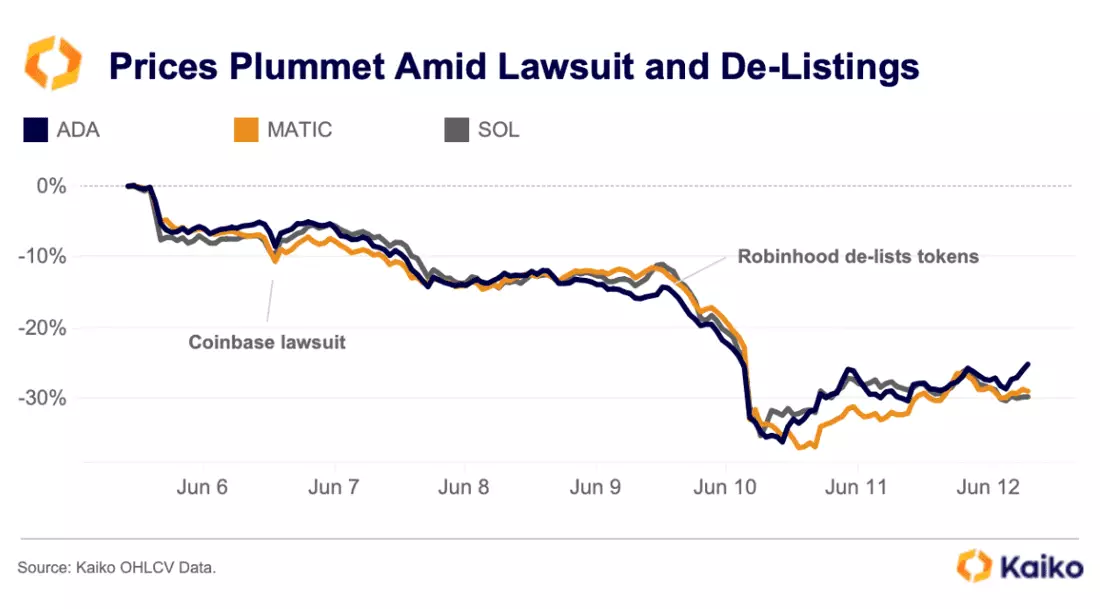
Top altcoins closed the week deep in the red, falling below their pre-FTX levels, as traders rotated into safer assets amid fears of more exchange delistings. Solana’s SOL, Polygon’s MATIC and Cardano’s ADA, which were all labelled as securities in recent SEC suits, fell between 20% and 30%. While Coinbase initially announced that it has no plans to delist the tokens, the trading platform Robinhood — which draws around 20% of its transaction-based revenue from crypto trading — said it will halt support for all three tokens at the end of June.

Liquidity

Banking restrictions cause fiat volumes to fall.

Banking access for crypto firms has never been a more critical issue. The rapid market impact of a wave of banking restrictions can be seen when looking at the volume of fiat-denominated crypto transactions.

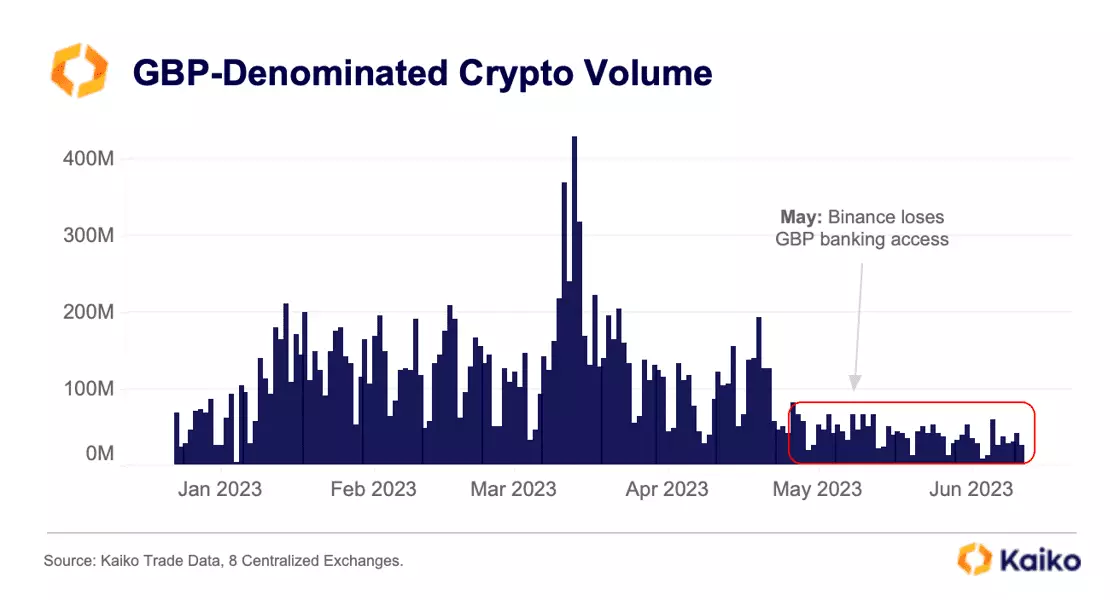
For example, in May, Binance (global) lost its GBP banking access after formerly having the largest market share of volume. Since then, average daily GBP-denominated crypto volume has plummeted and now averages the equivalent of just ~$30 million/day, aggregated across all exchanges.

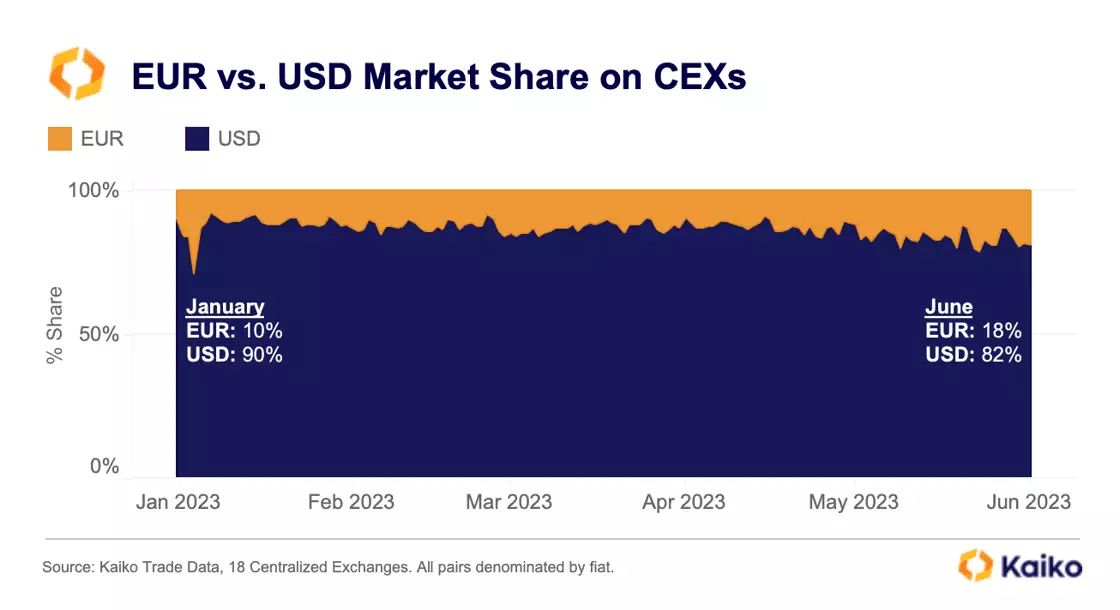
The U.S. regulatory crackdown and banking crisis has also made USD-denominated crypto transactions a lot harder. Since March, we can observe a drop in dollar market share relative to the euro. Euro market share is now 18%, up from just 9% at the start of the year relative to the dollar.

Does this mean that crypto activity is migrating towards Europe? It may be too early to draw this kind of conclusion. What is more likely is that there is a larger drop in dollar-denominated trading volume while euro-denominated volume has been more resilient.

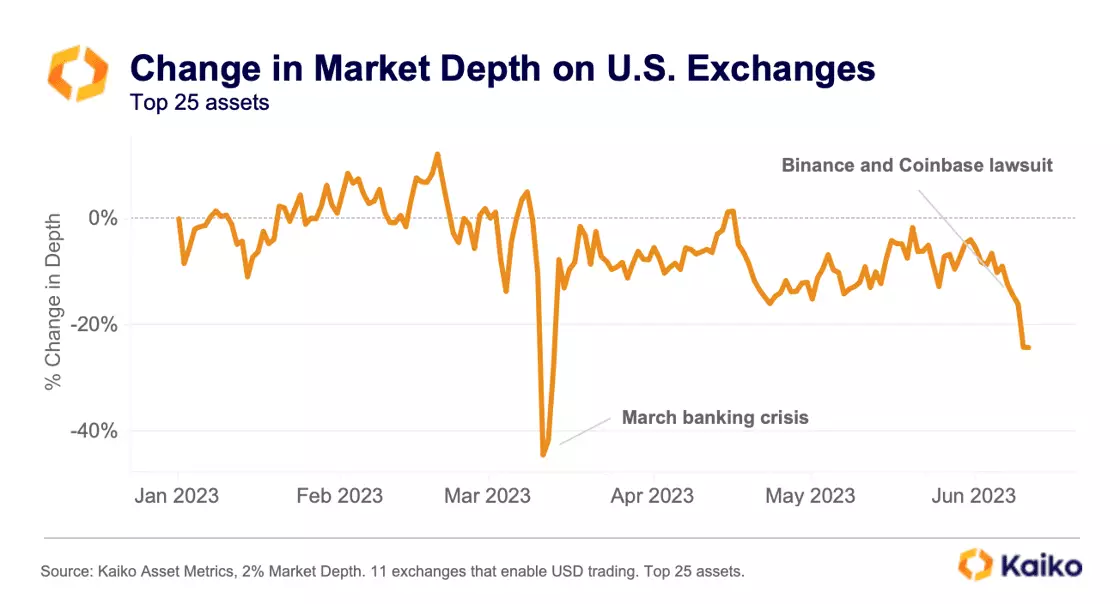
Liquidity data for U.S. exchanges shows a similar trend, further confirming that U.S. crypto activity has been hit hard. Total aggregated market depth for the top 25 crypto assets has fallen 24% since the start of 2023.

Market depth took an initial plunge during the March banking crisis, falling over 40% in a matter of days before recovering. The recent dip in depth is linked to Binance.US and Coinbase, which are included along with nine other exchanges in the aggregation. Liquidity on other exchanges has been far more resilient.

Despite the recent crypto banking struggles, new financial firms are quietly emerging to fill the gap, according to a new Bloomberg report.

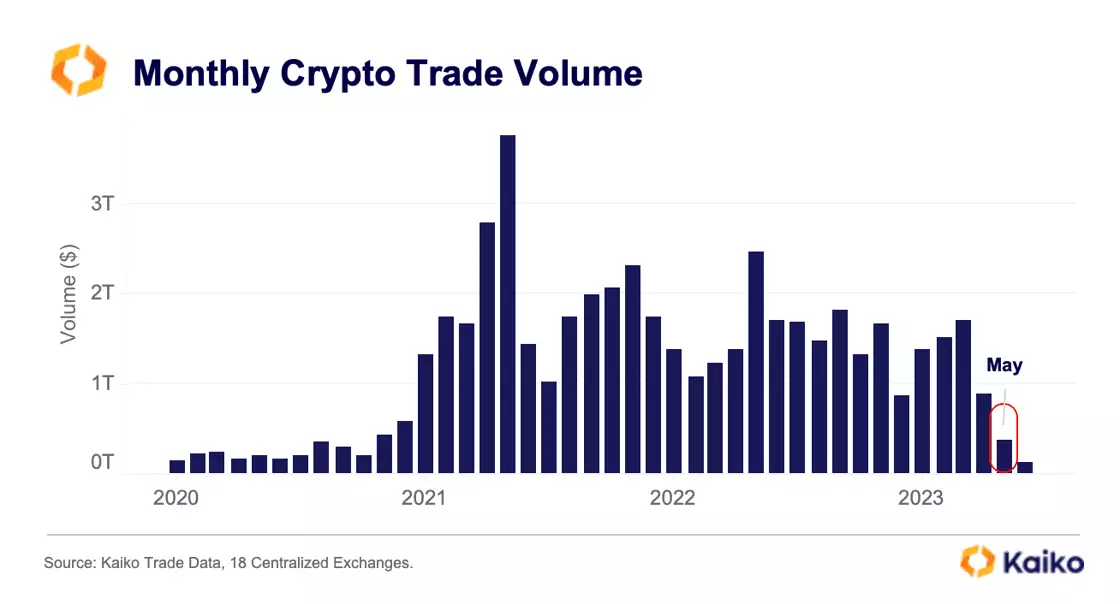
May was the lowest volume month since October 2020.

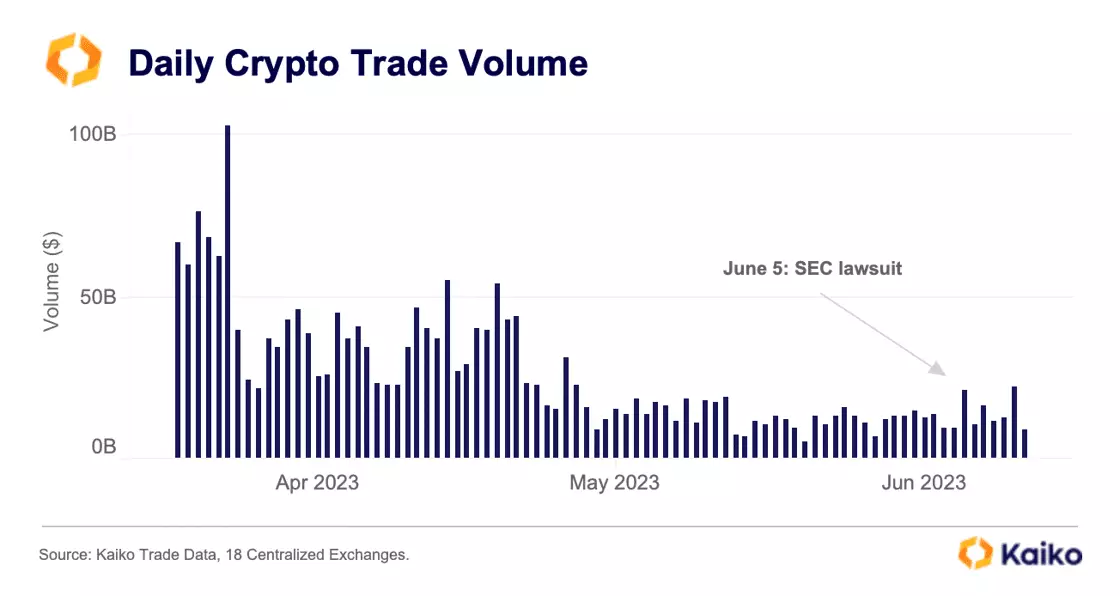
Aggregated May monthly trade volume on 18 CEXs fell to its lowest level since 2020. Throughout the second quarter of this year, volume has declined steadily, retreating from a multi-month high reached in March during the banking crisis. However, just 11 days into June and we can observe an uptick in activity linked to the recent SEC lawsuits.

The summer months tend to have lower activity and volatility, and unless there is another large market event, we can expect similar trends.

ETH DEX market share remains steady.

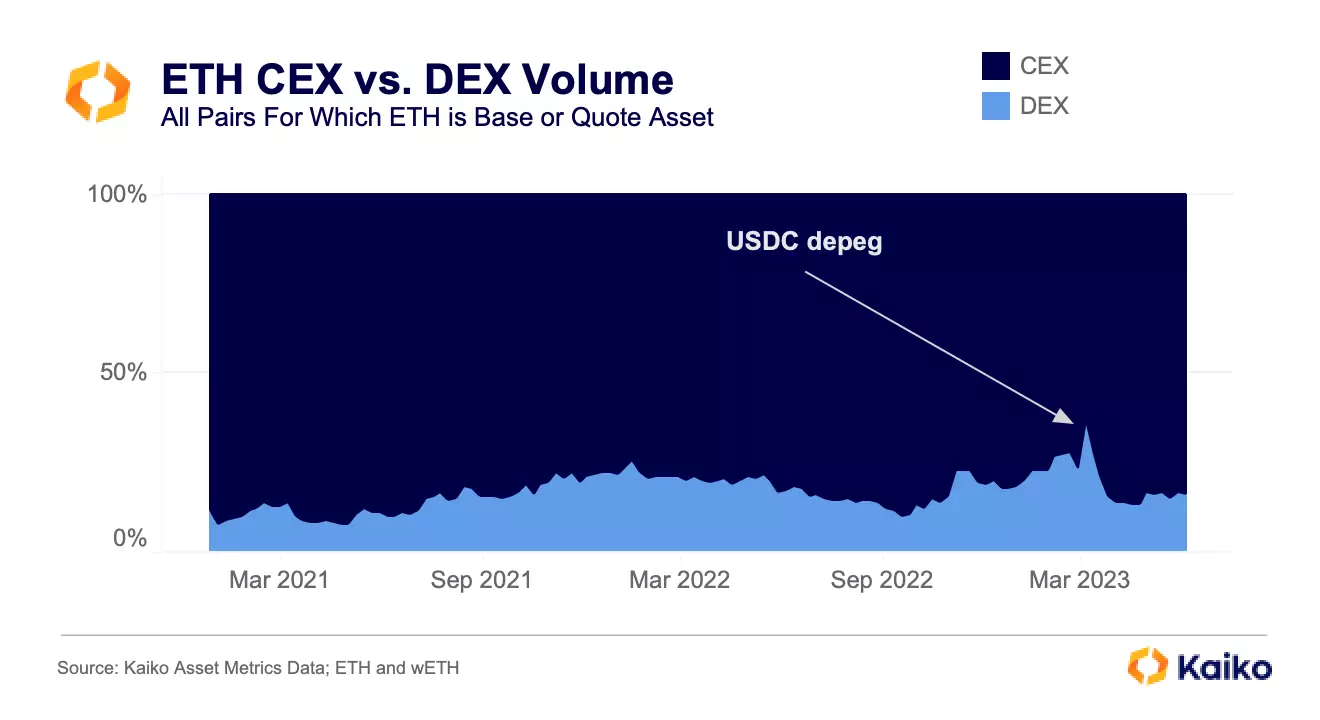
Volumes have fallen significantly in the past month. In ETH’s case, there has been a nearly equal drop in CEX and DEX volume, as shown by its stable volume share. Asset Metrics volumes includes all ETH (and wETH) volumes, for example: ETH-USD on Coinbase and LINK-ETH on Uniswap V3. DEX share peaked the week of USDC’s depeg, hitting nearly 40%. In the immediate aftermath it dropped to yearly lows of 13%. However, since late April DEX share has been nearly unchanged at 16%. This is roughly the same level as late 2021, the tail end of the bull market. Notably, there was no shift towards DEX volumes even as the SEC alleged that Binance and Coinbase’s ETH staking programs constitute offering unregistered securities.


Asset Metrics:

The Ultimate Liquidity Toolkit

Asset Metrics provides information and liquidity metrics at the asset level. Aggregating data across all pairs and exchanges, this product gives you a global understanding of an asset’s market structure. 

  • Trading activity: global volumes for thousands of instruments

  • Liquidity: market depth from .01% to 10% aggregated across order books

  • Addresses: distribution of an asset’s supply across a network

  • Coverage: all assets and exchanges covered by Kaiko

Derivatives

BTC and ETH IV are elevated.

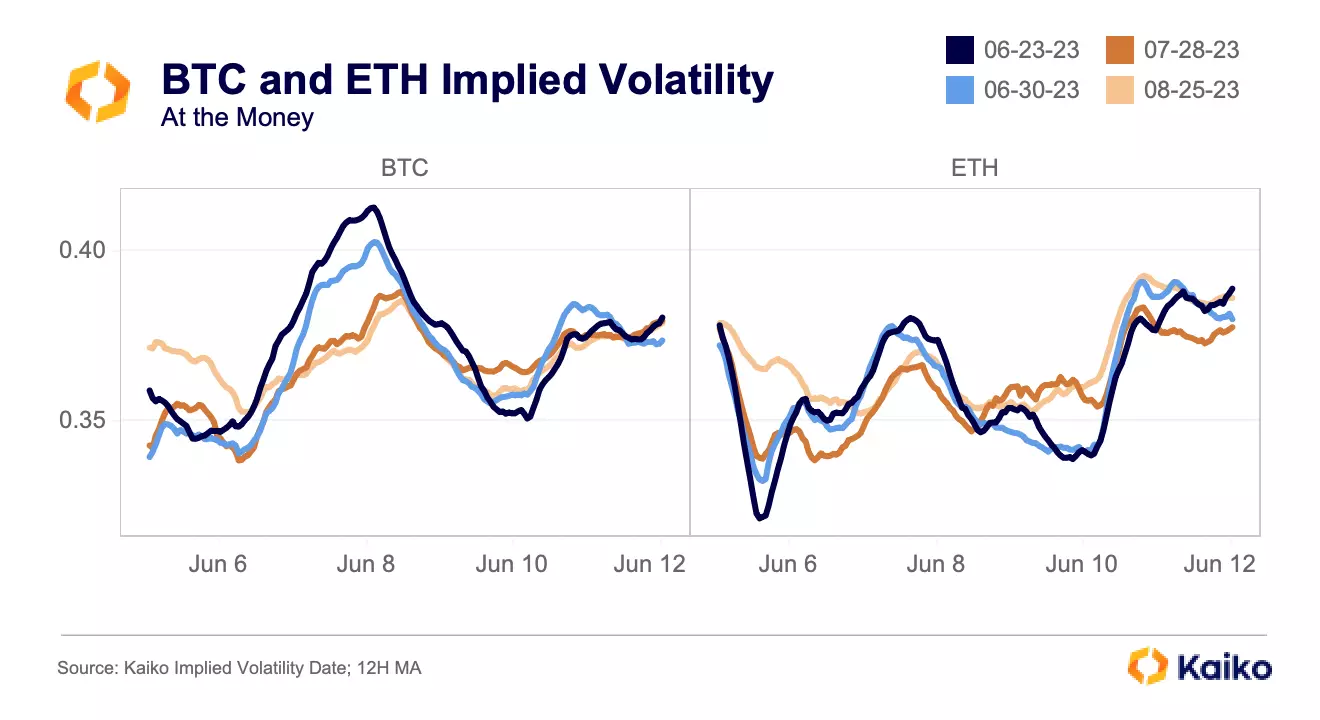
BTC’s implied volatility began last week lower than ETH’s but both rapidly rose – particularly for shorter expiry dates – on the news that the SEC would be suing Binance. This means that traders began to price in more volatility, making option premiums more expensive. ETH’s IV also rose, though it would not surpass BTC’s until later in the week, surging into the weekend and remaining elevated into this week.

Neither BTC or ETH’s IV jumped on the news that the SEC was suing Coinbase. ETH’s smaller reaction to the lawsuits is perhaps surprising considering ETH staking services were called out in both suits. Coinbase executives have stated that the exchange will continue to offer the service while the suit continues.

Binance open interest drops by $500mn

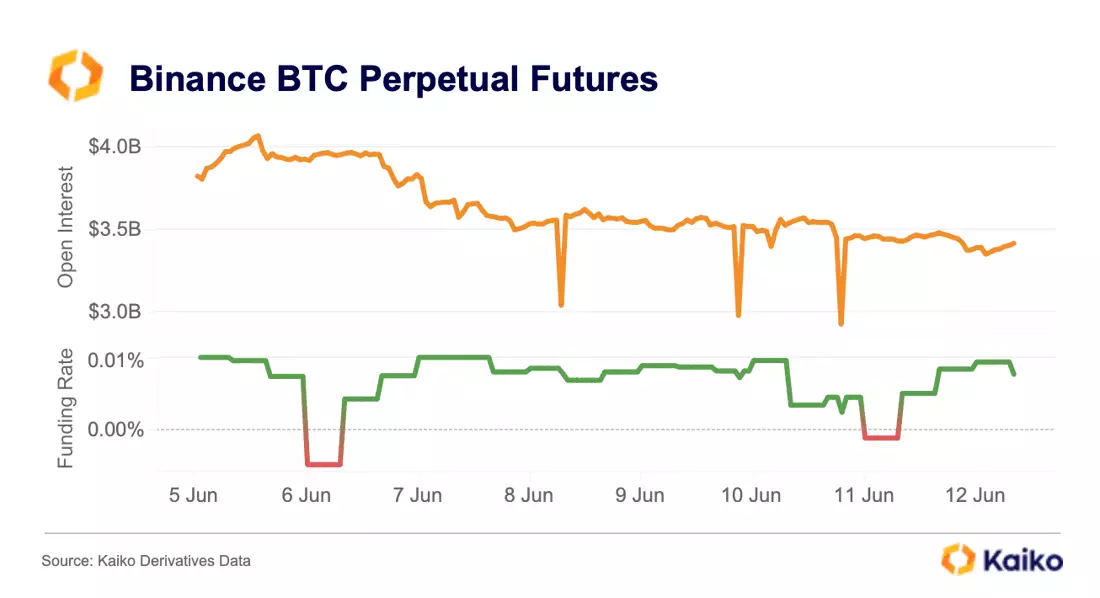
There was a market-wide decline in open interest over the last week, with BTC open interest falling over 25% on Binance from peak to trough, with a high of $4.1bn of open positions down to a low of $2.9bn, as long positions were liquidated and prices fell. Interestingly however, funding rates on Binance remained mostly positive throughout the week, only dipping negative for two funding payment periods on the 6th and the 11th.

.

Macro

Coinbase’s bonds are suffering amid lawsuit.

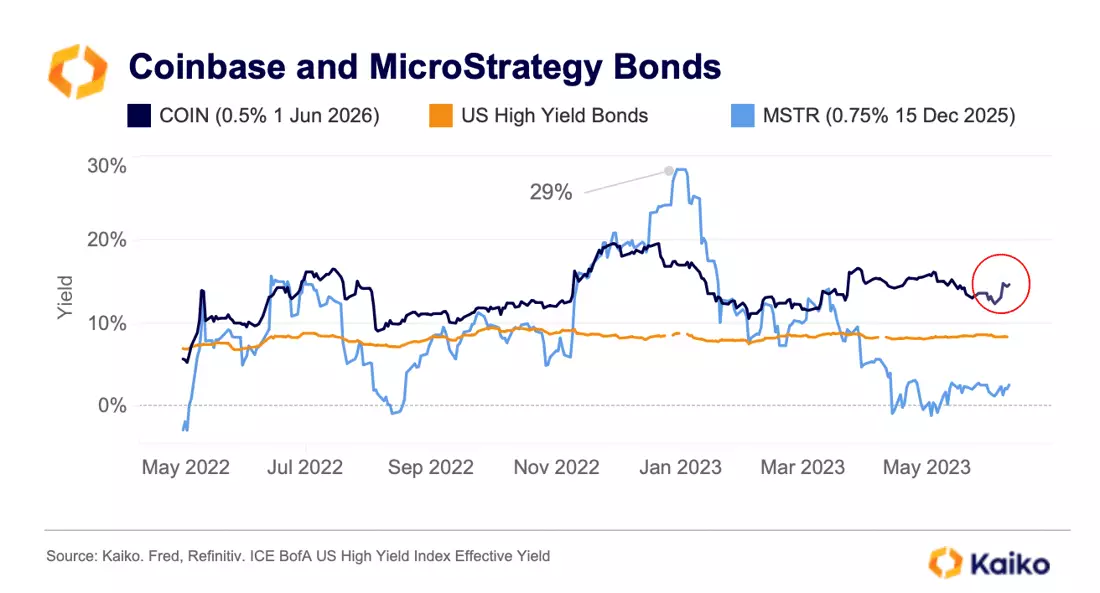
Coinbase convertible bonds yields – which move inversely to prices – spiked last week from 12% to 15% after mostly declining throughout May. This increase was comparatively lower than the spike witnessed during the March U.S. banking turmoil, indicating that the market has already factored in a substantial amount of potential risks. Overall, since the collapse of Terra in May 2022, yields on bonds tied to Coinbase have consistently remained on average 5% above the yield of US non-investment-grade corporate debt securities also known as “junk bonds”. Junk bonds are rated below BBB/Baa and have relatively high default risk.

Interestingly, yields on MicroStrategy’s debt maturing in Dec 2025 have been declining this year after hitting a record 29% after the collapse of FTX and are now at around 2%. While both Coinbase and Microstrategy share prices fell last week following the SEC’s suits, Microstrategy has performed better than Coinbase this year. Notably, Bitcoin – Microstrategy’s only crypto holding – has not been mentioned in recent SEC suits.

Bitcoin less correlated with the VIX.

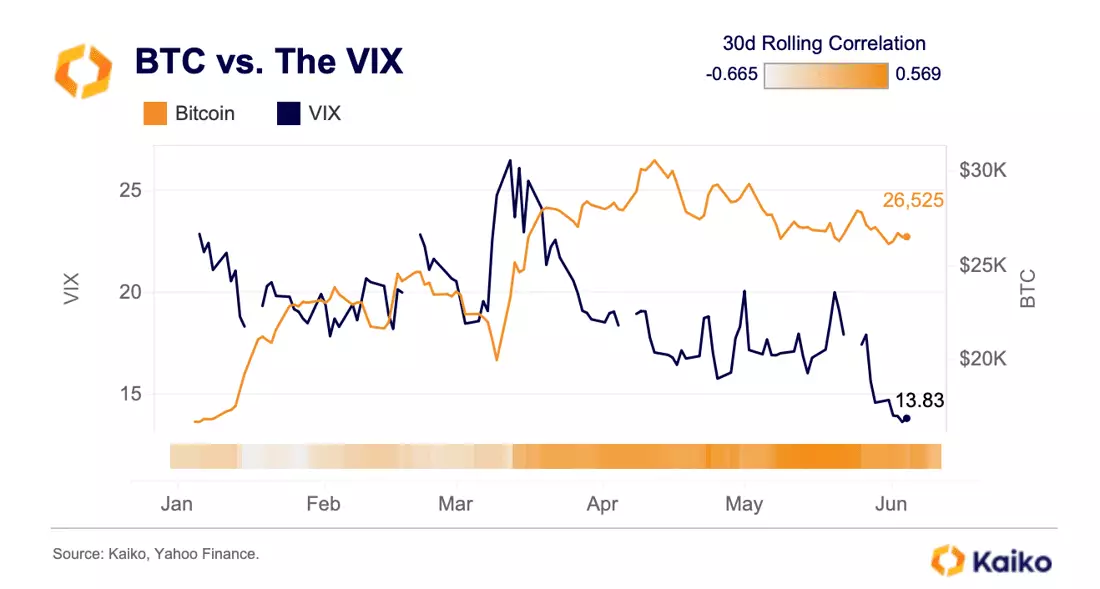
Last week the CBOE’s Volatility Index (VIX) fell to its pre-pandemic levels while the S&P 500 technically entered a bull market (up more than 20% from recent lows). The VIX measures the expected volatility of the S&P 500 over the next 30 days. While the current low levels of the VIX can be explained by technical factors such as options supply and demand, historically, it tends to decrease during periods of market optimism and increase during equities sell-offs.

Over the past three years Bitcoin has been negatively correlated with the VIX, selling-off in sync with rising U.S. equity volatility. Since March, however, this correlation has turned slightly positive. This mirrors low crypto trade volumes and liquidity and suggests that the challenging regulatory environment is likely keeping traders off the market, limiting cross asset spill overs. BTC’s correlation with the S&P 500 has also weakened significantly this year, falling to as low as 6% in April before rebounding to around 30% in June.

Data Used in this Analysis

  • Derivatives Metrics

    Metrics and analytics products tailored to the cryptocurrency derivatives market.

  • Liquidity Metrics

    The most granular order book data in the industry optimized for quantitative analyis.

  • Trade Volume

    Centralized exchange data sourced from the most liquid venues, covering all traded instruments.

More From Kaiko Research