October Analyst Call: Forecasting Crypto Markets with IV

Altcoin Dominance Hits 4-Month High

Bitcoin

Stablecoin

24/07/2023

Welcome to the Data Debrief!

The SEC finally responded to the Ripple ruling, asserting the case was “wrongly decided,” contributing to a slight pullback for altcoins amid a wider rally. In other news, Arkham officially launched their token, Nasdaq halted plans for custody, and SBF’s brother wanted to buy an island nation. This week, we explore:

  • Bitcoin vs. Altcoin volume dominance on CEXs.

  • The GHO and ARKM token launches.

  • Rising concentration of volume on CEXs.

  • Bearish bets against Binance’s BNB token.

Trend of the Week

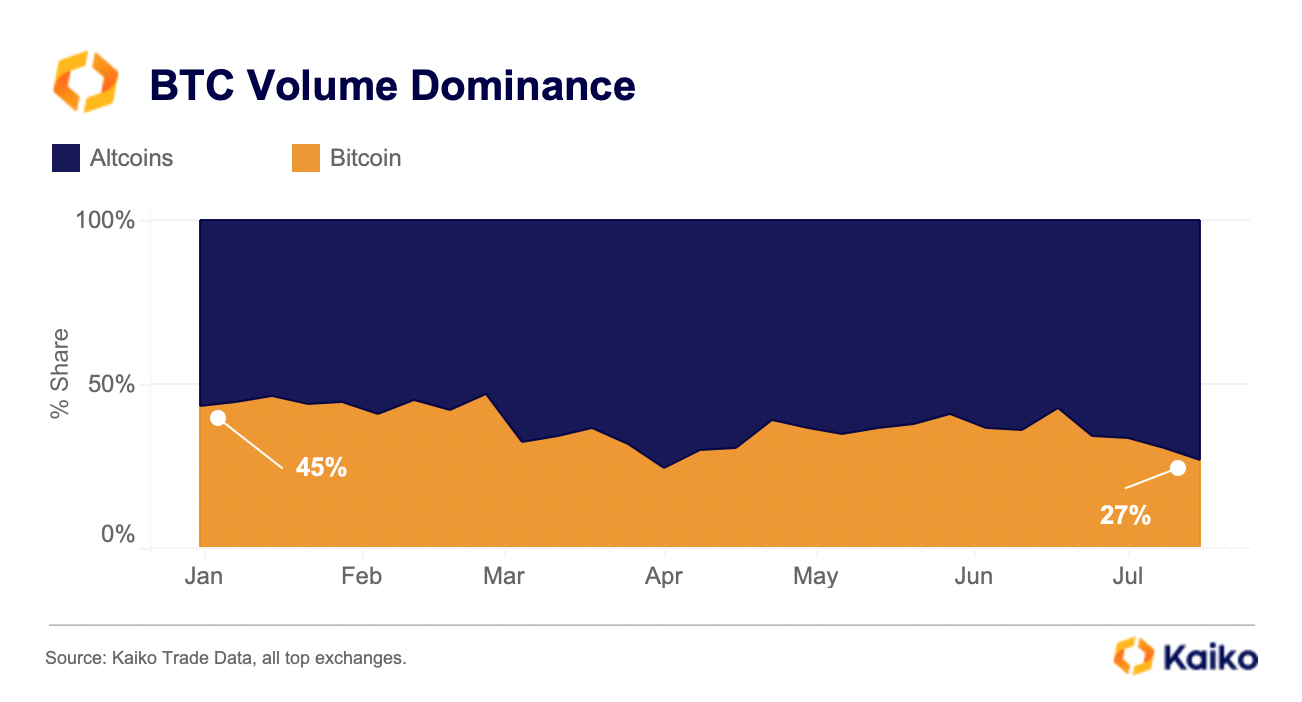
Bitcoin volume dominance plummets amid altcoin rally.

BTC volume dominance has slipped 8% since the start of July following the Ripple ruling, which instantly caused altcoin markets to rally. BTC dominance across the top 25 centralized exchanges is currently at its lowest level since April, at 27%.

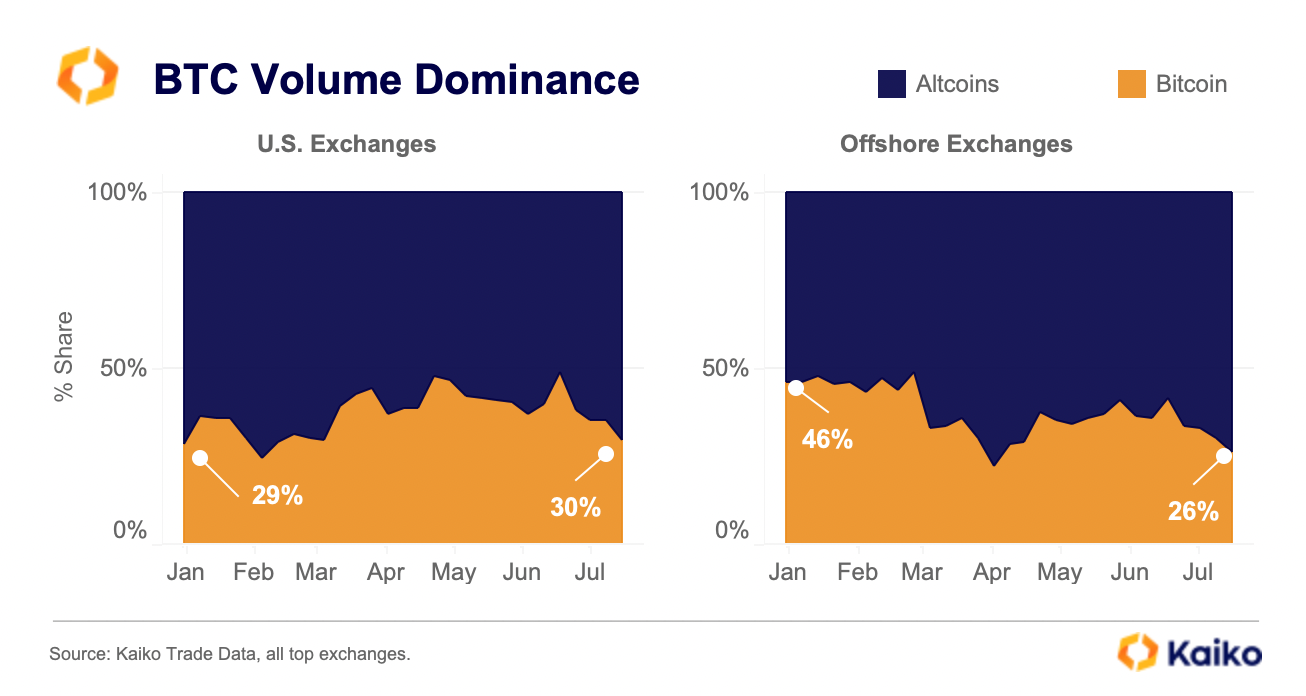
Offshore exchanges have experienced a more extreme drop in BTC trading activity, partially due to a spike in South Korean altcoin volume. Since the start of 2023, BTC dominance has fallen by 20%. On U.S. exchanges, altcoins have also gained traction over the past month, which suggests the regulatory crackdown has not yet dampened demand.

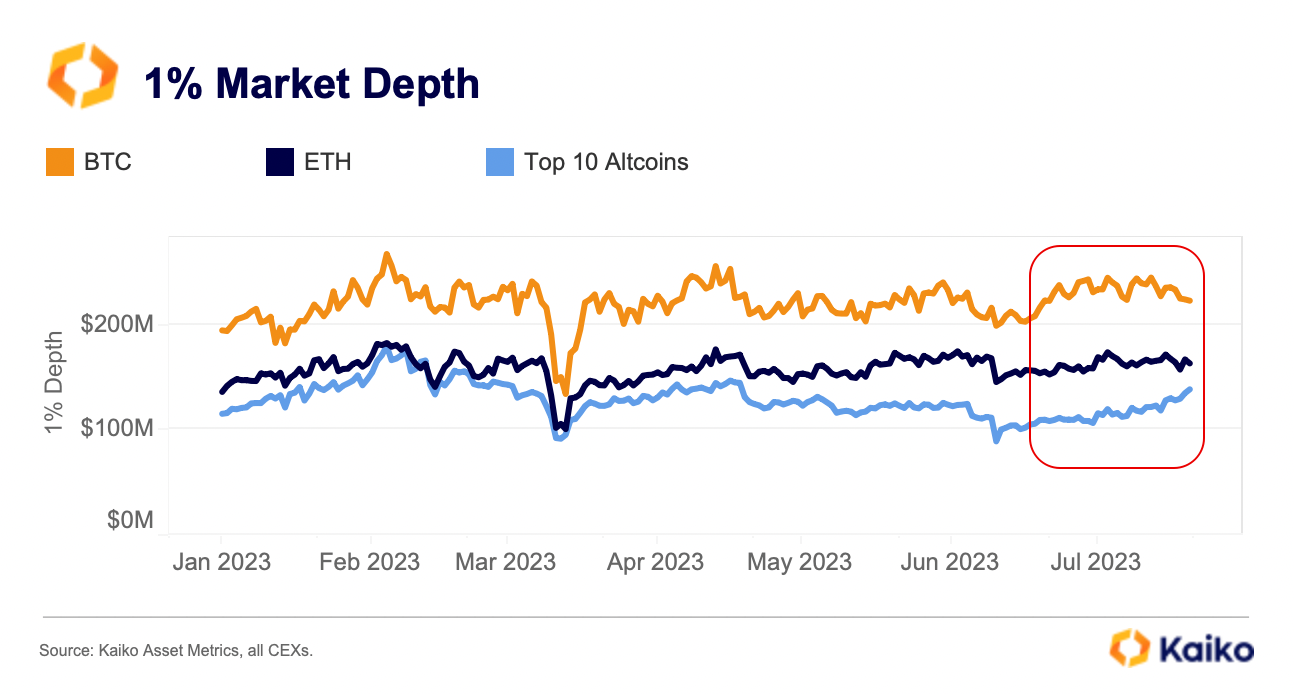
Altcoin liquidity, as measured by 1% market depth, has also seen a slight increase since the start of July. Kaiko’s market depth data aggregates bids and asks on all order books for an asset across all centralized exchanges in our coverage, thus providing a comprehensive gauge for an asset’s liquidity.

Since the start of July, 1% market depth for the top 10 altcoins by market cap has increased by ~$20mn. This measure includes price effects due to the rally, and when eliminating USD price increases for these assets, liquidity is about the same.

Overall, with several new tokens launching and a wave of project updates, we could be experiencing the beginnings of a turnaround for altcoins.

Never Miss an Analysis

Price

Two new tokens join the cryptoverse.

Last week saw the launch of two new tokens: Aave’s decentralised stablecoin GHO and crypto data startup Arkham’s ARKM. Arkham’s launch was perhaps the biggest token event since the Arbitrum airdrop in Q1. Later today, WorldCoin (WLD) will launch, so stay tuned for our analysis next week.

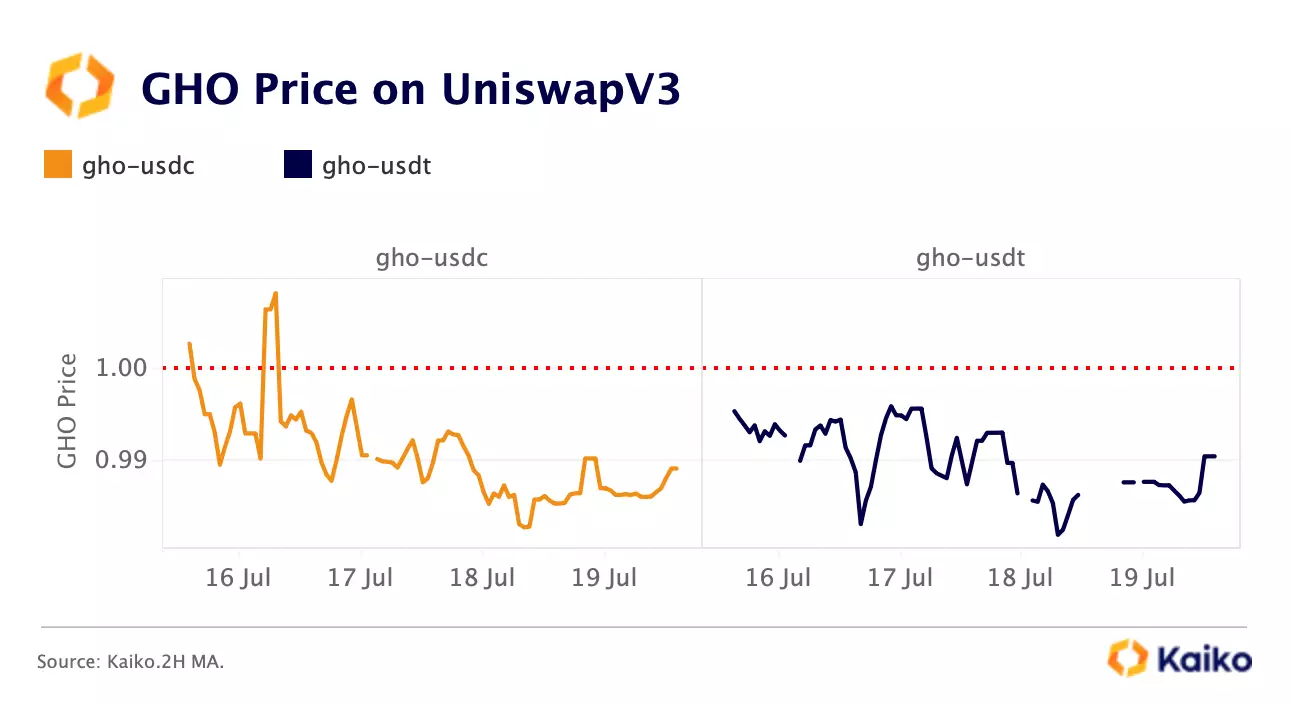
Aave’s decentralized GHO stablecoin, which was deployed on Aave’s V3 marketplace, hit $2.5mn in market cap just two days after its launch. The stablecoin is pegged to the U.S. Dollar and overcollateralized, and is minted by supplying assets listed on Aave V3 as collateral, including ETH and Aave’s own token AAVE.

In the days following its launch, it traded with scarce liquidity and at a discount relative to USDT and USDC on Uniswap V3. Overcollateralized stablecoins are inherently less capital efficient and often struggle against their more centralized counterparts. Today, USDT and USDC dominate both CEX and DEX activity, so it remains to be seen how GHO will carve a niche in a competitive space.

Like most token launches, Arkham’s was not without a bit of controversy. The token, which is branded as “intel-to-earn”, accompanies a new platform for buying and selling on-chain data about the owners of anonymous crypto wallet addresses. Many in the industry expressed concern about the ethics of such a platform.

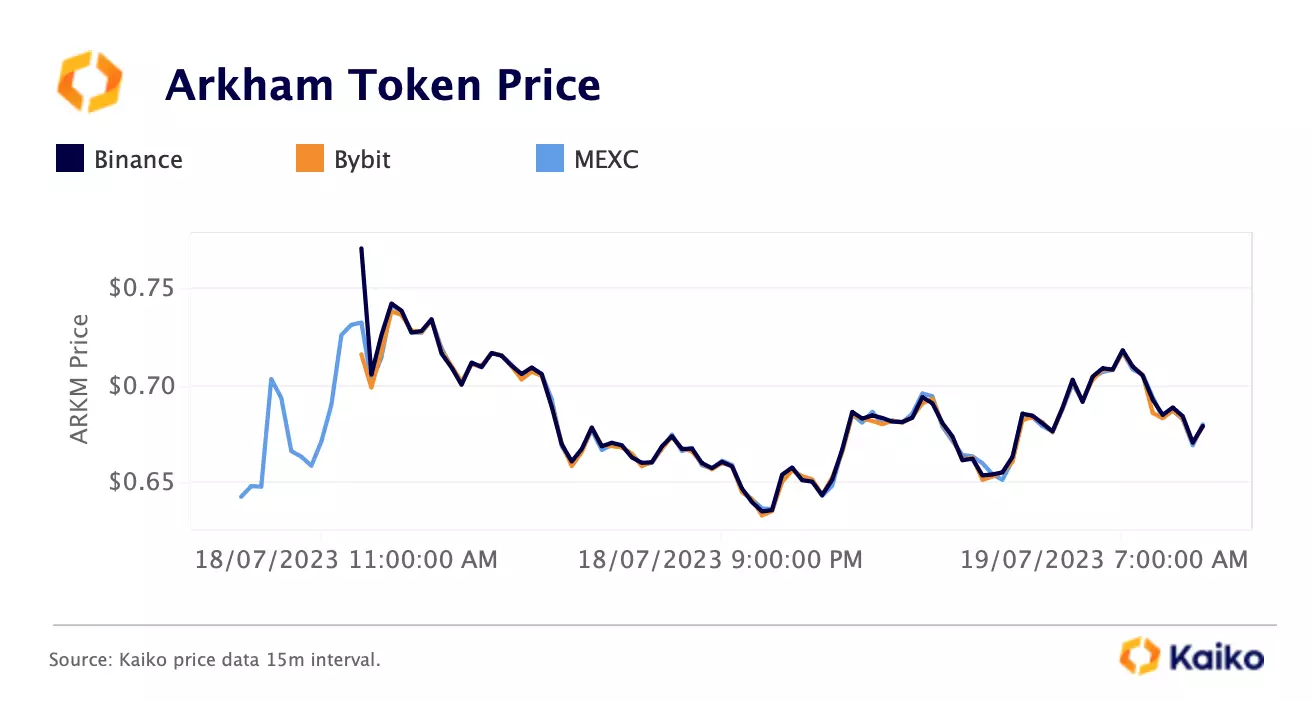
ARKM was first available on Binance Launchpad at an initial price of $0.05. Binance implemented a special opening price limit mechanism designed to prevent excessive price fluctuations during the first five minutes of trading.

On July 18, ARKM started trading well above its initial price on several centralised platforms. Its price on Binance shot up to $0.77, diverging from MEXC and Bybit. ARKM is down by over 20% in the days following its launch as traders took profit.

Liquidity

USDT market cap rises in Q2 despite lacklustre volume.

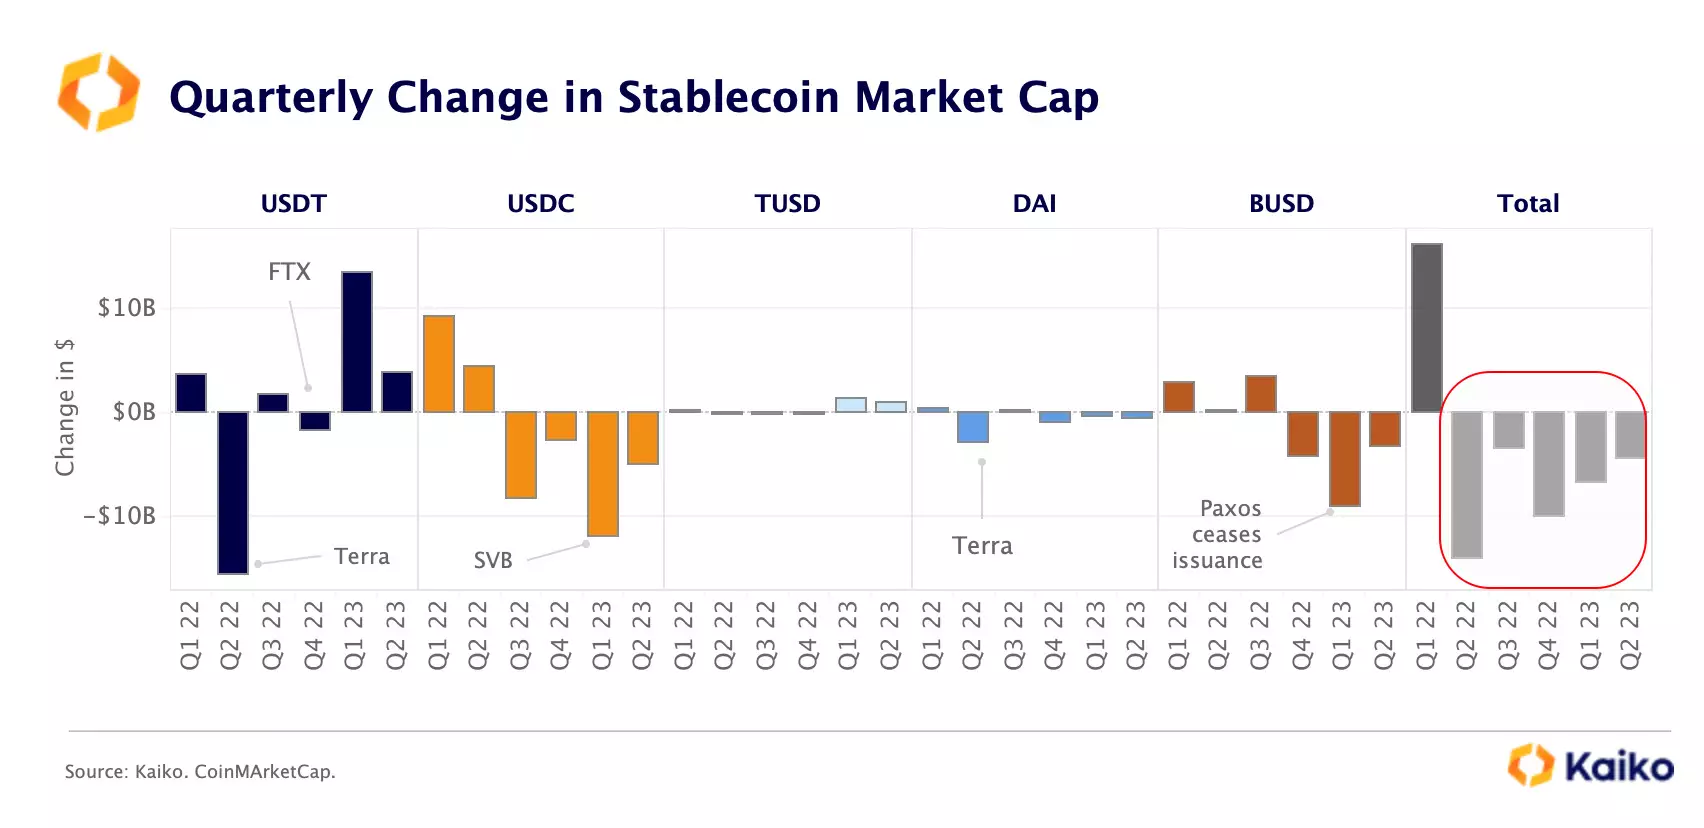
Tether’s market cap continued rising in Q2, the second quarter in a row, hitting an all-time high of over $83bn in early June. However, this increase has not been enough to offset a decline in the total market capitalization for stablecoins, which dropped for a fifth consecutive quarter in Q2, led by BUSD and USDC.

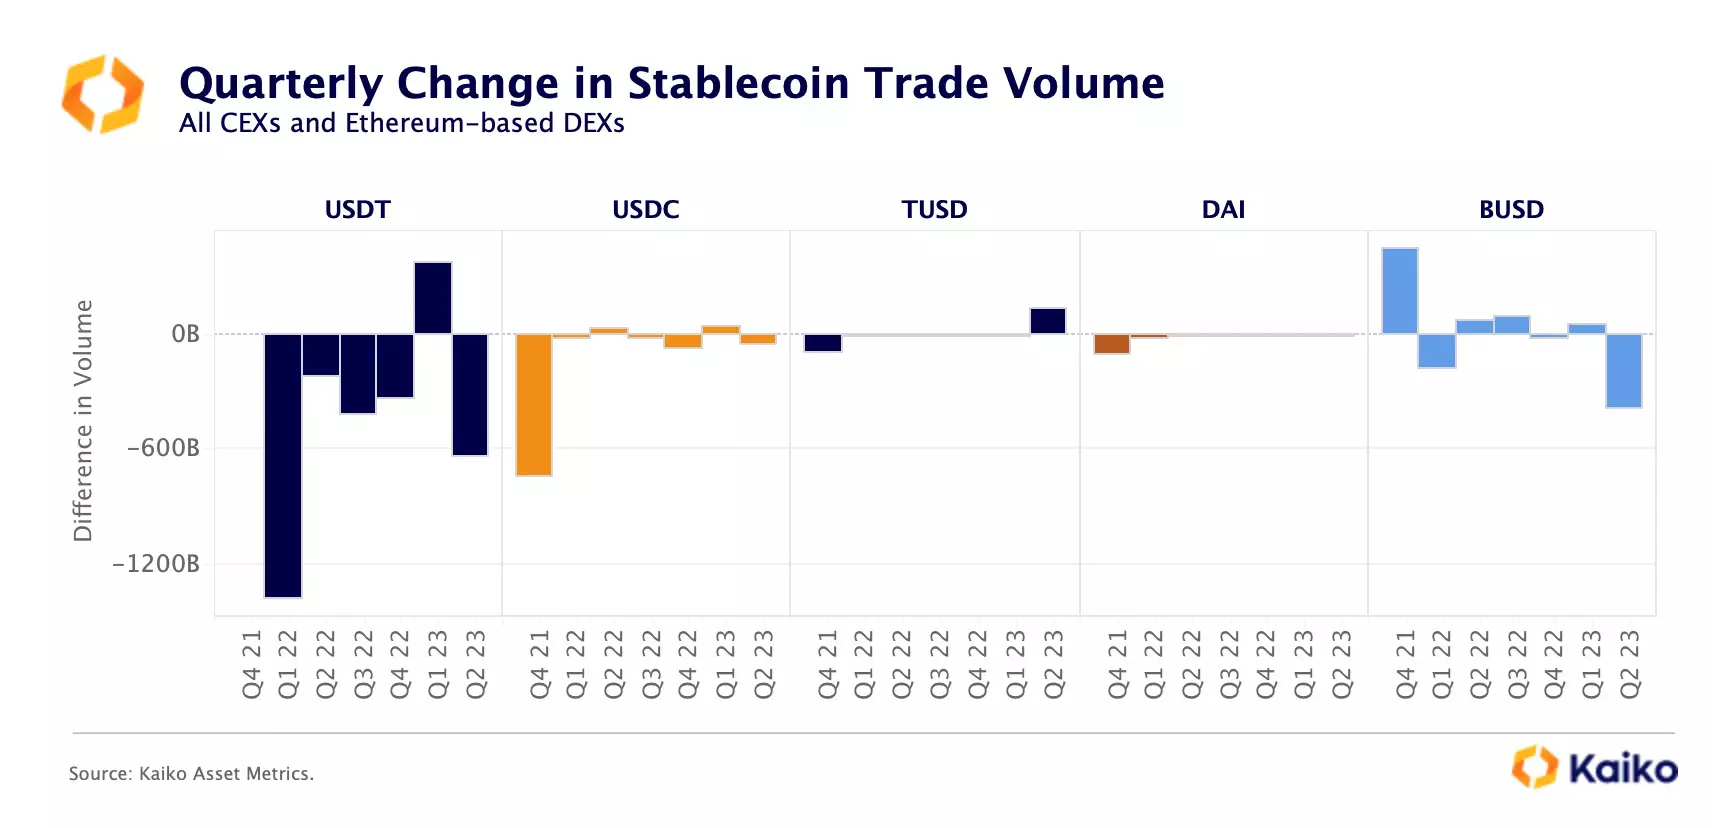
The increase in USDT issuance has been driven by growing demand on Tron – which offers lower fees relative to Ethereum. However, the low fees don’t fully explain why over 60% of USDT’s supply is currently held on Tron and less than 40% on Ethereum, especially considering the vast majority of on-chain crypto activity happens on Ethereum. Also, USDT trade volumes dropped by ~$600bn in Q2 while its market cap increased ~$4bn.

Overall, stablecoin trading activity on CEXs and Ethereum-based DEXs remained lacklustre over the past few months, with all of the top five stablecoins except for TUSD registering a decline in trade volumes in Q2 relative to the previous quarter.

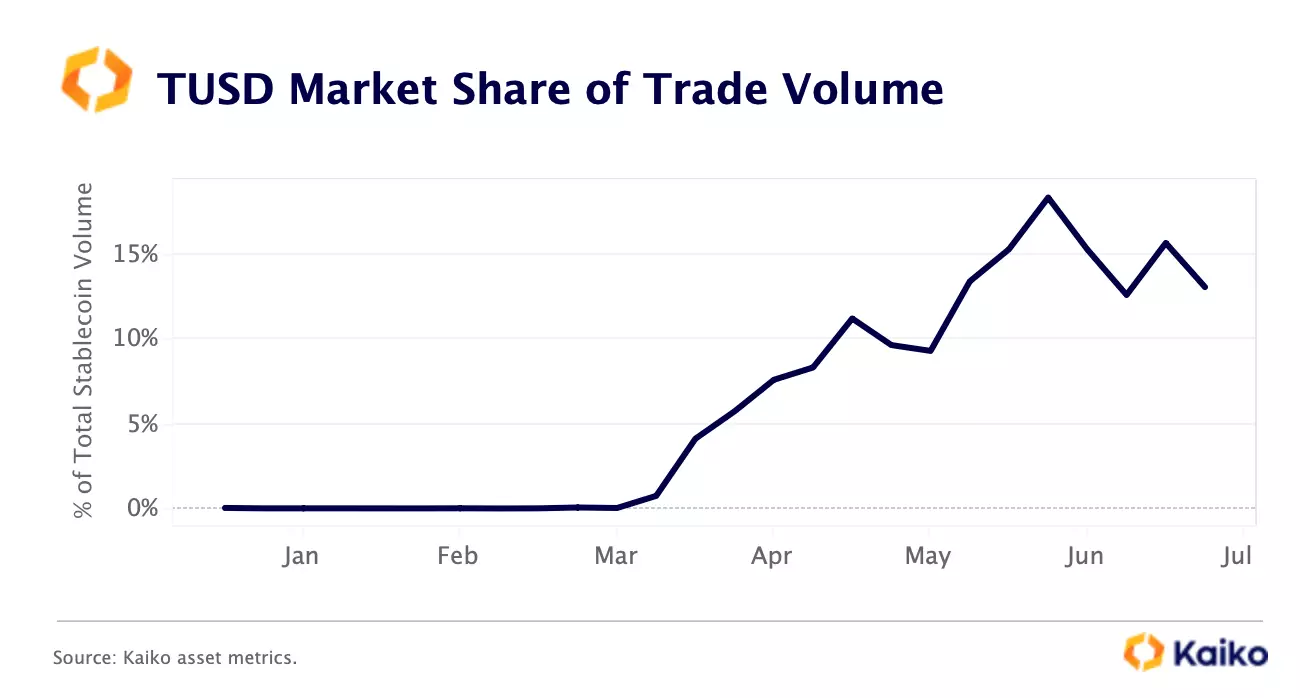
TUSD has bucked the trend almost entirely due to Binance’s new zero-fee trading promotions for several TUSD-denominated pairs, which has caused volumes to surge. However, while its market share on CEXs hit an all-time high of 20% at the end of May, it has been trending downwards since June following the collapse of Prime Trust, one of TUSD’s technology partners.


Japanese exchanges see strong growth in H1.

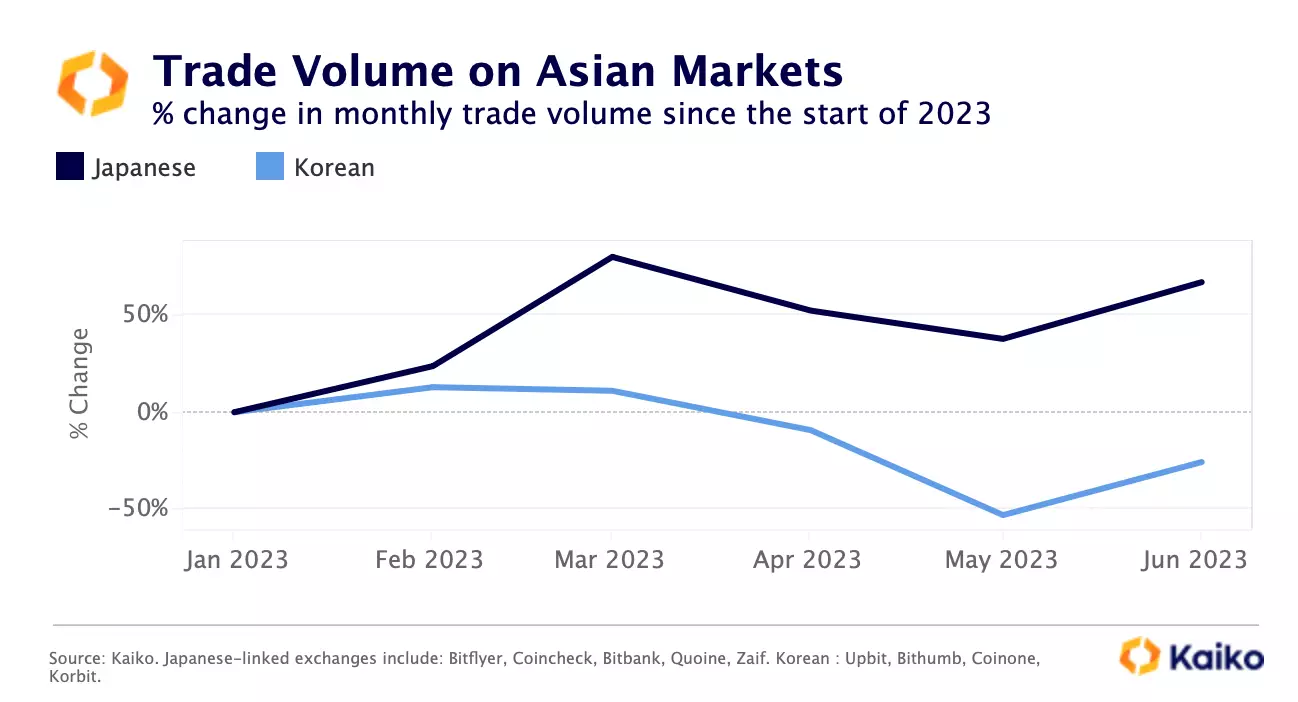
Crypto trade volume on Japanese exchanges jumped by over 60% last month relative to the start of the year, boosted by rising BTC prices and Yen volatility. In contrast, Korean exchanges have lost steam since April, with volumes declining by 26% YTD in June (note that Korean exchanges overall have much larger trade volumes). This could be explained by the different market structures of these regions.

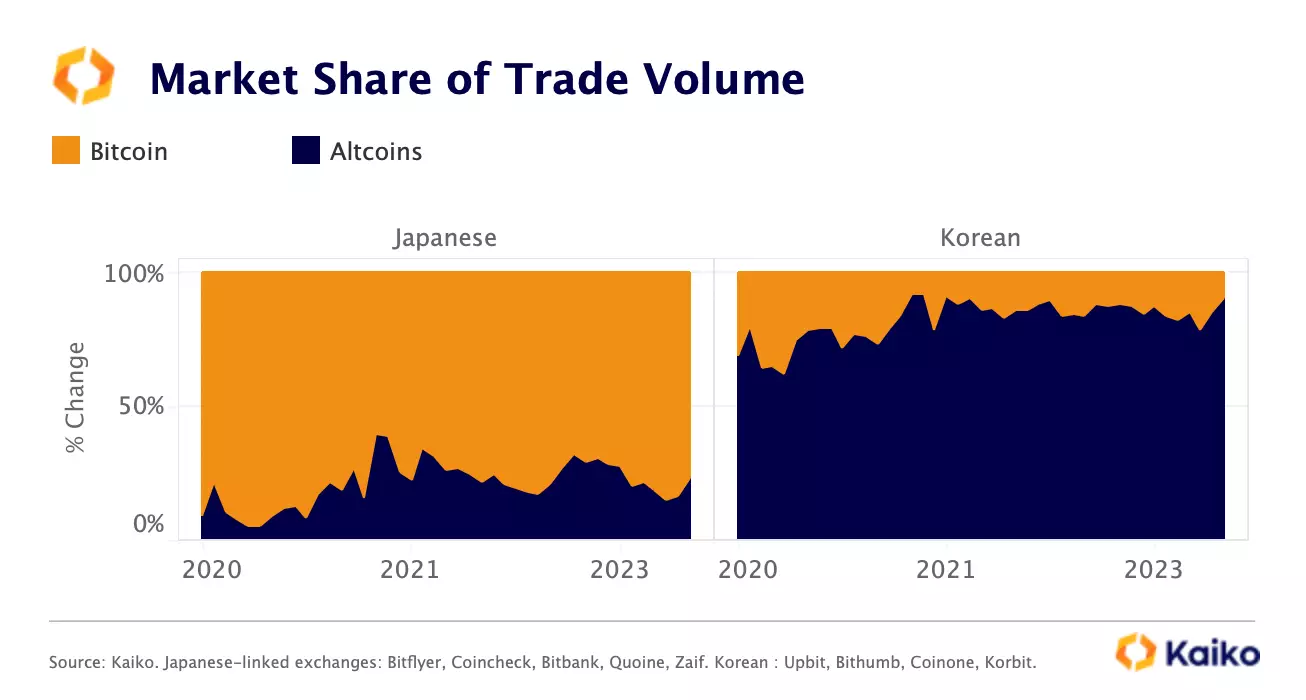
On Japanese exchanges, BTC accounts for more than 80% of trade volume while on Korean exchanges altcoins account for the vast majority of volume (this Twitter thread has some interesting theories as to why).

BTC undeniably led the Q2 crypto rally causing relative volumes to surge, which could explain why Japanese-exchange volume saw bigger gains. So far in Q3, altcoins have dominated, so we could expect a reversal of this trend.


Crypto markets are increasingly concentrated.

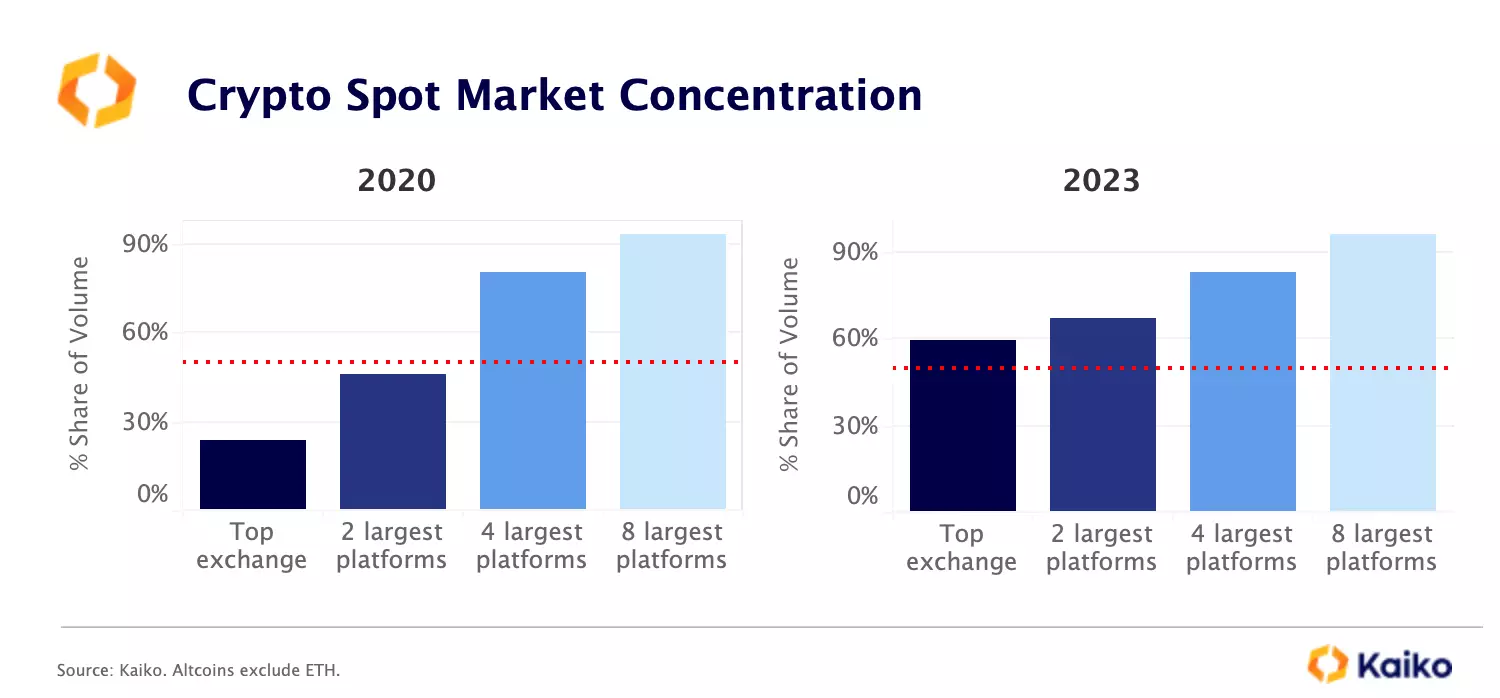
Crypto markets have become more concentrated over the past three years, with the bulk of trading activity in 2023 happening on just one exchange — Binance. In contrast, back in 2020, the largest trading platform accounted for only 24% of the total global trade volume, while the combined trade volumes of the two largest platforms was still below 50%. This trend could continue amid a wider downturn in market activity, which puts pressure on smaller exchanges.

Asset Metrics:

The Ultimate Liquidity Toolkit

Asset Metrics provides the most comprehensive liquidity data for an asset, aggregating data across all pairs and exchanges. This product gives you a global understanding of an asset’s market structure. 

  • Trading activity: global volumes for thousands of instruments

  • Liquidity: market depth from .01% to 10% aggregated across order books

  • Addresses: distribution of an asset’s supply across a network

  • Coverage: all assets and exchanges covered by Kaiko

Derivatives

Traders turn bearish on Binance.

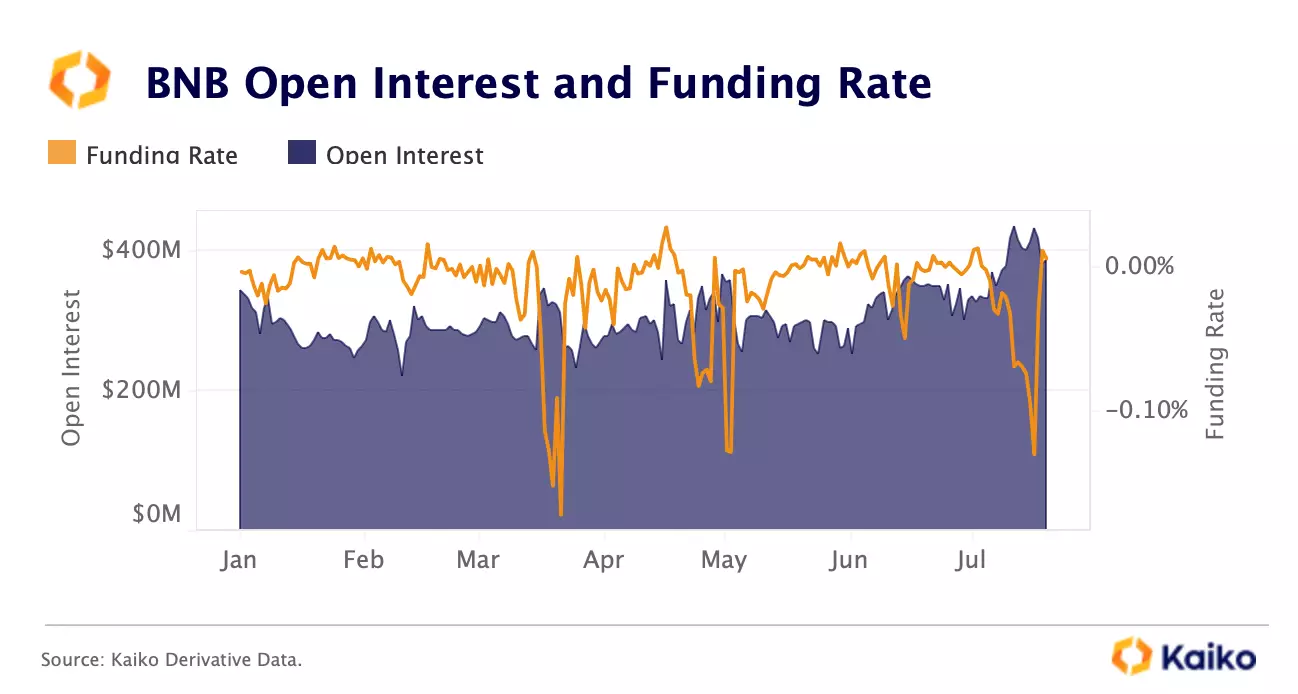
Binace’s BNB token open interest hit its highest level since the collapse of FTX this month as bearish bets on the exchange intensified amid rumors of mass layoffs. Last week, BNB funding rates fell to their lowest levels since the U.S. banking turmoil in March before recovering to more neutral levels.

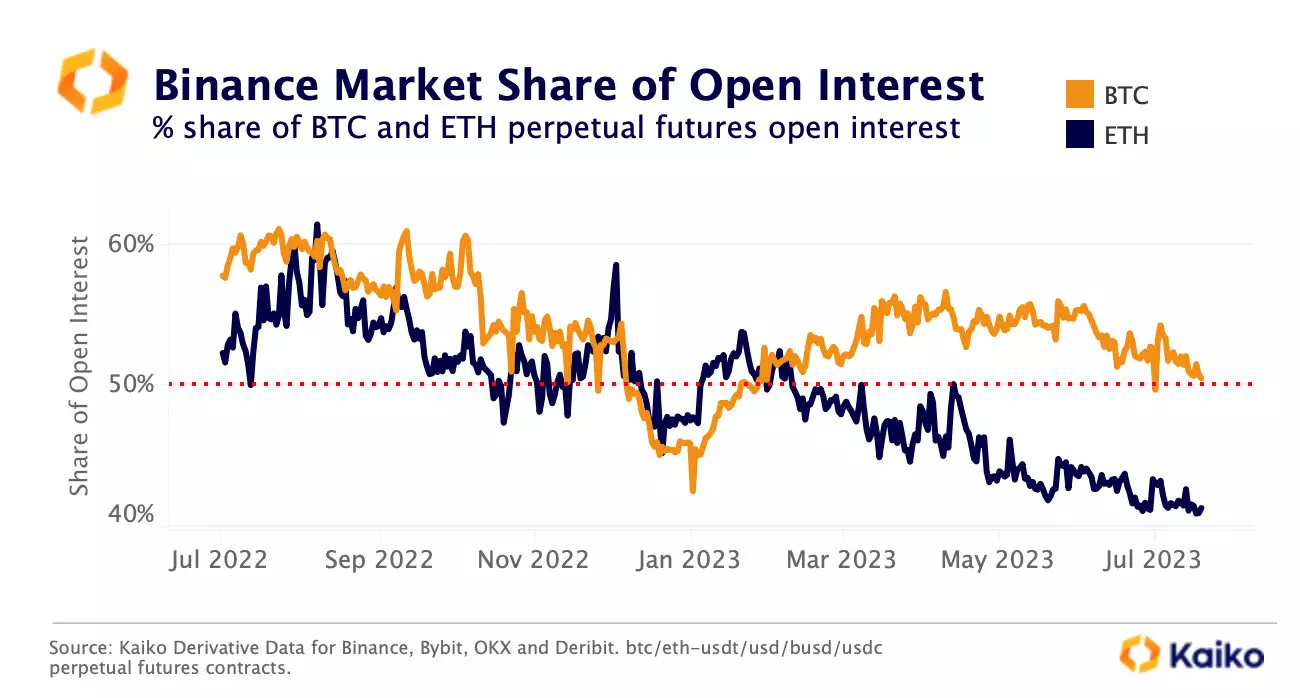
Binance has been losing dominance on both spot and derivative markets this year. Its market share of ETH open interest fell to 41% in July, down from 55% a year ago.

Its share of BTC open interest also declined to 52% down from 60% over the same period. The trend mirrors growing competition on offshore markets with smaller exchanges such Bybit and OKX gaining momentum.

Macro

BTC inverse correlation with the U.S. Dollar weakens.

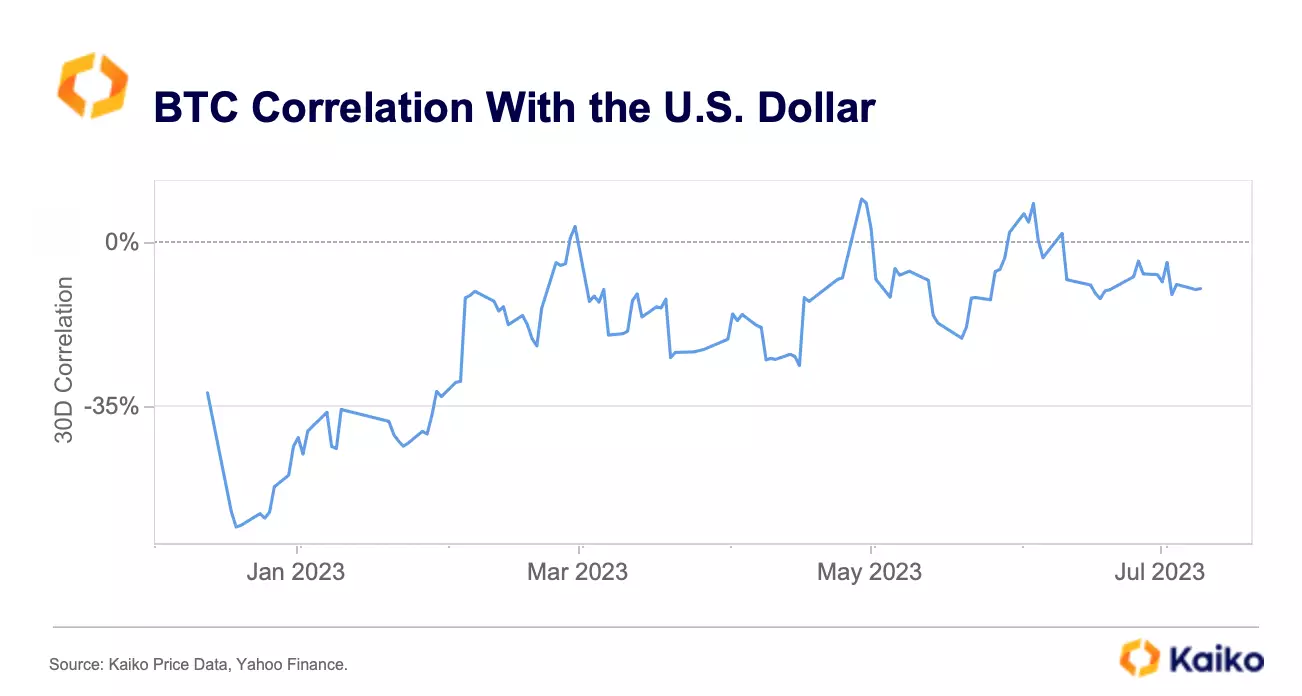
The historical inverse correlation between BTC and the U.S. Dollar has weakened significantly this year, from -60% to -10%. The shift comes as the U.S. Dollar index (DXY) fell below the 100 mark in July for the first time since April 2022 after softer than expected U.S. inflation data boosted hopes that the Fed is nearing the end of its hiking cycle.

Although the DXY saw some recovery last week supported by UK disinflation and dovish comments from ECB officials, it remains well below its September 2022 peak of over 114. It is notable that while this shift in correlation may not be a long lasting trend, it has coincided with a sustained decline in the share of USD-denominated BTC trade volumes. The share of BTC traded against USD fell from 77% of total BTC-fiat volume in Oct 2022 to 64% in July.


Bitcoin shows resilience to rising real yields.

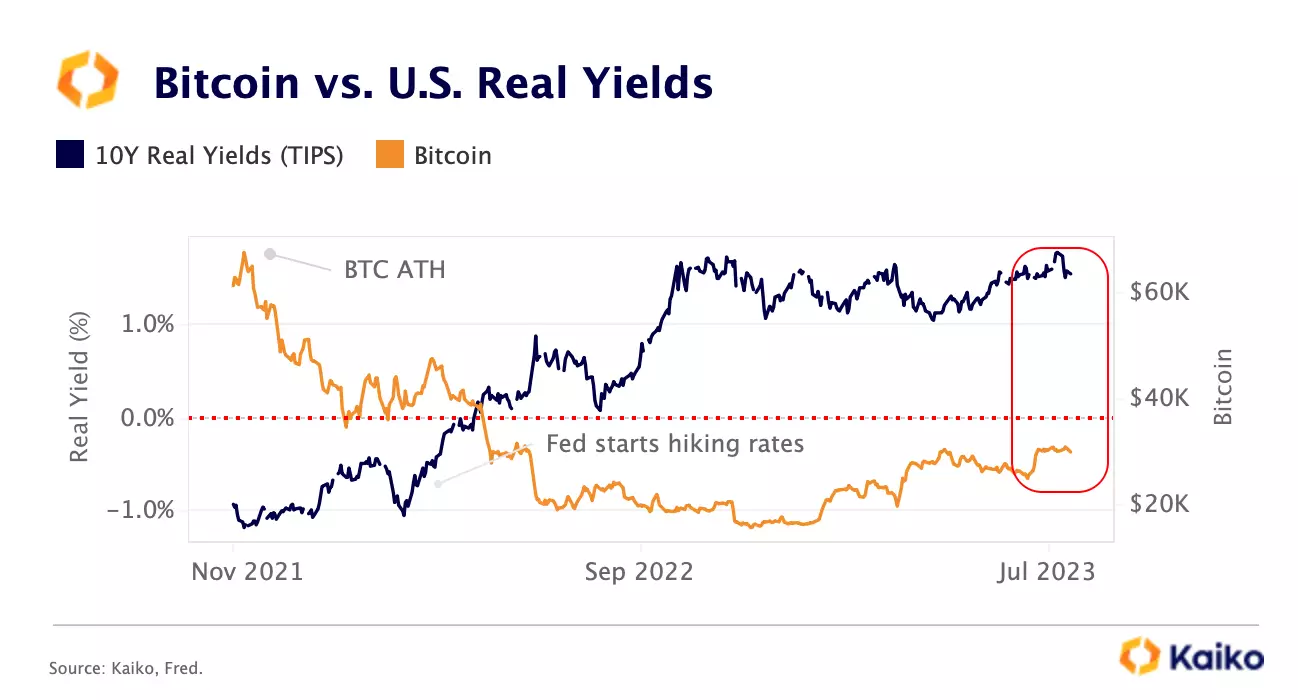
U.S. real yields as measured by the 10-year inflation-protected securities (TIPS) rebounded over the past few months, hitting a multiyear high of 1.8% in July. Rising real yields typically make risky assets less attractive on a relative basis, as investors can earn higher return on low-risk treasuries.

While BTC has historically moved in the opposite direction to real yields, it has proven resilient to the recent rise in yields, gaining 20% since June when yields rose from 1.1% to 1.8%. This could be partly explained by improved expectations of future inflows following the wave of BTC spot ETF applications in July. Overall, this means that BTC could perform better than expected in a ‘higher for longer’ rate environment.

Data Used in this Analysis

  • Derivatives Metrics

    Analytics tailored to the cryptocurrency derivatives market.

  • Asset Metrics

    Aggregated trade and order book data across all exchanges.

  • Trade Volume

    Centralized exchange data sourced from the most liquid venues, covering all traded instruments.

More From Kaiko Research