Sign up for Free Kaiko Research


A Cheatsheet for Bid Ask Spreads
Written by Conor Ryder, CFA
01/06/2023

Welcome to Deep Dive!
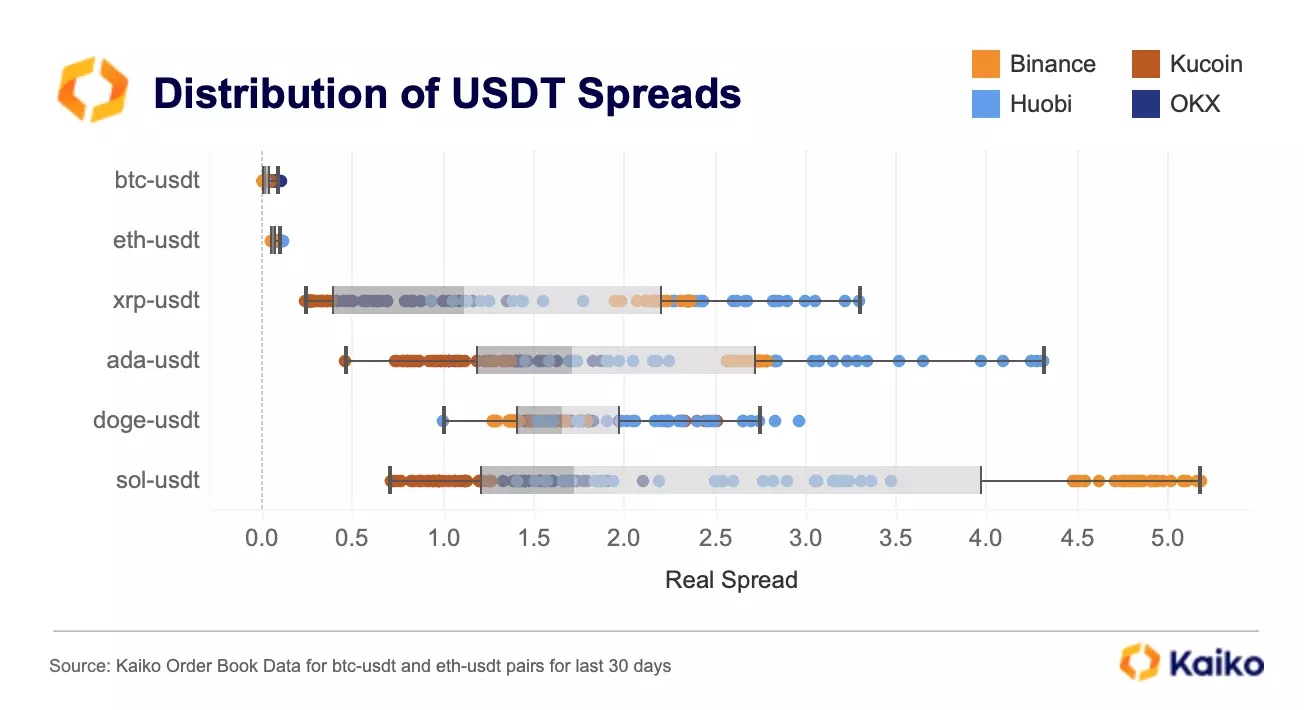
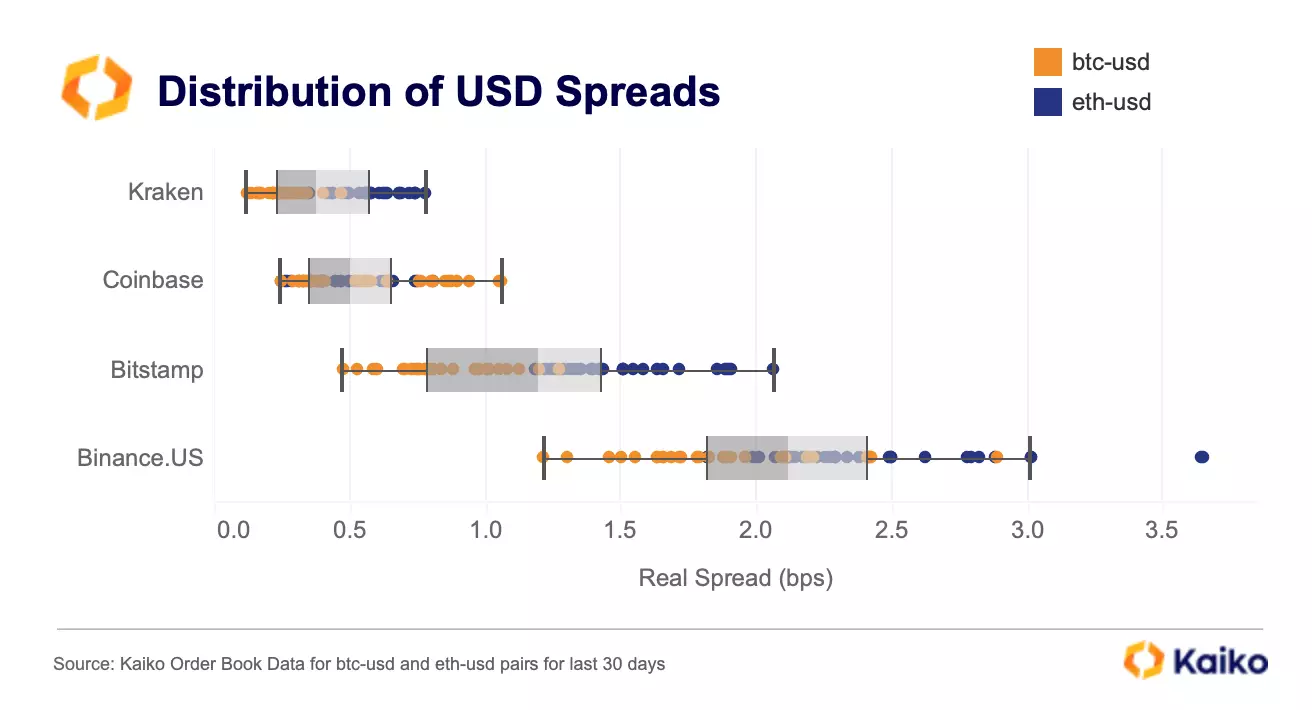
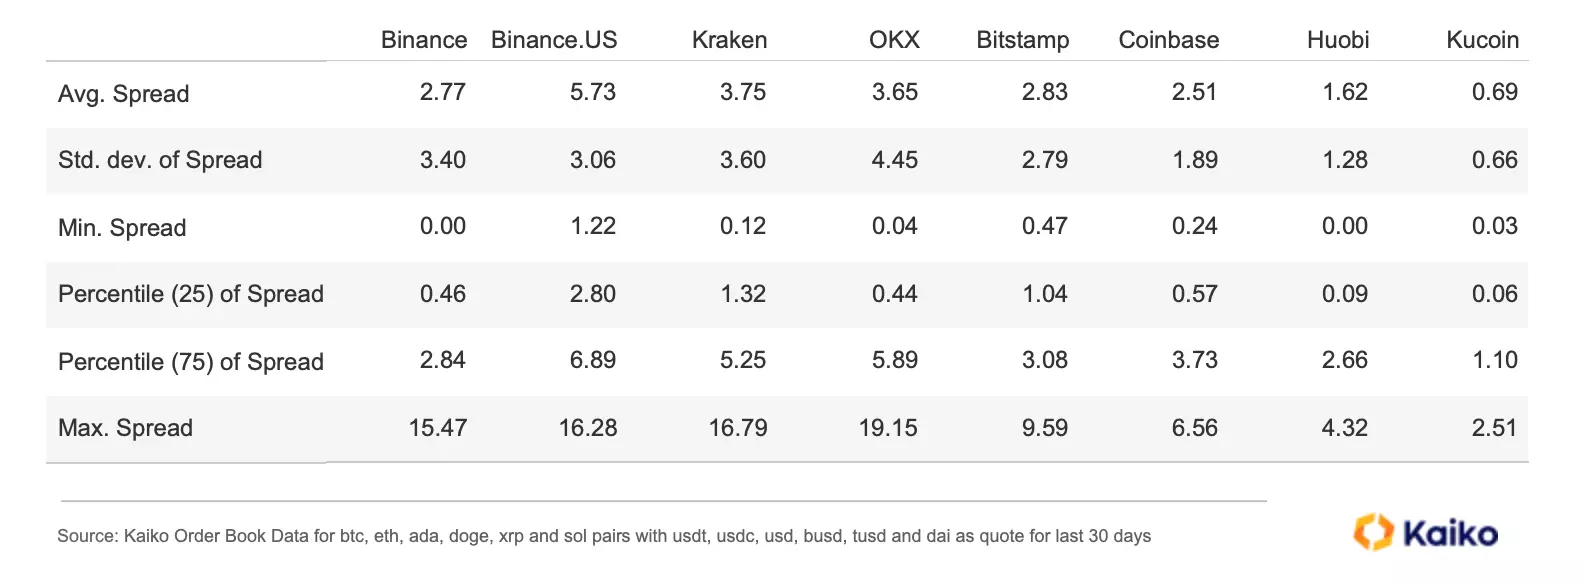
This week we’ll take our first in-depth look at Bid-Ask spreads on centralized exchanges, an under-appreciated indicator of liquidity. We’ll use some distribution analysis to examine which exchanges, stablecoins and pairs have the tightest and widest range of spreads in an environment where liquidity has become a premium in markets.


More From Kaiko Research
![]()
Hyperliquid
09/03/2026 Data Debrief
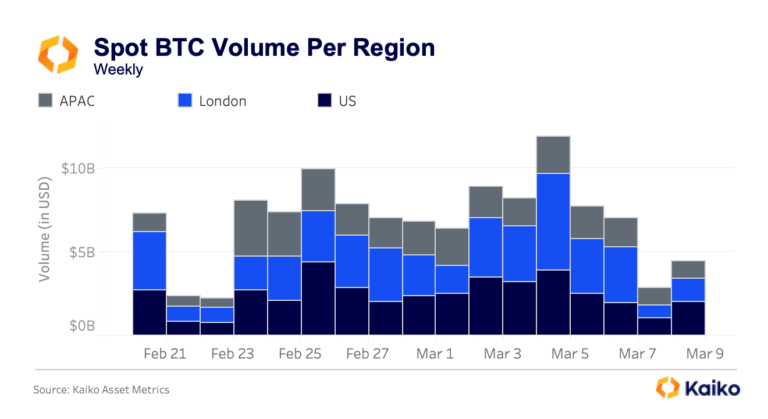
Bitcoin Ranges While Traditional Assets Find New Home on Crypto RailsAs Bitcoin ranges between $60k and $72k following the early February sell-off, the crypto market navigates competing forces, with geopolitical shocks testing 24/7 infrastructure and options markets pricing elevated volatility into the Federal Reserve’s March 18th decision.
Written by Laurens Fraussen![]()
Ethereum
02/03/2026 Data Debrief
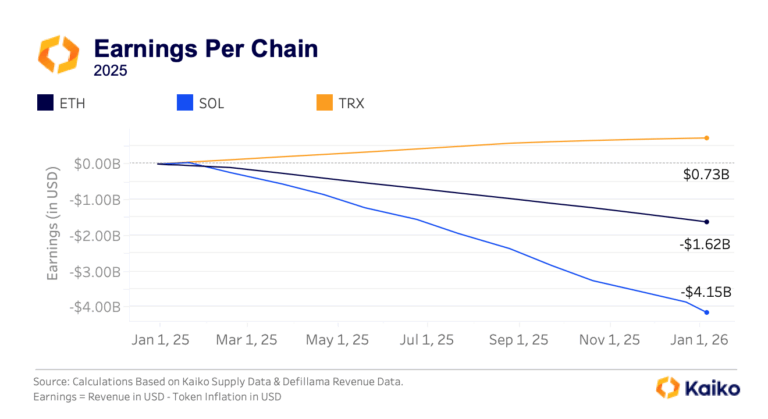
The Pressure of Dilution on Layer 1 ValuationsAs Layer 1 tokens are increasingly traded through ETFs and evaluated like equity investments, the market is discovering an uncomfortable truth, most major blockchains operate as loss-making businesses. With Ethereum posting $1.62B in annual losses and Solana bleeding $4.15B despite generating hundreds of millions in fee revenue, validator dilution costs consistently outpace income by 7-25x.
Written by Laurens Fraussen![]()
Ethereum
23/02/2026 Data Debrief
Staking Products Launch Despite Treasury FailuresAs crypto volatility continues, the markets are testing whether institutional ETH adoption follows price or infrastructure development. With ETH plunging 50% from its mid-2025 peaks to $2,000, this triggered a 95%+ collapse in equity treasury vehicles like ETHZilla and $4B in spot ETF outflows.
Written by Laurens Fraussen![]()
Prediction Markets
16/02/2026 Data Debrief
Prediction Markets Liquidity In FocusPrediction markets captured mainstream attention throughout 2025 as Polymarket processed over $2 billion in election-related volume. The post-election collapse from $1 billion to $200 million in open interest exposed fundamental questions about sustainability.
Written by Laurens Fraussen