Now Available: Q2 2024 Crypto Market Report

USDC leads demand for regulated stablecoins

Stablecoin

08/07/2024

    Welcome to the Data Debrief!

    Welcome to the Data Debrief! Last week Bitcoin dropped below $54K for the first time since February as Mt Gox started repayments to creditors. In other news, stablecoin issuer Circle became MiCA-compliant and the German government has been selling BTC. This week, we’ll be exploring:

    • MiCA-compliant stablecoin volume

    • BCH sees strong selling as Mt Gox starts repayments

    • ETF flows and volatility plummet


    Trend of the Week

    USDC leads demand for regulated stablecoins.

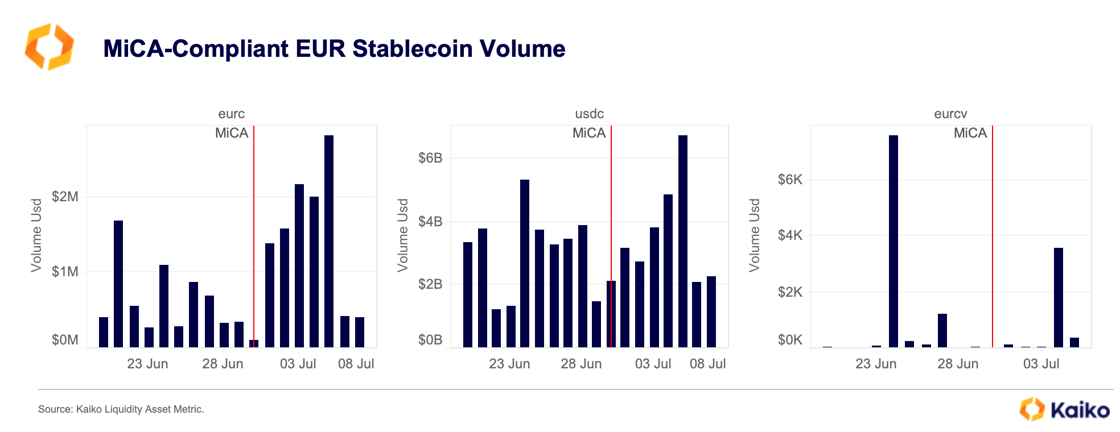
    Last week, Circle announced its compliance with the European Markets in Crypto-assets Regulation (MiCA), followed by SocGen’s Forge, the issuer of Euro Convertible. MiCA, which came into force on June 30 in Europe, imposes various requirements on stablecoin issuers, including whitepaper publication, governance, reserves management, and prudential standards.

    Since June 30, Circle’s EURC and USDC saw the strongest increase in daily trading volume. SocGen’s EURCV, which lifted its whitelisting restrictions also experienced increased volume. However, it remained modest at just $4K possibly due to its availability solely on one exchange, Bitstamp.

    Screenshot 2024-07-08 at 12.15.10 PM

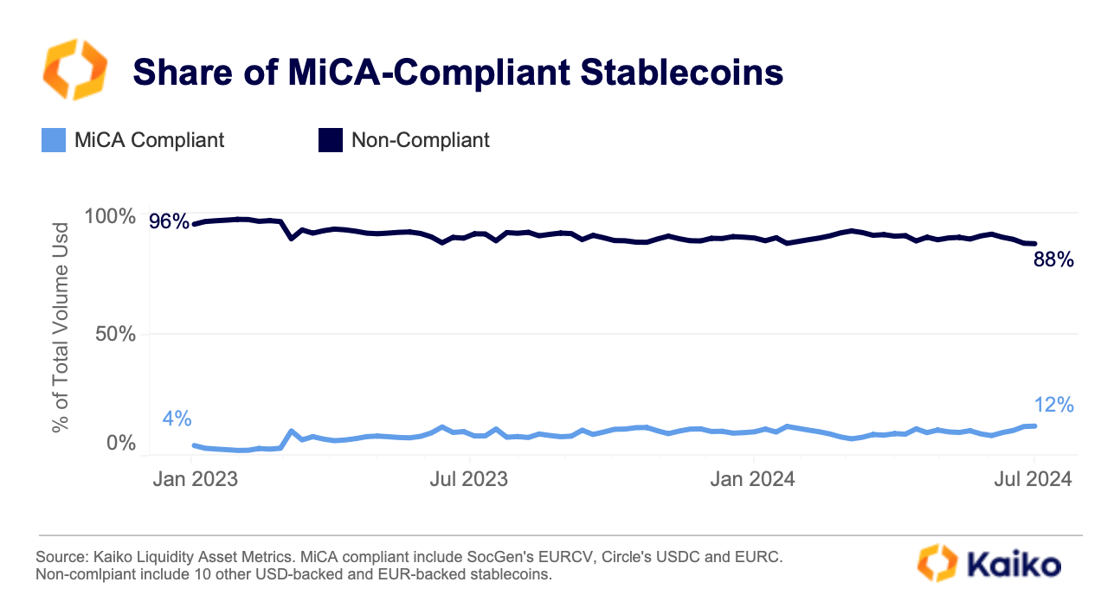
    Currently, non-compliant stablecoins dominate the market, accounting for 88% of the total stablecoin volume. MiCA could shift this balance as exchanges and market makers favor compliant stablecoins over non-compliant alternatives. Major crypto exchanges like Binance, Bitstamp, Kraken, and OKX have already implemented restrictions, delisting non-compliant stablecoins for their European customers.

    On the other hand, the share of compliant stablecoins has increased over the past year, suggesting increased demand for transparency and regulated alternatives. So far, this trend has mostly benefited USDC.

    Screenshot 2024-07-05 at 3.57.30 PM

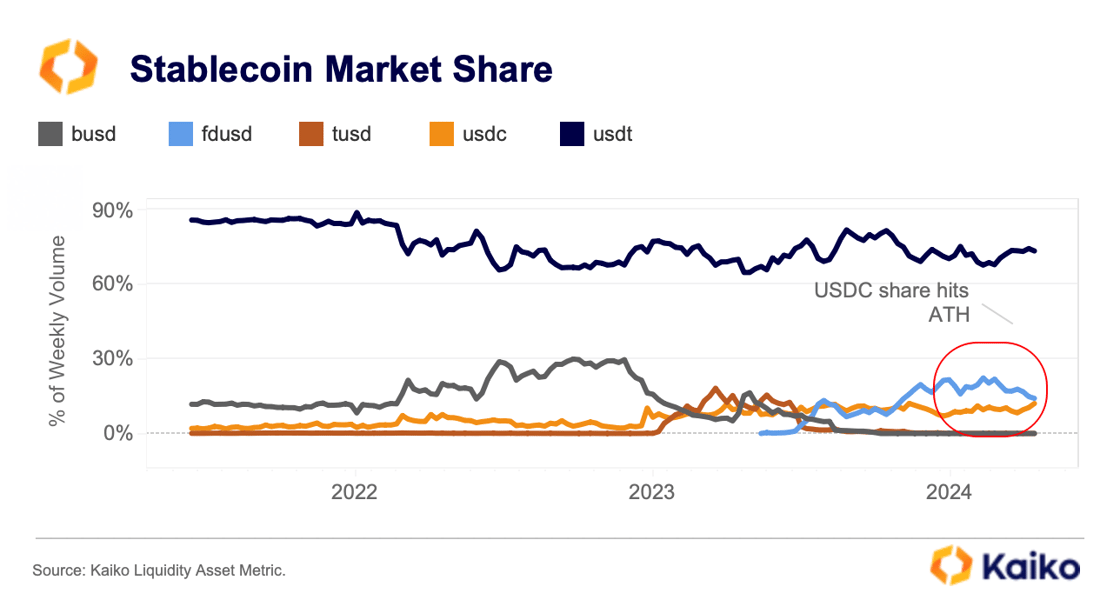
    In 2024 USDC saw its weekly trading volume surge to $23 billion, up from $9 billion in 2023 and $5 billion in 2022. As a result, USDC’s market share recently reached a record high, nearing FDUSD’s 14%.

    Screenshot 2024-07-05 at 3.57.44 PM

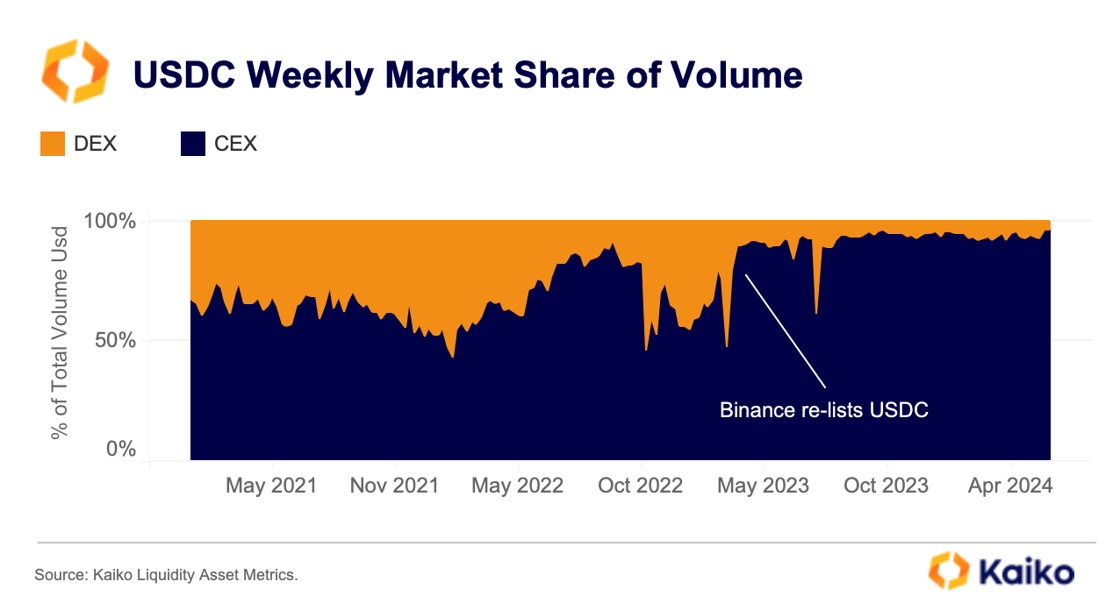
    Upon analyzing USDC’s surge between decentralized exchanges (DEXs) and centralized exchanges (CEXs), it appears that CEXs have played a crucial role in driving up USDC volumes over the past year.

    USDC’s market share on CEXs rose significantly after Binance re-listed it in March 2023, increasing from an average of 60% to more than 90% across all exchanges. Volumes have also risen on Bybit, which has offered zero-fee USDC trading since February 2023.

    Screenshot 2024-07-05 at 3.57.20 PM

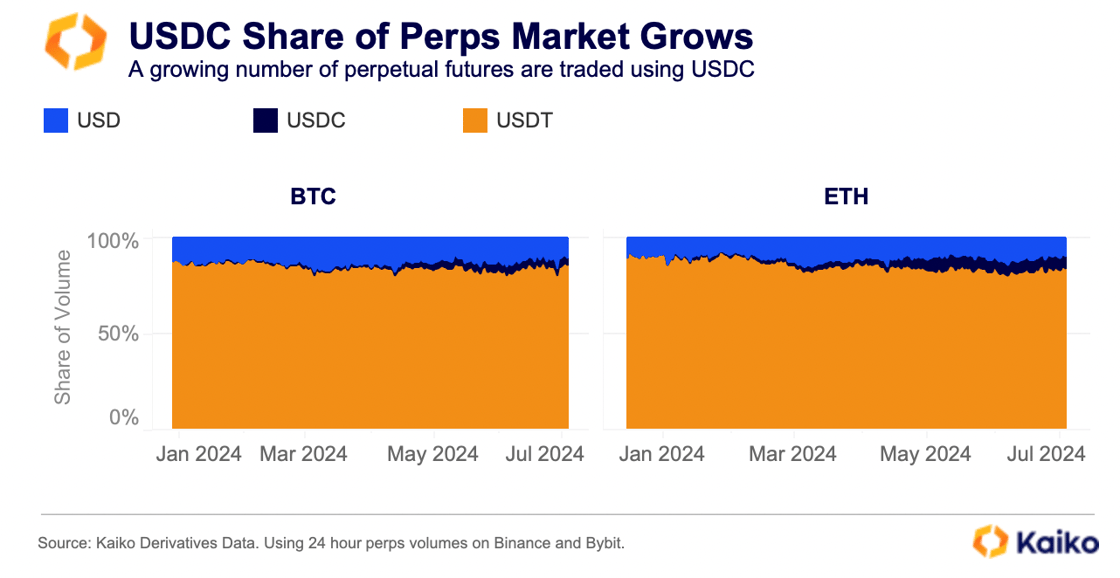
    Another factor contributing to this trend is the increased usage of USDC for perpetual futures settlement. The share of BTC perpetuals denominated in USDC, traded on Binance and Bybit, rose to 3.6% from 0.3% in January. USDC’s usage in ETH perpetuals trading was even higher, with ETH-USDC trade volume rising to over 6.8% from 1% at the beginning of the year. While USDC’s market share in these perpetual markets is just a fraction of USDT’s, its growing usage for perpetual settlement speaks to investors’ changing preferences as stablecoin regulations come into effect.

    Screenshot 2024-07-05 at 14.33.28

    Never Miss An Analysis

    Get our research twice a week, directly to your inbox.

    Data Points

    BCH sees strong selling as Mt Gox starts repayments.

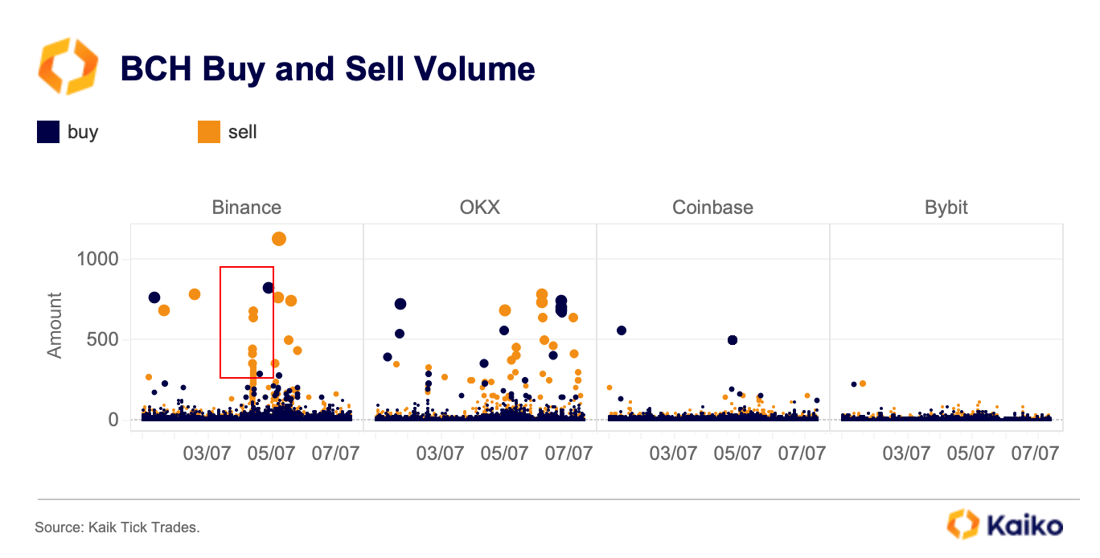
    On July 5, the Japanese exchange Mt. Gox trustee announced that it has begun repayments to creditors in BTC and BCH after ten years. While it is unclear how many investors will sell their holdings and on what venues, BCH has seen significant selling pressures.

    Interestingly, selling accelerated on Binance and OKX prior to the announcement at the end of Asian opening hours on July 4, with several sell orders being executed on Binance around 9 am UTC.

    Screenshot 2024-07-08 at 10.49.54 AM

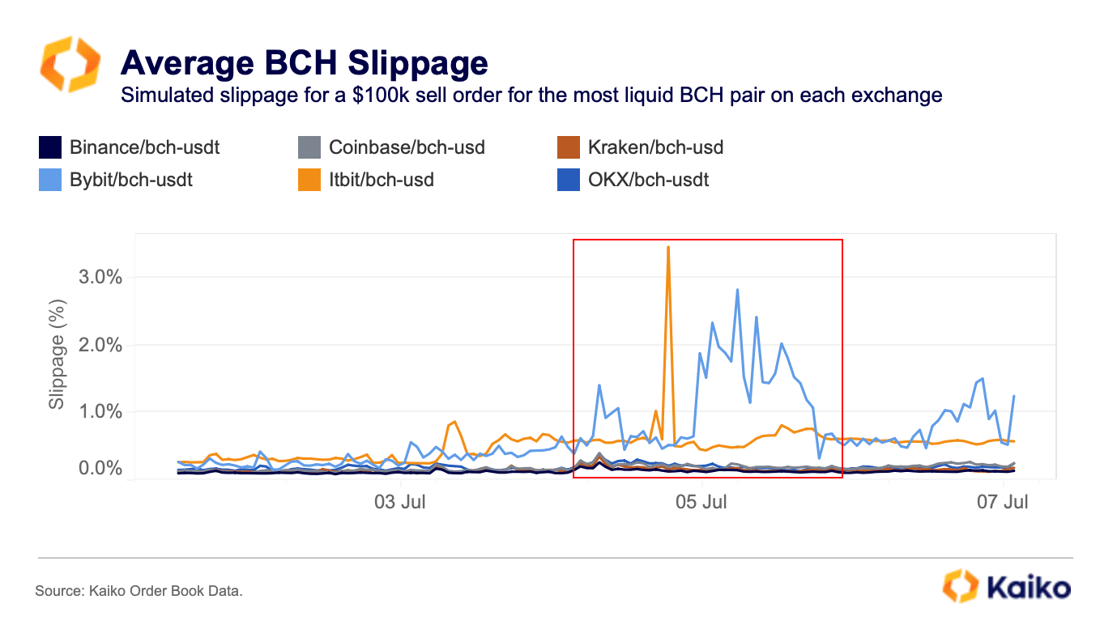
    Looking at BCH price slippage for a simulated $100k sell order, it reached its highest level in over a month on most exchanges, indicating worsening liquidity due to insufficient order book depth for large market orders. This coincided with strong selling pressure related to the Mt. Gox repayments event, with the highest slippage increase observed on Itbit and Bybit. On July 5, BCH slippage rose from 0.2% to 2.8% on Bybit and from 0.3% to 3.5% on Itbit.

    Screenshot 2024-07-08 at 10.52.53 AM

    ETF flows plummet alongside volatility.

    Despite recording the longest consecutive days of inflows between May and June, spot BTC ETF inflows significantly declined quarter-on-quarter. Net inflows into spot BTC ETFs in the US took a hit in the second quarter of the year. Most ETFs experienced outflows for the first time, including BlackRock’s IBIT.

    Screenshot 2024-07-04 at 17.05.52

    While trading typically slows over the summer months, and liquidity tends to dry up, issuers remain confident and some have previously noted that flows could pick up in the fourth quarter as more registered investment advisors in the US are onboarded.

    BTC’s realized volatility fell at the same time as inflows subsided and prices trended lower. Volatility reached its lowest point of 2024 on June 23, but has since climbed over 6 percentage points to around 42%, according to Kaiko’s Data+ dashboard.

    Realized Volatility - 30D (3)

    BTC volatility often spikes after extended downtrends. In February, it rose by 8 percentage points in one week, soaring from 45% to over 74% in March. Similar spikes occurred in January and previously in October and August of last year. With lower liquidity during the summer months and potential selling from Mt. Gox creditors and BTC miners, volatility could react similarly in the coming weeks.

    TON outperforms amid Telegram’s growing use cases.

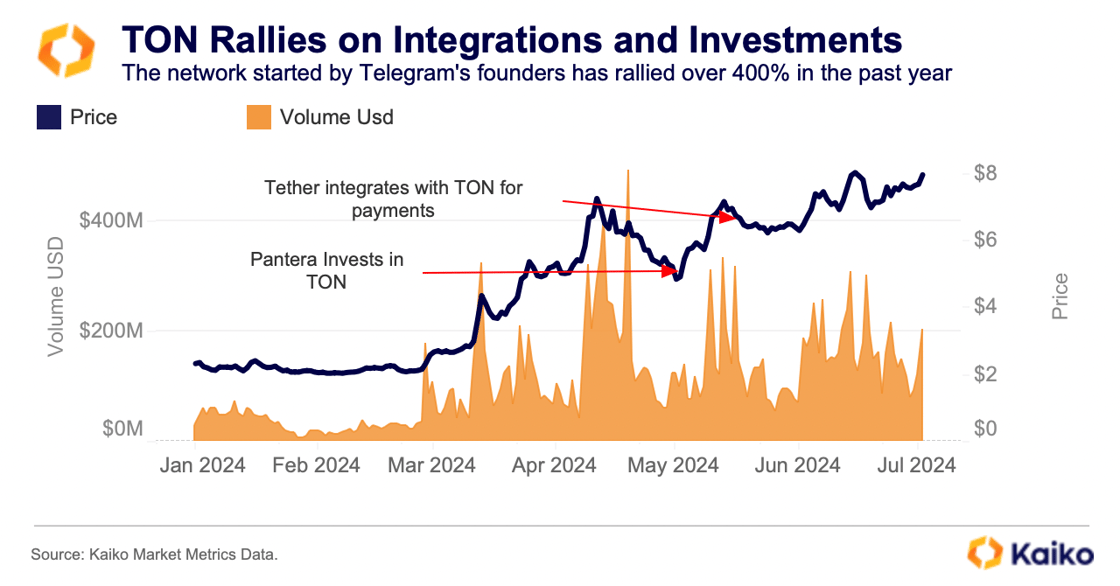
    TON reached a new record high above $8.20 in mid-June, a feat most altcoins haven’t achieved since the 2021 bull run. Much of TON’s interest over the past year has been driven by use cases related to the social messaging app Telegram and its success with its 1 billion users.

    Screenshot 2024-07-04 at 16.45.35

    TON’s trade volumes has also risen over the past year. Volumes increased in both dollar and asset terms, suggesting the increasing is not simply due to higher prices, but more demand for TON tokens. TON’s liquidity has increased at the same time, with 1% market depth up from $2.5mn in January to over $8mn by July.

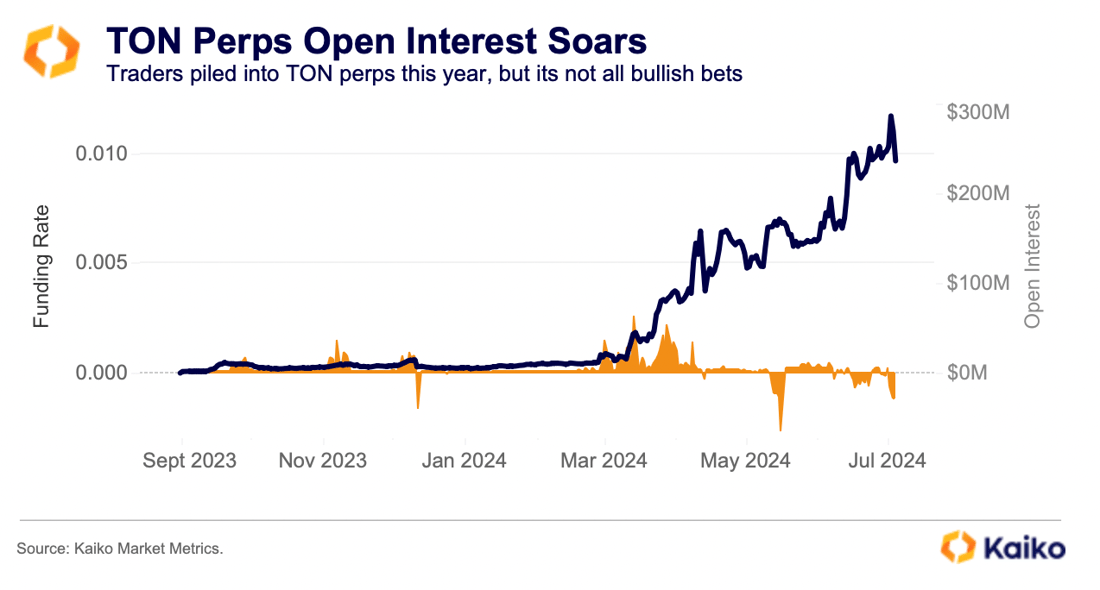
    TON’s open interest reached a record high of $287 million in early July, indicating strong capital inflows. Funding rates have fluctuated between positive and negative this year, reflecting a balance between long and short positions. Both bullish and bearish traders have been active in recent months, with funding rates turning heavily negative in May, signaling a bearish sentiment.

    Screenshot 2024-07-05 at 15.35.14

    Data Used In This Analysis

    • Trade Data

      Price and transaction volume for centralized exchanges.

    • Market Depth

      All bids and asks on an order book

    • Wallet Data

      All users, all transactions, and all history for blockchain wallets.

    More From Kaiko Research