October Analyst Call: Forecasting Crypto Markets with IV

The Return of the Flash Crash.

Bitcoin

CEX

Memecoins

25/03/2024

Welcome to the Data Debrief!

Bitcoin closed the week in the red, slipping to $67k, amid rising GBTC outflows. In other news, Blackrock unveiled its first tokenized fund on Ethereum, Genesis reached a $21mn settlement with the SEC, and the Ethereum Foundation is reportedly facing a probe by a regulator. This week we explore:

  • The return of flash crashes

  • The Ether.Fi airdrop

  • Rising intra-day volatility

  • Bitcoin’s resilience to rising real yields

All research is powered by Kaiko data.


Trend of the Week

Volatility is back and so are Bitcoin flash crashes.

Bitcoin flash crashes — defined as a sudden and extreme price drop — have occurred on at least two occasions over the past few weeks. The low liquidity and fragmentation of the cryptocurrency market, as well as potential manipulation attempts, are contributing factors to these flash crashes, which are unlike anything seen in traditional markets.

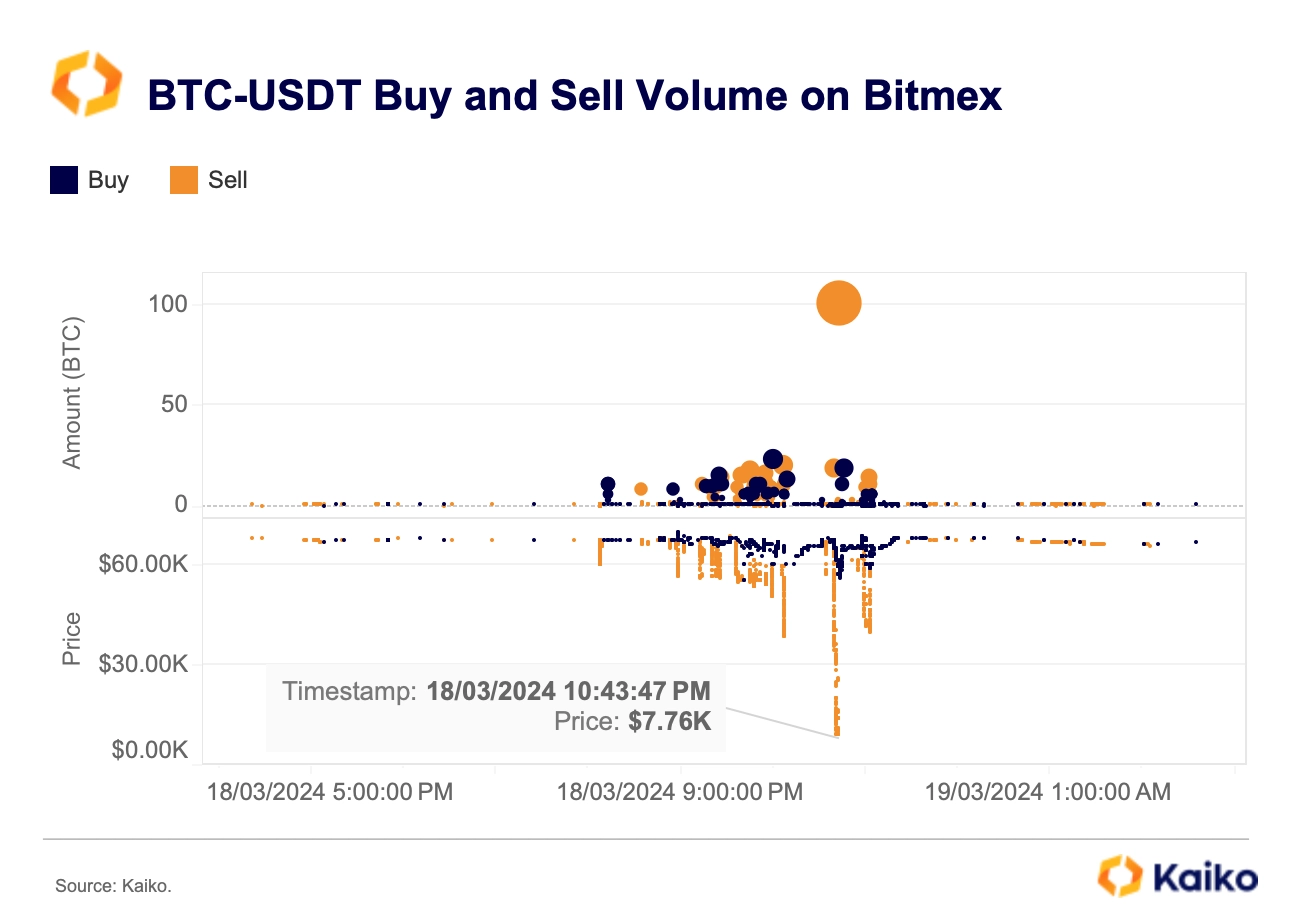
On March 18 at 10:43 PM UTC, the BTC-USDT price on Bitmex momentarily plummeted to $7.8K, while it was trading at $66K on other platforms. In a statement on X, the exchange attributed the crash to aggressive selling by a small number of accounts and is currently investigating potential trader misconduct.

An analysis of buy and sell orders reveals that selling intensified following the U.S. market close, which consistently pushed the price below $60K from 9pm to 11pm. Several large sell orders ranging from 10 to 20 BTC were executed, along with one exceptionally large order of 100 BTC (~$6.6m).

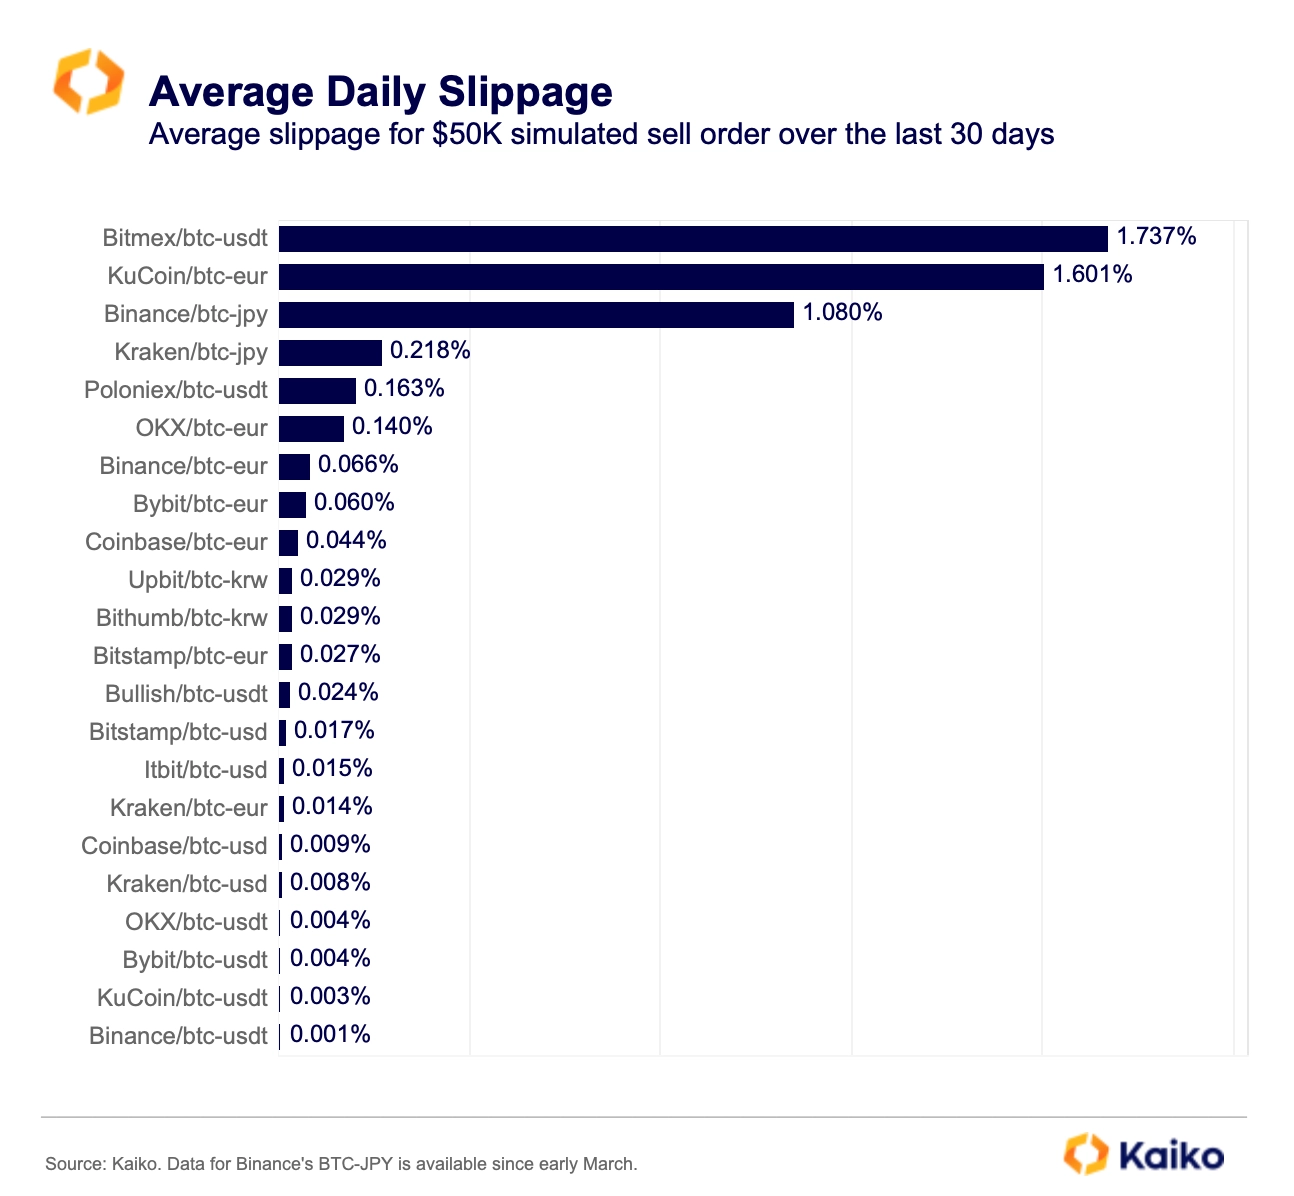
Bitmex has relatively low liquidity compared to other exchanges. Executing large orders on the BTC-USDT trading pair is costly, with an average price slippage of 1.7% for a simulated $50k sell order. Over the past 30 days, the average daily 1% market depth for the BTC-USDT pair was less than 1 BTC.

This suggests that the recent crash may have been amplified by a “fat finger” error, given the already below-average liquidity.

Another possibility is that the crash was a result of a price manipulation attempt. Although Bitmex stated that its derivative markets were unaffected and no liquidations were triggered, its spot market is significantly smaller than its derivative markets, with a BTC-USDT derivatives-to-spot volume ratio of over 1000. In comparison, the same ratio is 9 on OKX, 8 on Bybit, and 7 on Binance.

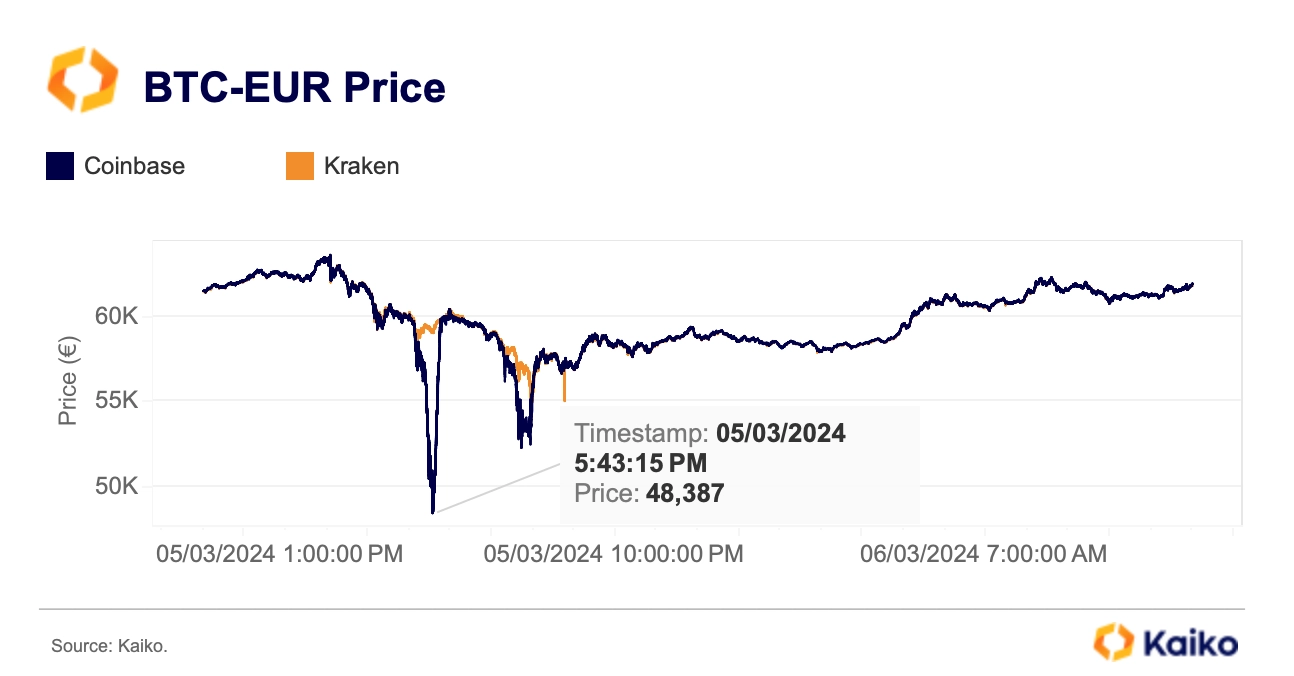
It is noteworthy that Bitcoin also experienced a flash crash on Coinbase. In early March, BTC-EUR prices dropped from €63K to €48K, deviating sharply from other markets.

The BTC-EUR 1% market depth on the exchange briefly plummeted from 60 BTC to 16 BTC before recovering. This indicates that liquidity in the cryptocurrency market is not only fragmented across exchanges but also across trading pairs.

Never Miss An Analysis

Get our research twice a week, directly to your inbox.

Data Points

EtherFi’s airdrop boosts ETH inflows.

Ether.Fi, the largest Ethereum re-staking protocol, has seen a significant increase in demand this year, with its total value locked rising from $103 million to $3 billion YTD. The recent announcement of an airdrop of its governance token, ETHFI, has further boosted ETH inflows into the protocol.

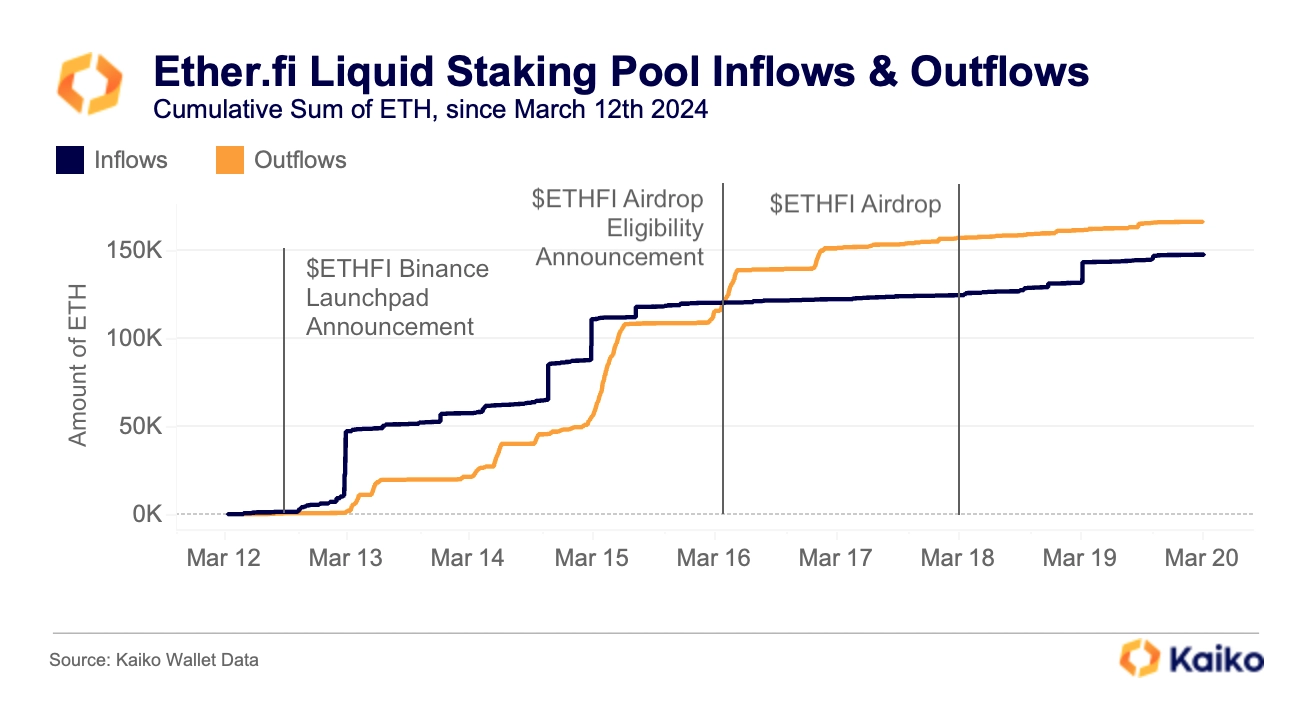
In the week following Binance’s announcement that it would launch ETHFI on its Launchpool platform, ETH inflows into Ether.Fi surpassed outflows, exceeding 100k ETH, which we tracked using Wallet Data.

However, outflows accelerated after the airdrop eligibility criteria were announced on March 16 and have consistently exceeded inflows since then. This suggests that the increase in TVL was partially linked to airdrop anticipation.

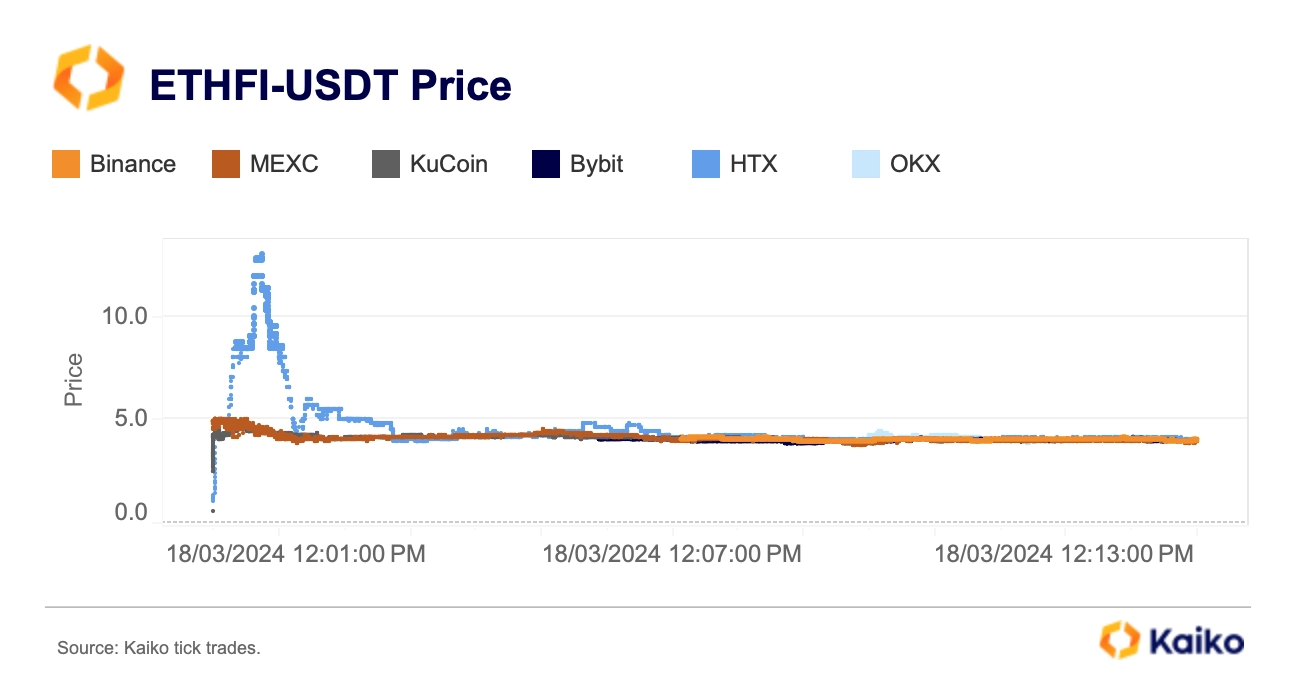
Looking at ETHFI’s price action on centralized exchanges post-launch, the token experienced significant volatility, losing between 10% and 70% of its value in the first hour of trading before stabilizing at around 3.5 USDT.

HTX and KuCoin were the first exchanges to open trading at 12 pm UTC on March 18. The token initially rose, reaching as high as 12.8 USDT on HTX before declining below 4 USDT. On Binance, which opened trading relatively late at 12:07 pm UTC, the price did not exceed 5 USDT.

SLERF token hits all-time high despite burning error.

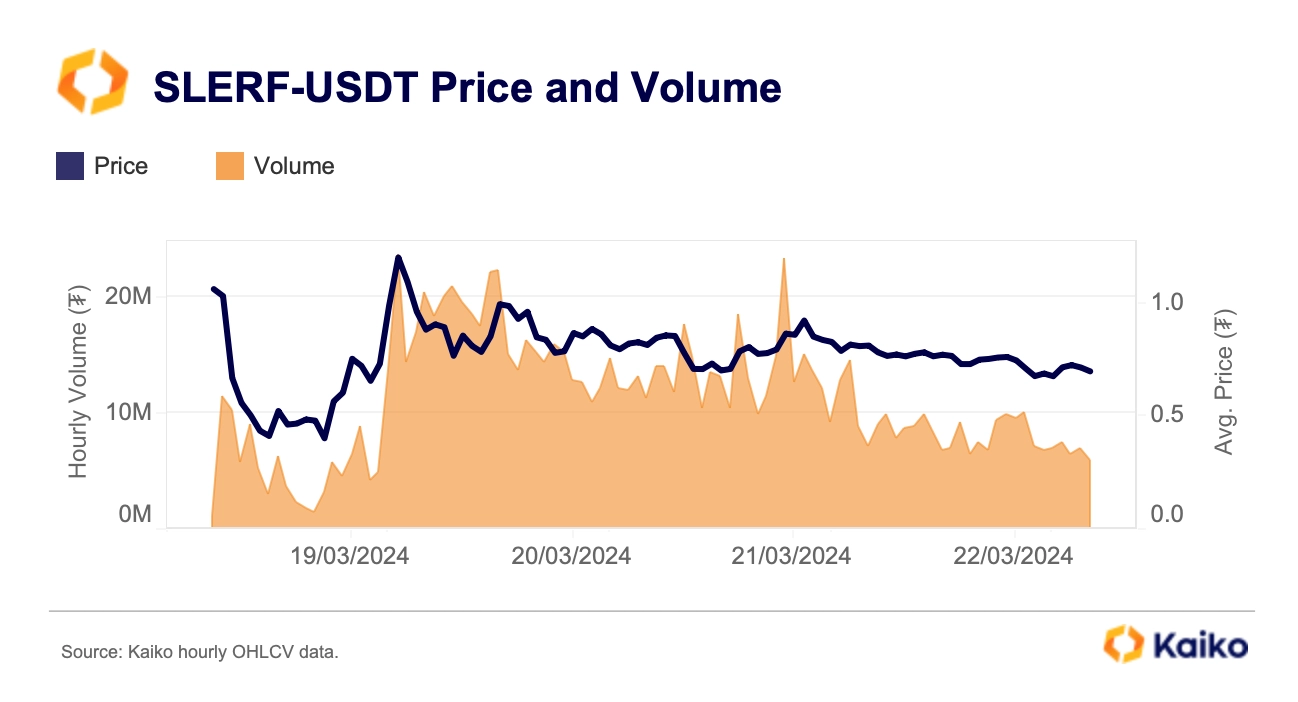
Last week, the Solana-based meme project, SLERF, mistakenly burned $10 million worth of SOL tokens that had been raised from presale investors. Despite this, the sentiment around the token turned bullish, and its price hit an all-time high after several major centralized exchanges, including HTX and Bitget, listed the token and pledged support for the project.

The trading volume for SLERF-USDT also surged from $5 million to $24 million. While blue-chip meme tokens such as DOGE and SHIB dominate the trade volume on centralized exchanges, on-chain meme frenzy is being dominated by Solana, which recently overtook Ethereum in terms of decentralized exchange (DEX) volume.

Price volatility is spiking during U.S. hours.

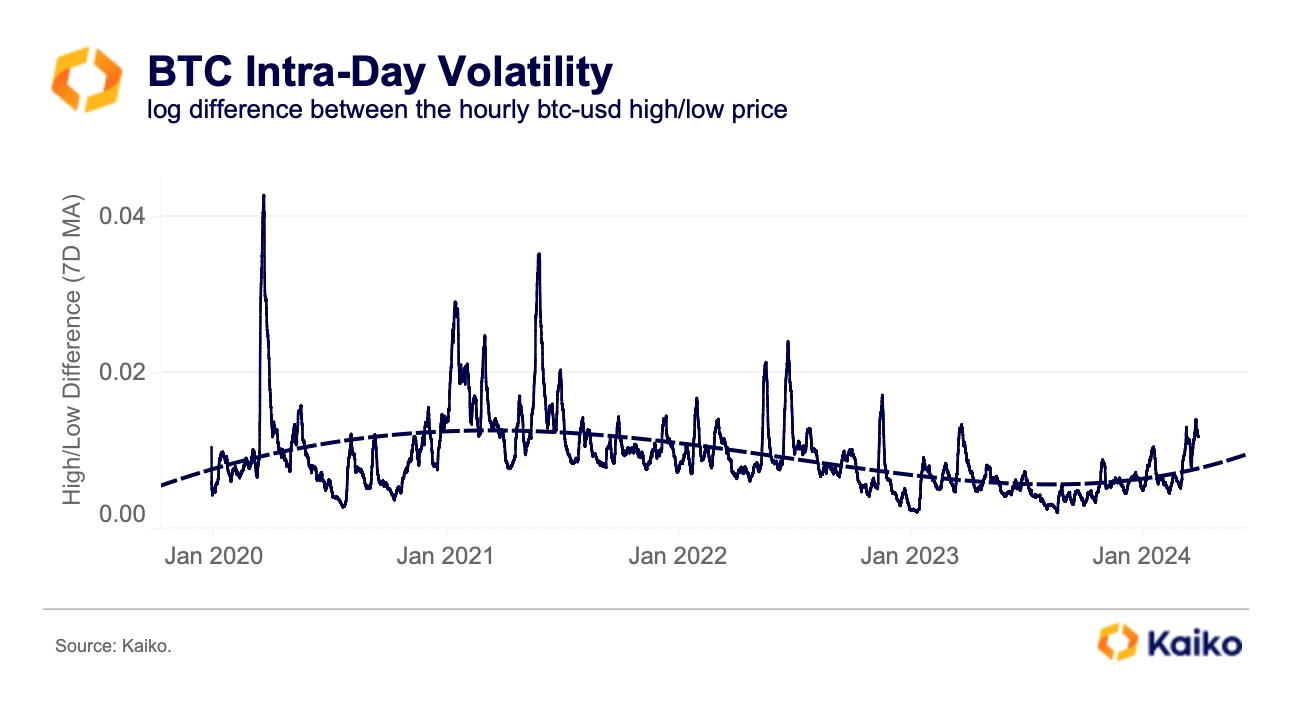
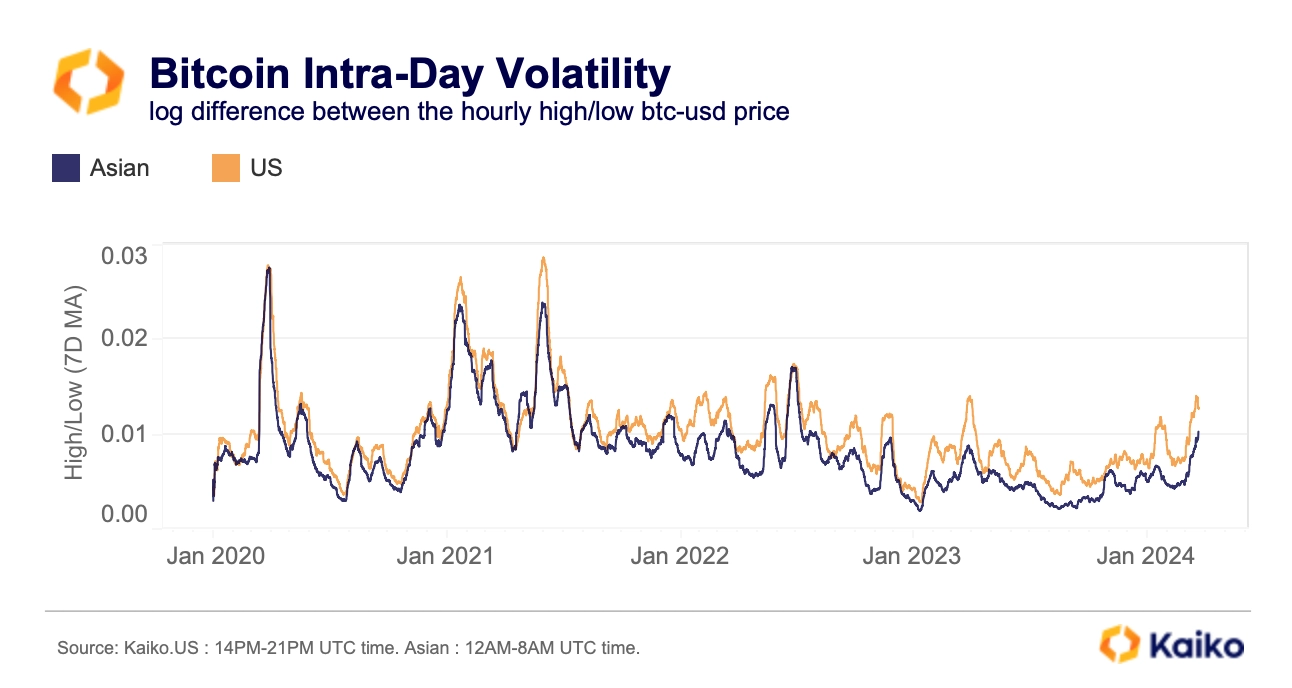
The price of Bitcoin has seen substantial swings in recent weeks, hitting new all-time highs before retreating. However, BTC’s intra-day volatility, as measured by the log difference between the hourly high and low price, is still well below its peak hit during the COVID-induced market crash or the 2021 bull market.

So why does volatility feel so high? Upon closer examination, it appears that volatile price activity has been more concentrated during U.S. opening hours (14 to 21h UTC time) relative to APAC hours (12- 8h UTC).

It is also worth noting that the current spike in volatility follows an unusually low volume and volatility period, making the recent fluctuations feel more pronounced.

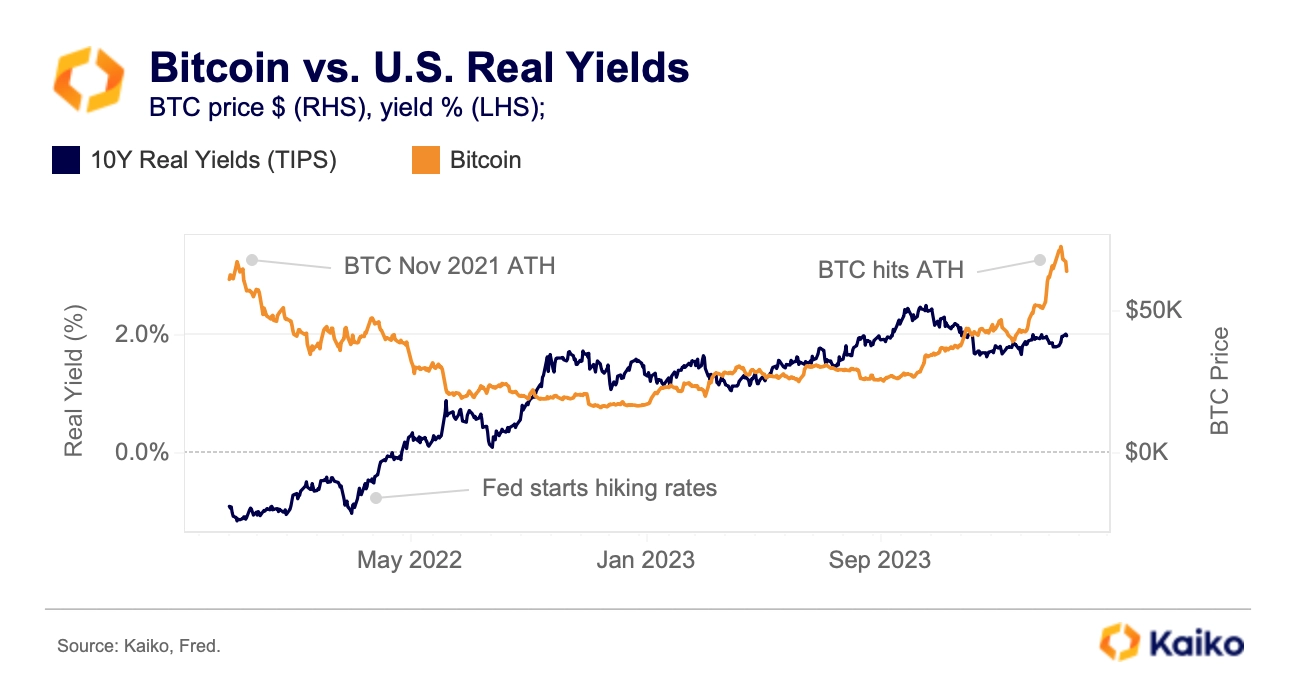
Bitcoin is resilient to U.S. real yields in 2024.

U.S. real yields, as indicated by the 10-year inflation-protected securities (TIPS), hit a yearly high of 2% last week before slightly retreating. Historically, rising yields have put downward pressure on Bitcoin prices, making risk assets less attractive compared to risk-free treasuries.

However, this year, BTC has shown resilience to the gradual increase in yields, gaining 50% YTD. Despite the recent pullback from its all-time high, BTC’s strong performance suggests that other factors, such as inflows from spot ETFs, may be providing support to its price.

Interestingly, gold, which also tends to lose value as yields rise, has experienced a similar upwards trend, suggesting that rising debt levels and geopolitical turmoil may have contributed to offset the impact of higher yields on both assets.

Data Used In This Analysis

  • Trade Data

    Price and transaction volume for centralized exchanges.

  • Market Depth

    All bids and asks on an order book

  • Wallet Data

    All users, all transactions, and all history for blockchain wallets.

More From Kaiko Research