Join us for our latest webinar in collaboration with Cboe

The Future of Fiat On-Ramps

Welcome to the Data Debrief!
Markets are steady to start the week after a volatile Friday in reaction to the closure of SEN, Silvergate’s instant payment network.
-
Tether’s all time high dominance vs. the dollar
-
Rising altcoins trade volume
-
Strong inflows into crypto ETFs
Trend of the Week
Dollars to crypto: what is the future of fiat on-ramps?
Silvergate is in deep trouble. On March 1, the “crypto bank” revealed in a regulatory filing that it could soon be “less than well capitalized.” The news prompted Coinbase, Paxos, Galaxy Digital and a host of other large crypto enterprises to drop Silvergate as a banking partner. Why does this matter?
The “fiat problem” has long plagued crypto markets: to buy bitcoin, you at some point need to interact with the traditional banking system. Silvergate solved for this by providing easy banking services for crypto enterprises. Most notably, Silvergate operated an instant payments network, SEN, used widely by exchanges, market makers, and investors to instantly move large amounts of U.S. dollars, seven days a week. At the end of 2022, Silvergate had 94 crypto exchange clients and 894 institutional investors.
On Friday, SEN was shut down.
SEN served as one of the only fiat payment rails in the crypto industry and without it liquidity could suffer. Specifically, it will become harder to quickly deploy fiat capital via exchanges, with Signature Bank now one of the only banking alternatives. But of course, there is another widely-used on-ramp into crypto: stablecoins.
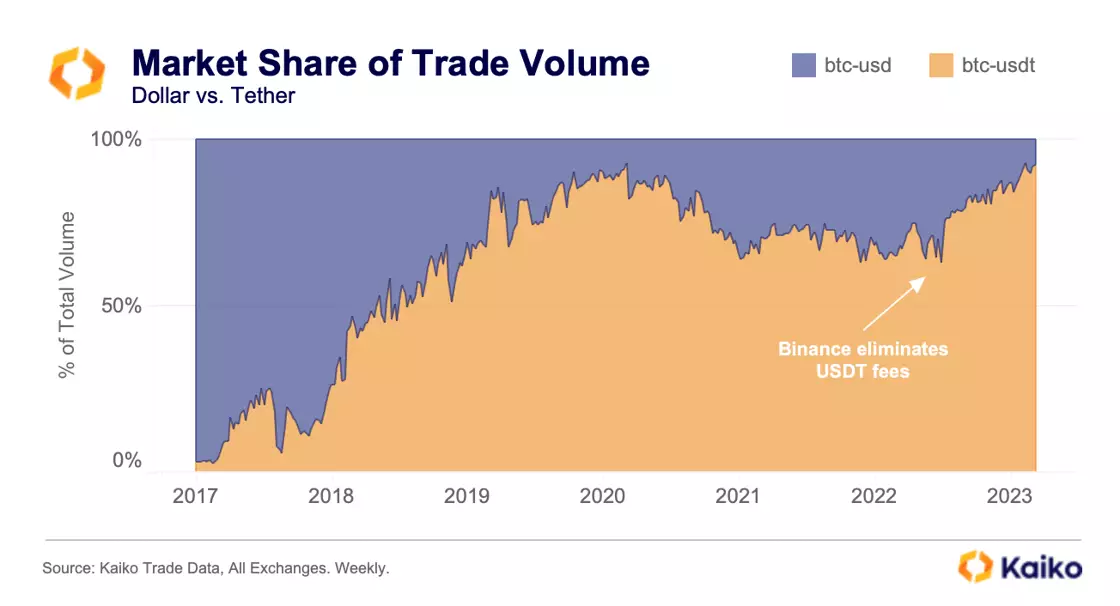
Since 2017, the market share of dollar to tether trade volume (for BTC trading pairs) has climbed from 3% to 92%, recently hitting an all time high in the aftermath of the FTX collapse. With the death of SEN, stablecoins will likely become even more ubiquitous among traders. Rather than deposit your dollars with an exchange, you deposit them with a stablecoin issuer, receive stablecoins, and then transfer those to an exchange. The problem is, though, that stablecoin issuers still need access to a crypto bank, so the risk is now further concentrated.
So what is the future of fiat in crypto markets? Globally, the number of new fiat trading pairs listed by exchanges has fallen with the rise of stablecoins. But with an increasingly unfriendly U.S. regulatory and banking environment, there could be an emerging opportunity within European markets.
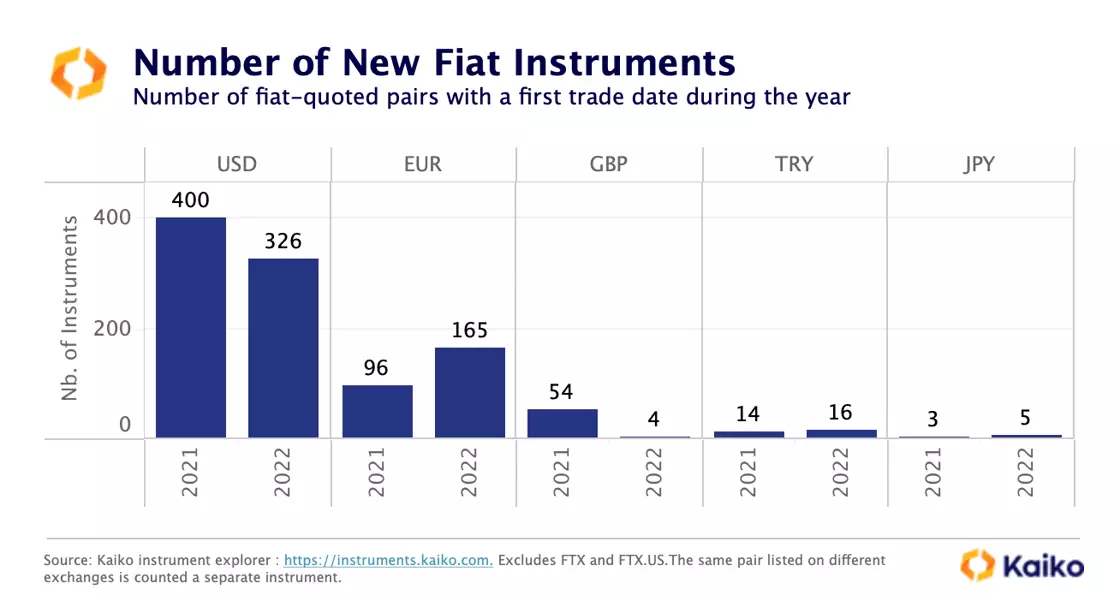
In 2022, the number of new dollar-denominated trading pairs fell from 400 to 326 across all exchanges while the number of new euro-denominated pairs increased from 96 to 165.
The euro certainly presents an opportunity, but when looking at the market share of volume for USD-denominated pairs, we see a broader story emerge: that of the declining use of the dollar in crypto. Since the FTX collapse, USD market share has fallen consistently relative to USDT, USDC, and euro trading pairs.
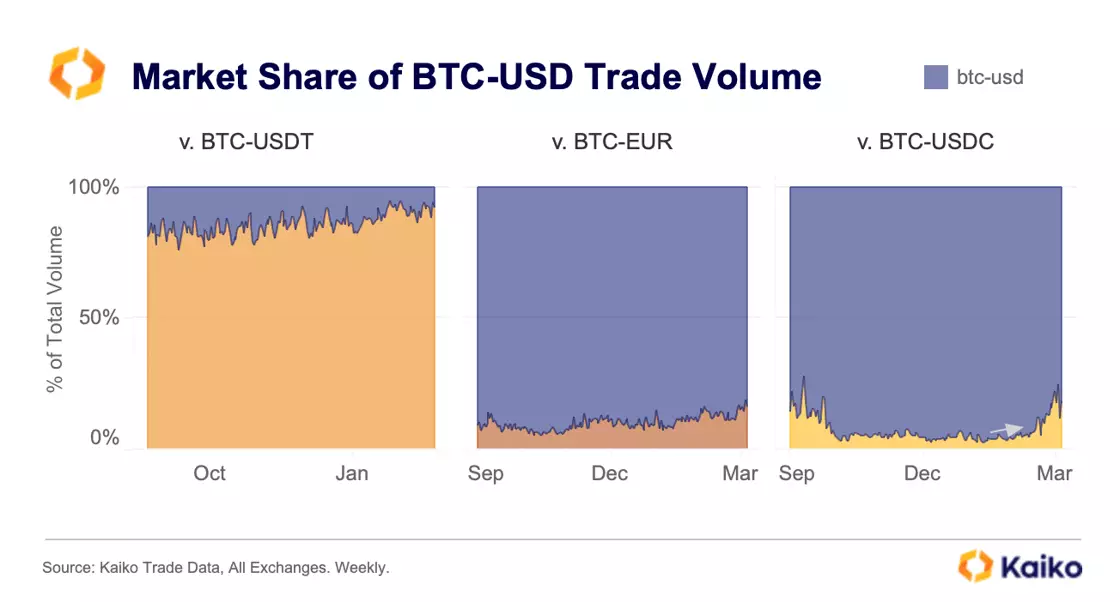
For now, the dollar and dollar-pegged stablecoins remain the foundation of the crypto-economy, but growing complications with USD payment rails could upend this trend.
Never miss an analysis.
Subscribe to our free weekly Data Debrief email, or learn more about our premium research subscriptions here.
Price
OKB surges 100% with unclear token supply.
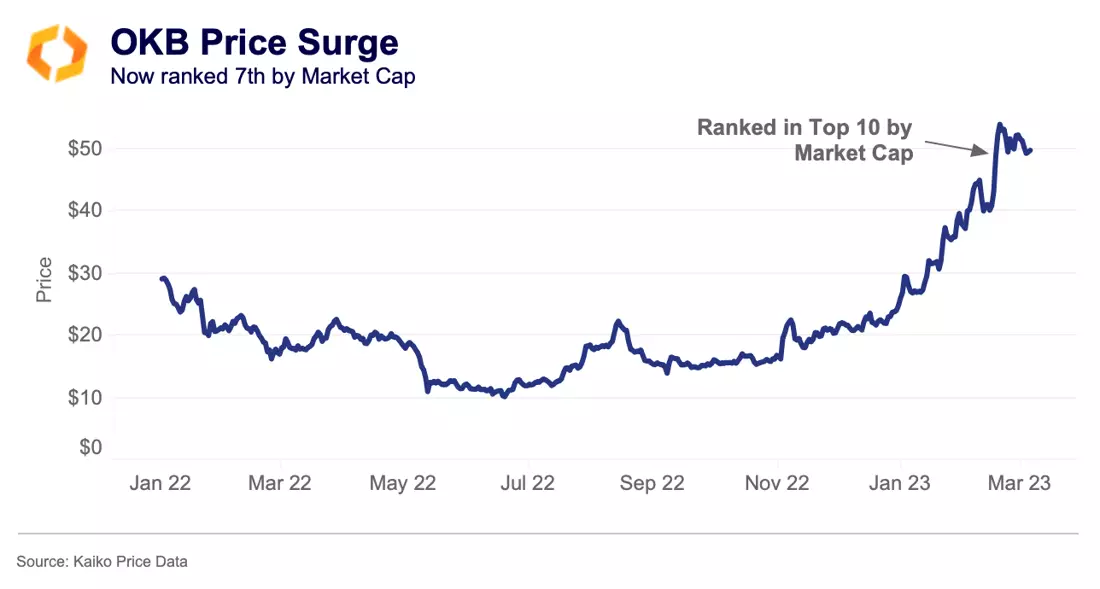
OKB is the native token for the exchange OKX, allowing users to get discounts on trading fees on the exchange, similar to how BNB or FTT benefitted holders. This year, OKX announced the launch of their OKBChain, a PoS chain which is set to be released in Q1 and will be secured by the OKB token. On the back of this news and a broader crypto market rally, OKB is up over 100% since the start of the year.
The troublesome part about OKB’s price surge is that its circulating supply is unclear: CoinGecko and Coinmarketcap’s measures differ by nearly 200mn in circulating supply, resulting in a difference in valuation of nearly $10bn for OKB. This means CoinGecko has OKB ranked as the 7th largest cryptocurrency by market cap, while Coinmarketcap has it ranked 23rd.
When looking for clarification on this circulating supply figure on OKX’s website, social media posts and blog posts, we were led to broken websites, deleted roadmap images and links that now only lead back to OKX’s homepage. With OKB being ranked so highly now, it is vital the industry receives clarity from the OKX team on not only the circulating supply of OKB, but also tokenomics and use cases sooner rather than later.
STX/BTC ratio approaches ATH as token rallies 200%.
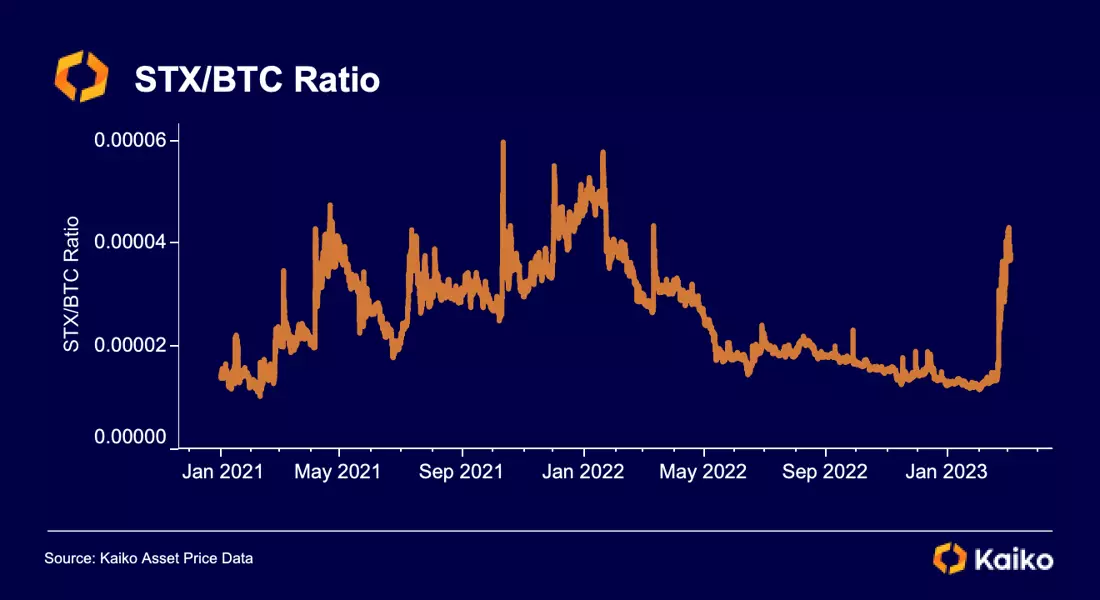
Stacks (token: STX) has rallied more than 200% in recent days due to ongoing buzz around Bitcoin NFTs. Bitcoin was the center of a flurry of activity (and controversy) last month after users started inscribing NFTs on the blockchain using Ordinals. This interest has carried over to Stacks, a blockchain linked to Bitcoin that allows for the creation of decentralized applications. Using Bitcoin for activities besides monetary transfers has become a controversial topic in the community, with some Bitcoin maxis rallying against this development. However, this has not stopped speculation related to Stacks, helping its token surge to a near-ATH relative to BTC.
Liquidity
Coinbase suffers connectivity issues amid high volumes.
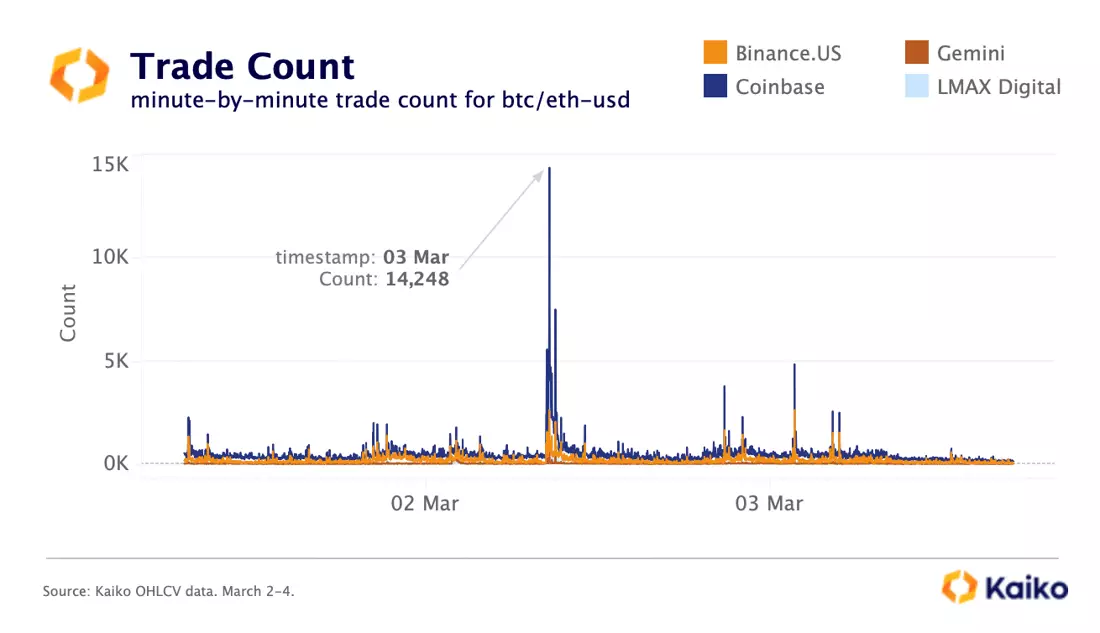
As crypto prices crashed in the early hours of March 3, Coinbase experienced connectivity issues as the number of transactions the exchange needed to process surged to 2023 highs. The minute trade count for its two major trading pairs — BTC-USD and ETH-USD — surged from around 450 to over 14k within minutes. The trade count is the raw number of transactions that occurs during a time interval and does not consider trade volumes or prices.
Other exchanges also experienced an increase in the number of processed transactions during the sell-off. On LMAX Digital transactions jumped from 200 to 3k, on Binance.US from 400 to 2.6k, and on Kraken from 200 to over 2k.
Overall, crypto market infrastructure has improved dramatically over the past two years. In 2020, Coinbase processed an average of 150k BTC and ETH transactions per day. In 2022, this number surged to over 1mn.
MKR considered as collateral for DAI.
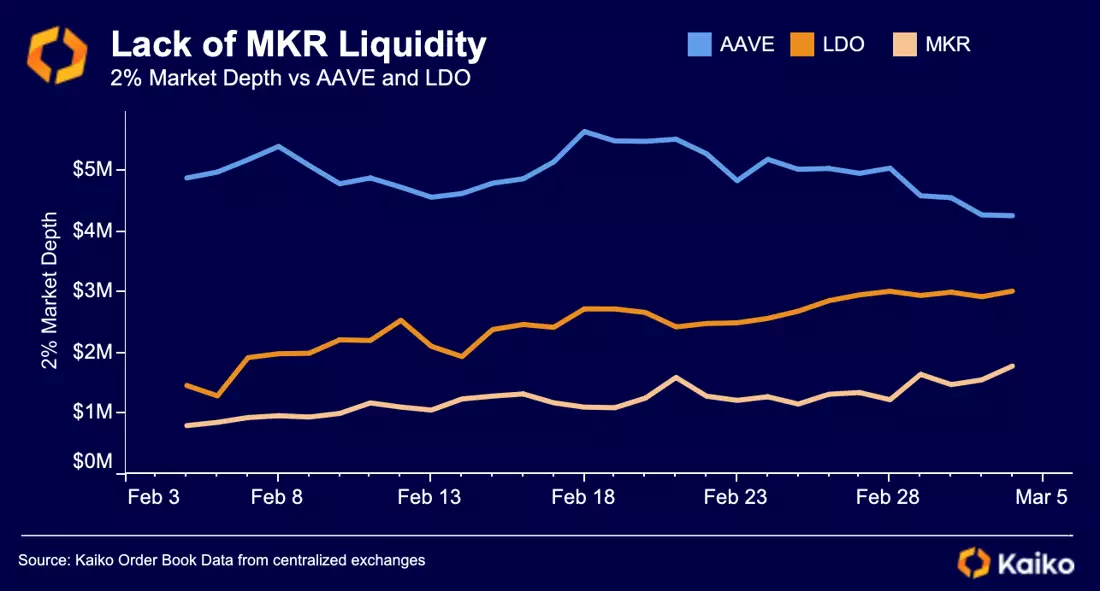
One of DeFi’s largest protocols, MakerDAO, is undergoing a controversial proposal to overhaul the direction of the protocol and its stablecoin, DAI. A particularly controversial element of the new direction for DAI is allowing the stablecoin to be minted using MKR — protocol’s governance token — as collateral. Allowing its own governance token to be used as collateral calls to mind LUNA and UST and may increase Maker’s risk of a bank run-type event.
To add to the complexity of the decision, MKR is also a relatively illiquid token, with lower 2% market depth on centralized exchanges than AAVE and LDO. Onboarding such an illiquid token as collateral is riskier because, as we’ve seen, illiquid tokens can be manipulated, triggering liquidations.
Altcoins are showing signs of life.
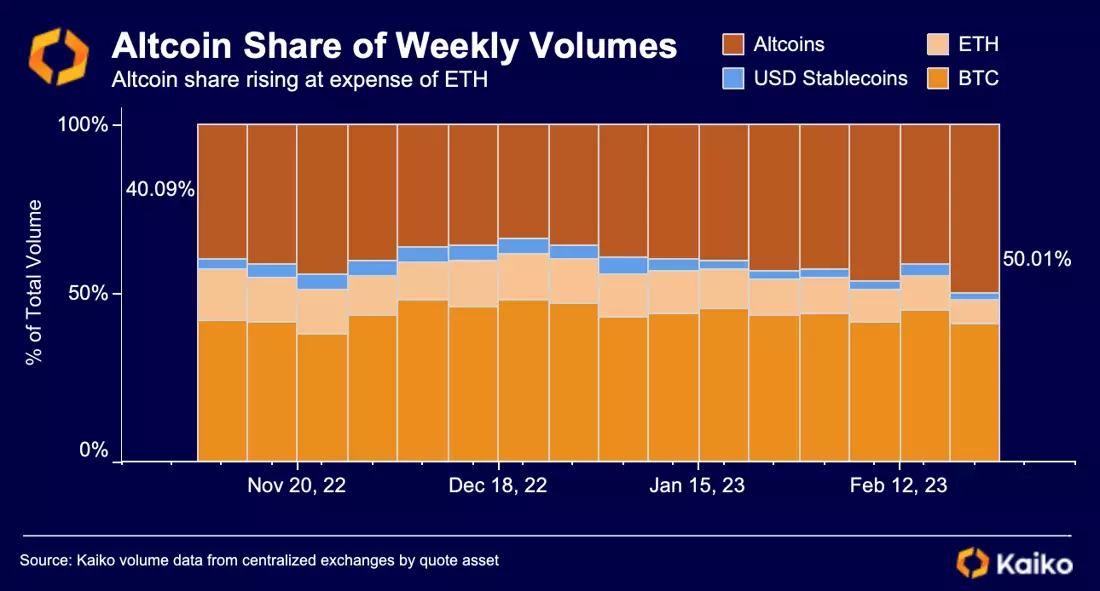
With broadly improving market sentiment since the end of last year, there has been a persistent trend of increased interest in altcoins. Since November 2022, the percentage of altcoin volumes relative to BTC, ETH and stablecoins has increased from 40% to 50%, largely at the expense of ETH, who’s market share has decreased from 25% to just 7% of volumes. Bull markets are often characterized by a rotation of funds out of BTC and ETH and into riskier altcoin alternatives.
Uniswap volume surges off Christmas lows.
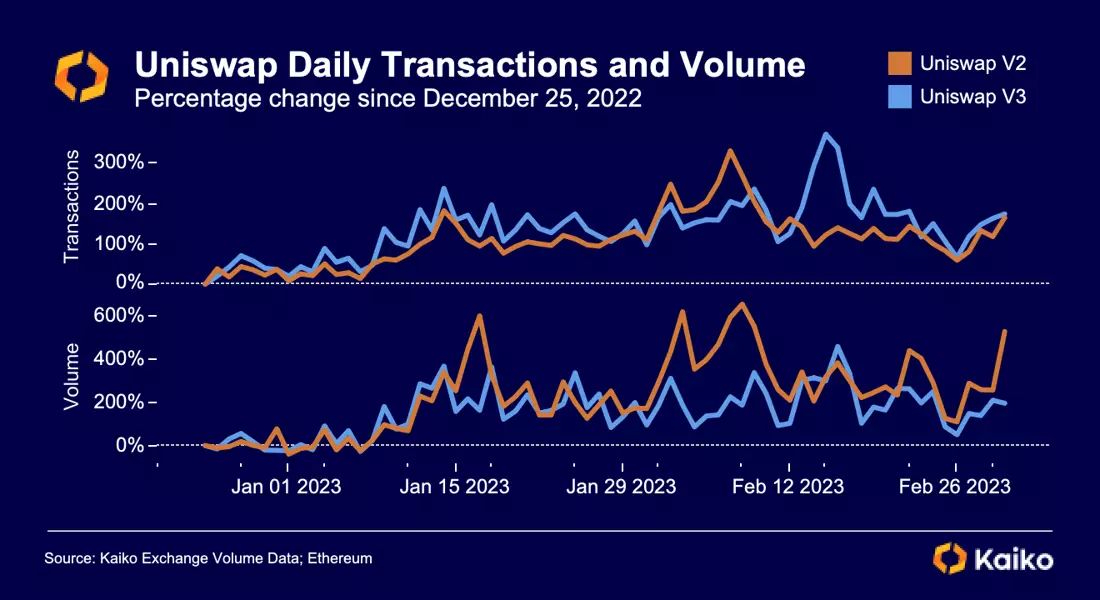
Uniswap V2 hit a low of 8.8k trades on Christmas 2022, its lowest daily figure since mid-June 2020. Interestingly, Uniswap V3’s all-time low transaction day was in June 2022 (13.3k), almost exactly two years later. V3 also registered one of its lowest activity days on Christmas 2022 with just 14.4k trades. Since then, trade counts on both iterations of Uniswap have rallied 170%.
Volume, too, has increased significantly since Christmas, remaining flat through the first week of January before V2 rallied 600% into January 17. Daily volume has remained elevated, with V2’s comeback slightly more pronounced even as its total volumes are much lower ($61.5bn to just $2.3bn). V2 remains a hub for riskier assets, which have driven volumes to the exchange. As of March 2, its daily volume was 525% higher than on Christmas compared to 195% for V3.
New DeFi Coverage
Now Live
We are proud to have expanded our DeFi coverage with the launch of Curve v2, Maker, and Balancer v2. Kaiko’s DeFi data allows clients to visualize swaps, mints, burns, and more for the top decentralized protocols. Now covering:
-
Curve v2: trading, and liquidity data for uncorrelated assets
-
Maker: L&B activity + real-world asset events data
-
Balancer v2: trading and liquidity data in smart pools
Derivatives
IV suggests low stress among options traders.
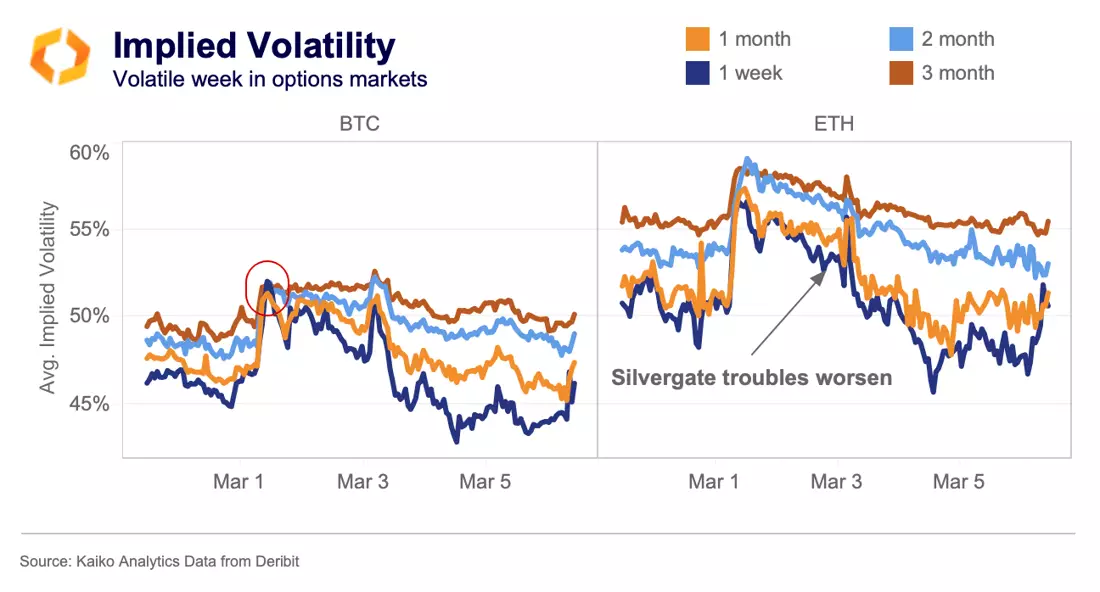
It was a volatile week in crypto as options markets for BTC and ETH struggled to price in a consistent level of volatility over both short and longer term expiries. BTC options started the week showing signs of panic as 1-week implied volatility briefly spiked higher than 3 month implied volatility, an indicator of short-term anxiousness among investors. As the Silvergate troubles worsened on March 3, implied volatility spiked for both BTC and ETH options, but interestingly have since retreated to levels that we saw towards the start of last week. If the movements in implied volatility are compared with the price movements in spot markets, option investors seem to be less anxious of the implications of a Silvergate bankruptcy than spot investors.
Funding rates flip bearish.
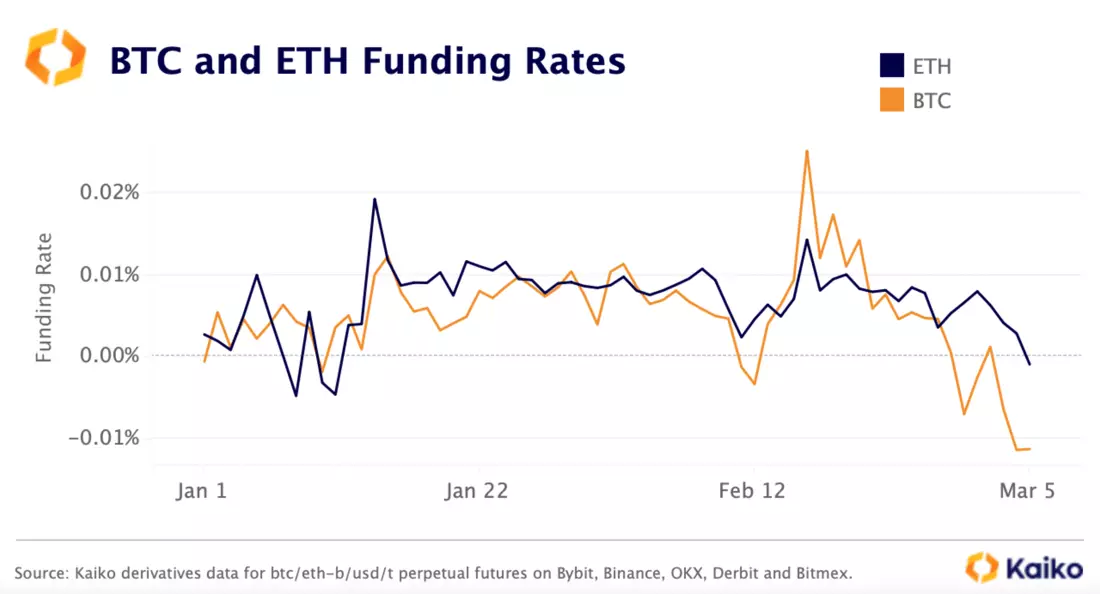
Market sentiment turned bearish last week with BTC and ETH funding rates falling into negative territory for the first time in months. Interestingly, BTC funding rates fell more than ETH’s hitting their lowest level yet this year. Both BTC and ETH open interest remained mostly flat throughout last week despite a wave of long liquidations suggesting that most of the excessive leverage has been flushed out of the market. Volumes were also low relative to previous market sell-offs suggesting the sharp move in prices was mainly spot driven.
Macro
Rising inflows into BTC ETFs despite regulatory scrutiny.
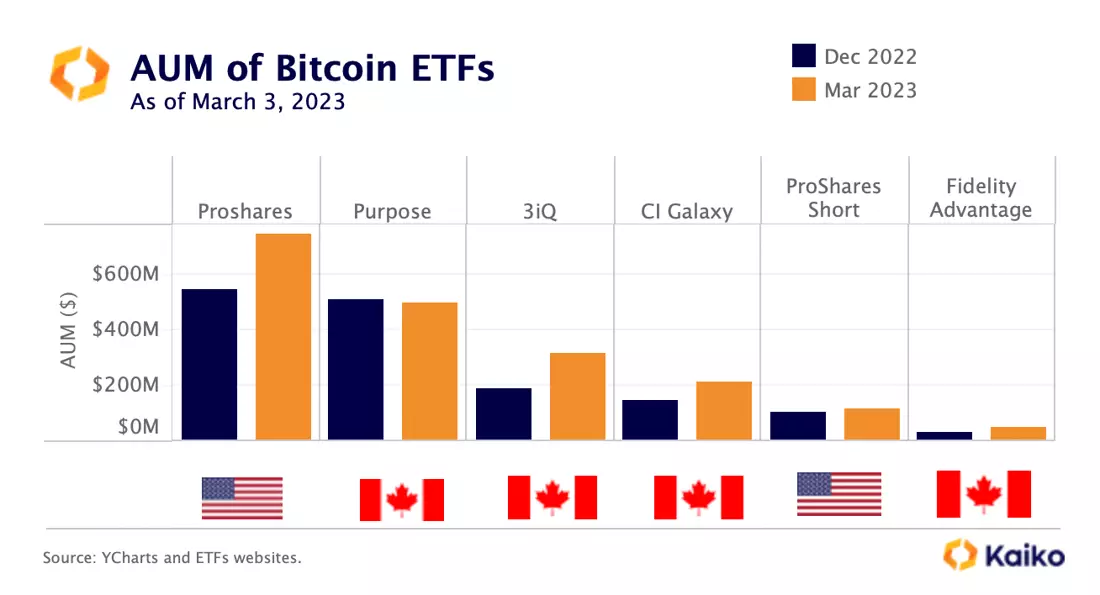
Despite volatile risk sentiment and rising regulatory scrutiny, most Bitcoin ETFs’ assets under management (AUM) have surged to start of the year. BITO — which tracks BTC futures on the Chicago Mercantile Exchange — continued gaining traction relative to its Canadian counterparts. As of March 3, it manages $747mn in assets up 37% YTD. Rising regulatory uncertainty could benefit SEC-compliant investment products such as U.S.-based futures Bitcoin ETFs.
The Canada-traded Purpose Bitcoin was the only one out of the top six spot and futures backed ETFs in North America to register a slight decline in AUM. It currently manages $501mn in assets which is nearly 40% less than the ProShares BITO ETF.
Rising U.S. Treasury yields put pressure on risk assets.
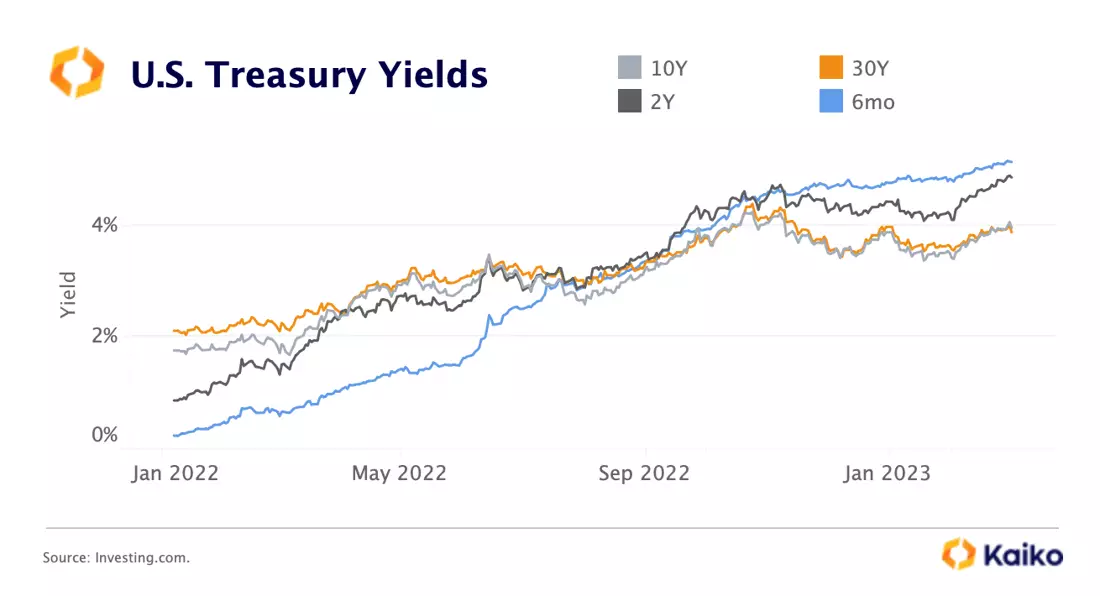
After declining in January, U.S. Treasury yields – which move inversely to prices- resumed their increase over the past month boosted by higher interest rates expectations and stickier than expected inflation. Both short- and long-term safe-haven U.S. bonds earned a yield of +4% last week before retreating slightly on Friday.
Treasury yields have risen at the fastest pace in decades over the past year from between zero to 2% to as high as 5%, hurting the relative attractiveness of risk assets and catching many investors off-guard. With short-term treasury yields much lower than long-term yields for most of the past decade years, investors were tempted to search for yield in the long end of the curve.
However, this could be a risky strategy as selling those assets before maturity could result in substantial losses due to the sharp deterioration in bond prices. The latest example of this was Silvergate, which sold debt securities at a loss of over $800mn to meet billions of deposit withdrawals in late 2022. The bank has reportedly continued selling debt securities in the first two months of the year which added to its financial woes as digital deposits did not return.
On a more positive note, last week’s Coinbase earnings report showed that higher yields have also provided some cushion to native crypto companies amid the crypto winter.
Data Used in this Analysis
Derivatives Metrics
![]()
Metrics and analytics products tailored to the cryptocurrency derivatives market.
Liquidity Metrics
![]()
The most granular order book data in the industry optimized for quantitative analyis.
Trade Volume
![]()
Centralized exchange data sourced from the most liquid venues, covering all traded instruments.

More From Kaiko Research
![]()
Macro
13/01/2026 Data Debrief
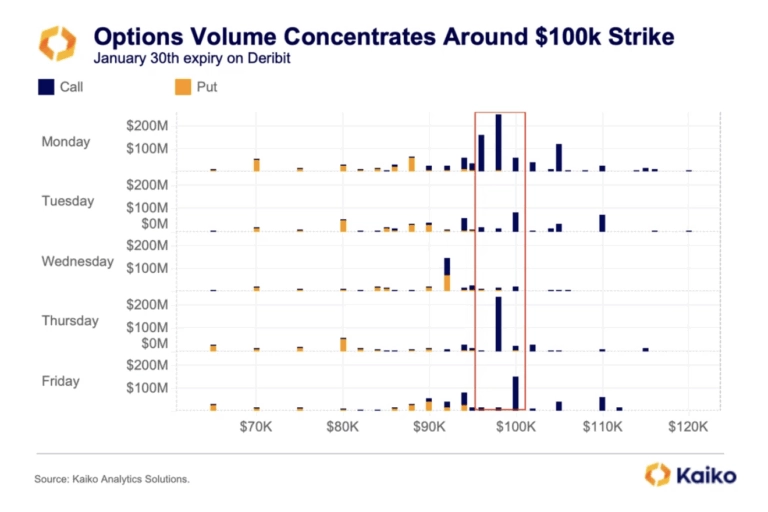
Positioning for $100K: Signals and Key CatalystsThis week’s Data Debrief examines the positioning dynamics beneath the surface of the early January rally. Extraordinary call volume concentration at and around the $100,000 strike, an inverted volatility term structure, and neutral funding rates suggesting balanced leverage.
Written by Adam Morgan McCarthy![]()
Indices
06/01/2026 Data Debrief
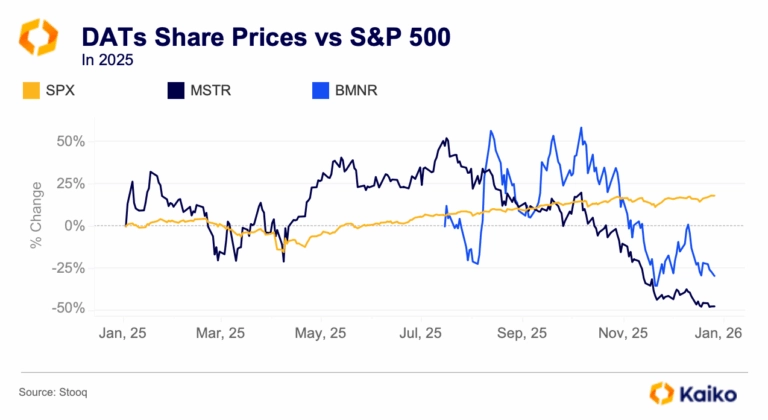
The Rise and Repricing of Digital Asset TreasuriesAs digital assets mature and market structure deepens, corporate and institutional crypto holdings are being reclassified from speculative bets to managed treasuries. Instead of sitting passively on balance sheets, these positions are increasingly treated as a distinct asset pool, with dedicated strategies for liquidity, risk, and yield.
Written by Laurens Fraussen![]()
Derivatives
29/12/2025 Data Debrief
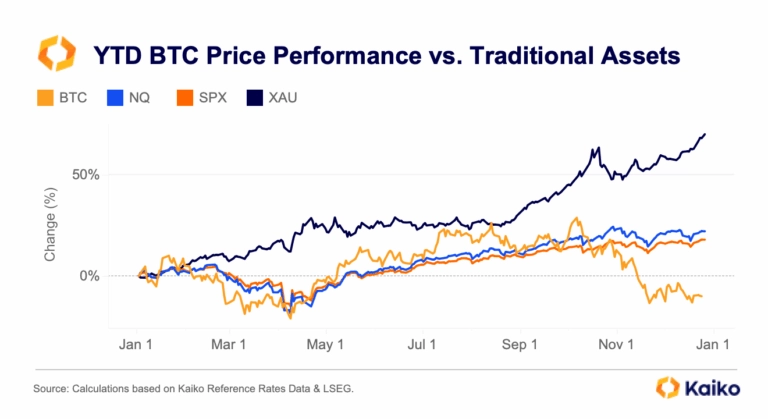
Santa Rallies, Cycles, and Year-End Reflections for BitcoinAs markets approach the end of the year, Bitcoin finds itself at a familiar crossroads, caught between cyclical behavior and a steadily developing market. While year-end seasonality has historically played a role in shaping price action, recent data suggests that cyclical drivers are increasingly dominant.
Written by Laurens Fraussen![]()
Derivatives
22/12/2025 Data Debrief
Crypto in 2026, What Breaks, What Scales, What ConsolidatesCrypto markets enter 2026 in a markedly different position than in prior cycle transitions. Rather than resetting after a speculative peak, the market appears to be progressing through a phase of institutional consolidation.
Written by Thomas Probst


