Data Points
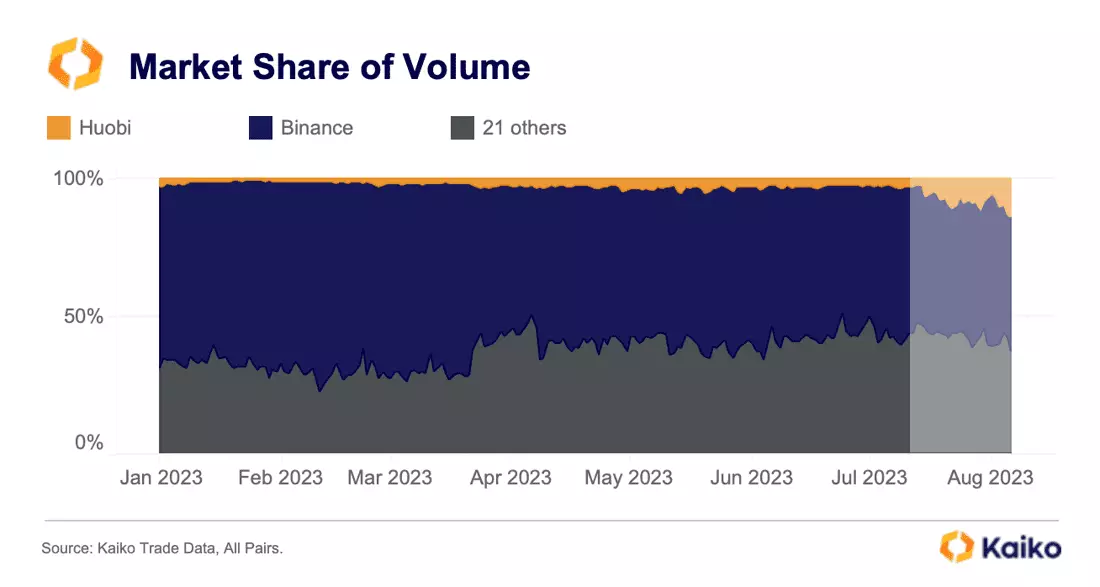
Huobi’s market share soared. Then the rumors came.
Over the weekend, financial media in Hong Kong reported that several Huobi executives had been detained. There has since been a sharp increase in exchange outflows.
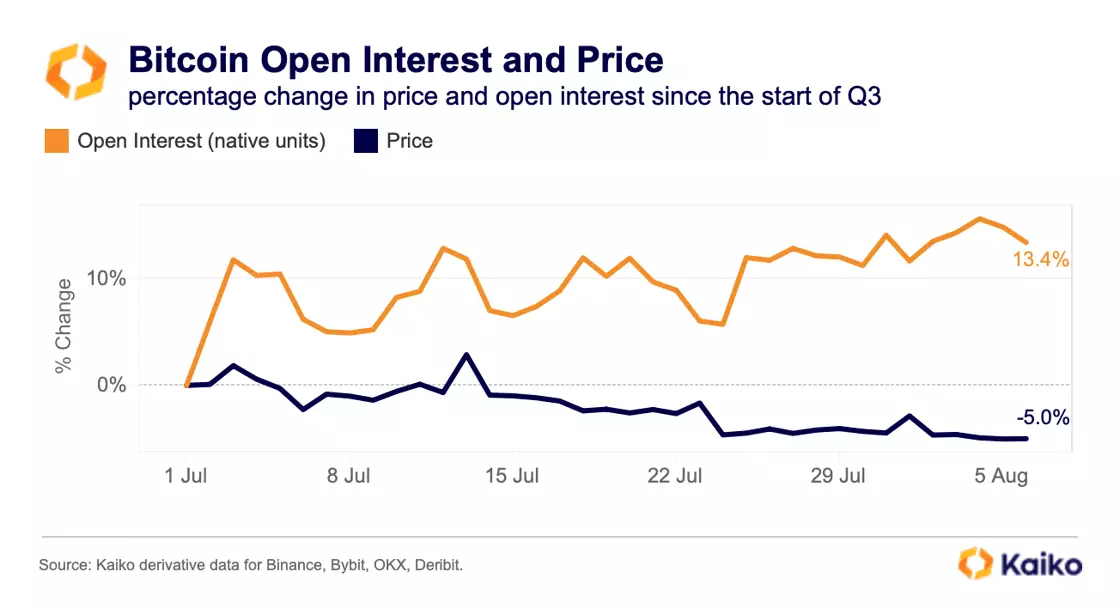
The news comes at an interesting time for Huobi: starting in July, Huobi’s trade volume started experiencing a somewhat miraculous turnaround, helping the exchange’s market share climb from just 3% to as high as 11% relative to the most liquid exchanges. No one crypto asset contributed to these gains, with volume distributed evenly across all altcoin markets.
This trend is notable because not a single other crypto exchange has experienced a similar increase in trade volumes. We are in the middle of a summer doldrums, with low volatility and trading activity. The exchange has publicly denied the reports calling it “FUD”, but it is unclear how this will impact market share in the short term.
Curve liquidity continues to slide following exploit.
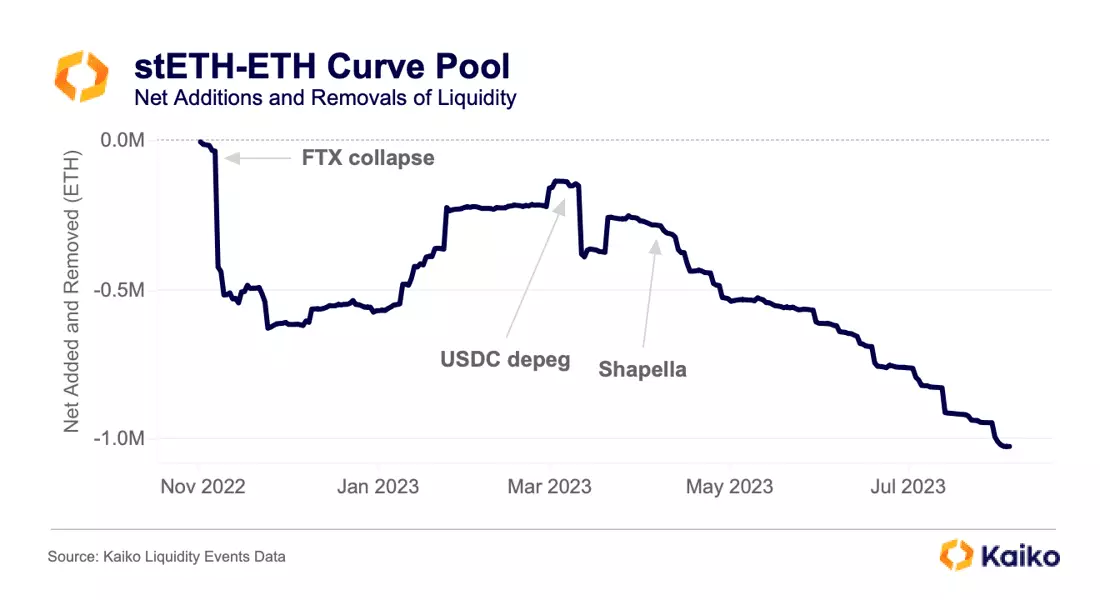
The impact of the Curve exploit is ongoing, with liquidity also dropping for pools that were unaffected, part of a longer-term downtrend since the FTX collapse. For example, Curve’s stETH-ETH pool has seen about 70k total ETH and stETH removed.
The largest drop in July came on the 12th when an address linked to Nexo removed about 100k tokens. Currently, there are 105k ETH and 106k stETH in the pool. The longer negative trend has been driven by the Lido DAO halting LDO token incentives to the pool. Previously, these incentives had made up for the lost yield that liquidity providers faced when joining this pool. This phenomenon and its implications were explored in a recent Deep Dive. For the first time in months, stETH-ETH is no longer the largest pool by TVL; pole position now belongs to FRAX-USDC at $450mn.
Litecoin halving fails to boost prices.
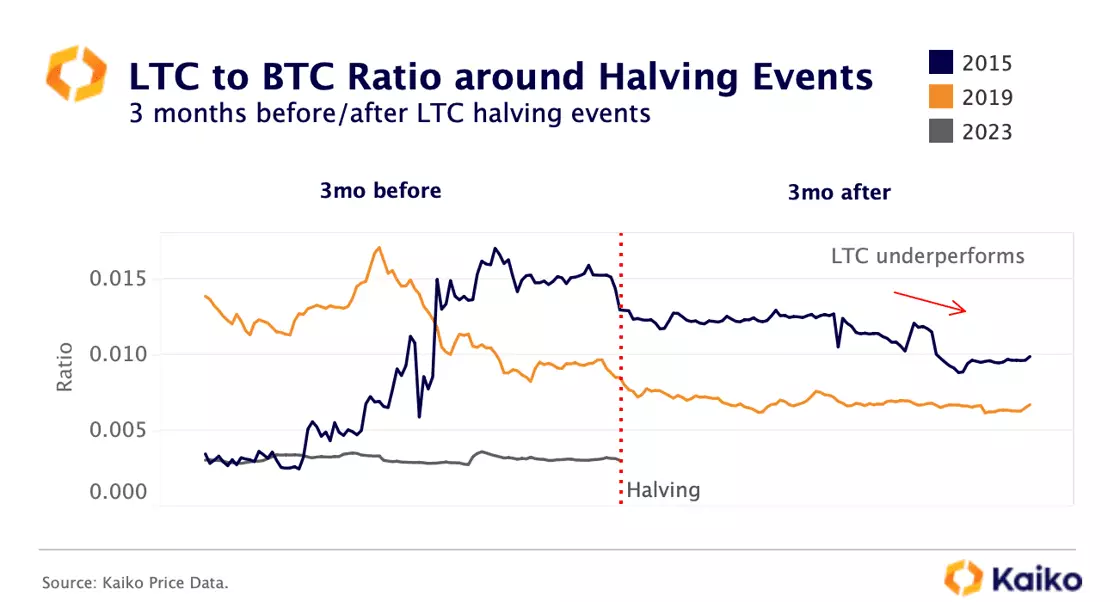
Last week, Litecoin went through its highly anticipated third halving event, a process that involves reducing miners’ block rewards for validating transactions. The main goal of halving is to control asset inflation and potentially boost the value of LTC over time if demand increases. However, contrary to expectations, the event did not result in significant price gains, as LTC’s value fell by 25% since August 2.
Looking at LTC performance relative to BTC before and after past halving events, this trend will likely continue. Historically, LTC has either performed in line with the broader market or underperformed after its past two halvings in 2015 and 2019. This suggests that halvings have been “buy the rumour, sell the news” events rather than significant price catalysts.
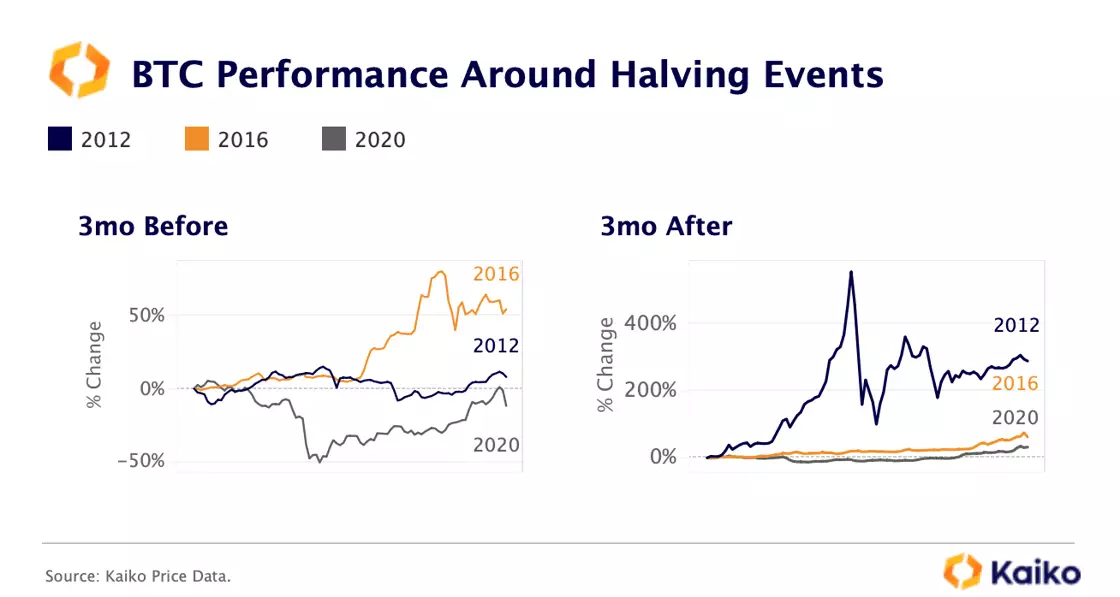
Bitcoin is also expected to undergo its own fourth halving event in April 2024. Historically, BTC typically outperforms after the halving, but its performance has gradually declined over the years as the market matures. Before previous halvings, BTC saw significant volatility in the months leading up to the event. However, so far, there hasn’t been a notable increase in leverage demand or trade volumes, which may indicate that traders are not heavily positioning for the upcoming halving at this stage.
2023 has been a tough year for trade volume.
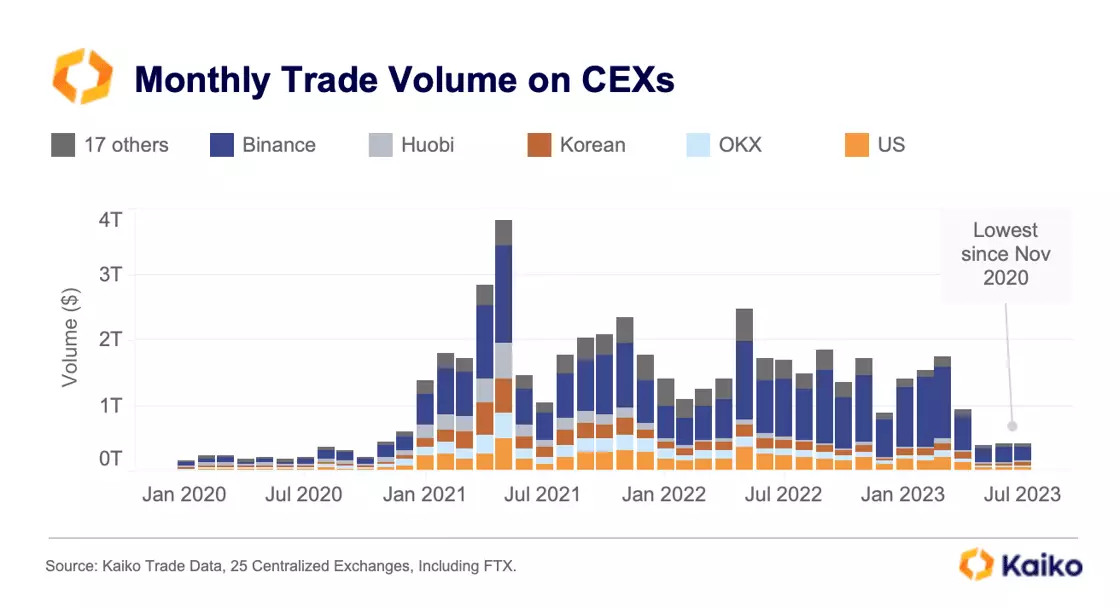
Despite Bitcoin surging by 75%, trade volume continued to fall in 2023 with nearly all exchanges registering double-digit declines in July relative to the year before. This has been mirrored by a collapse in long-term volatility and suggests overall market participation remains low.
U.S. exchanges (orange) registered the strongest drop in volume of around 80% on average. Coinbase saw a smaller decline in trade volume compared to the broad crypto market as it benefited from a flight to quality after the SEC lawsuit against Binance.US.
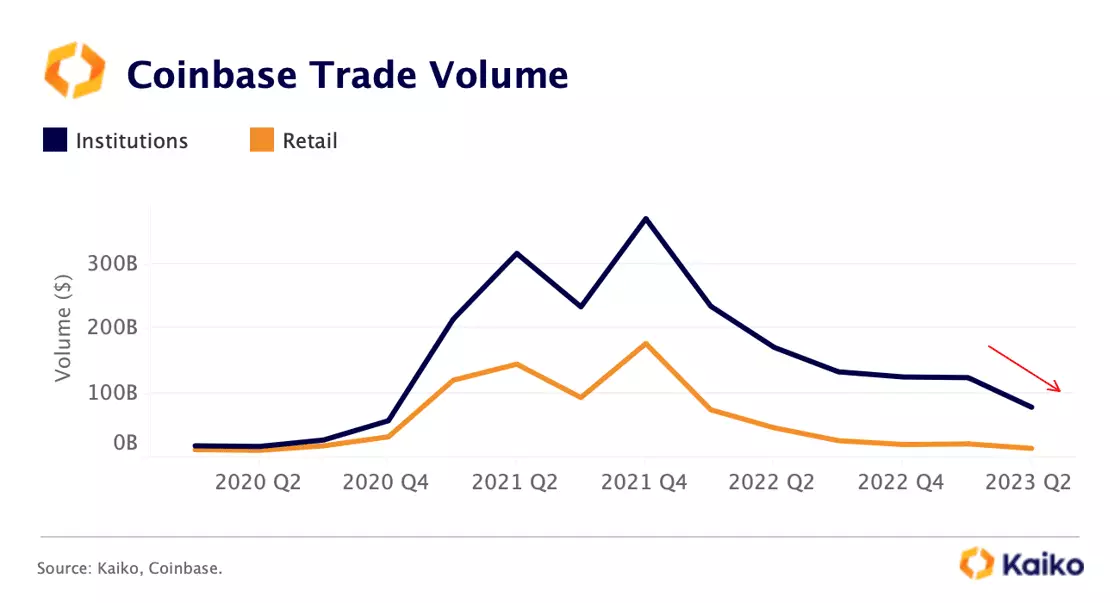
However, its earnings call last week revealed a strong decline in altcoins and institutional trading, suggesting the adverse regulatory environment has had an impact on the exchange. This has been mirrored by a steady increase in the share of BTC trading, which rose to 40% in Q2, from 32% in Q1, reaching its highest level since Q4 2020.
Memecoins take off as developers get serious.
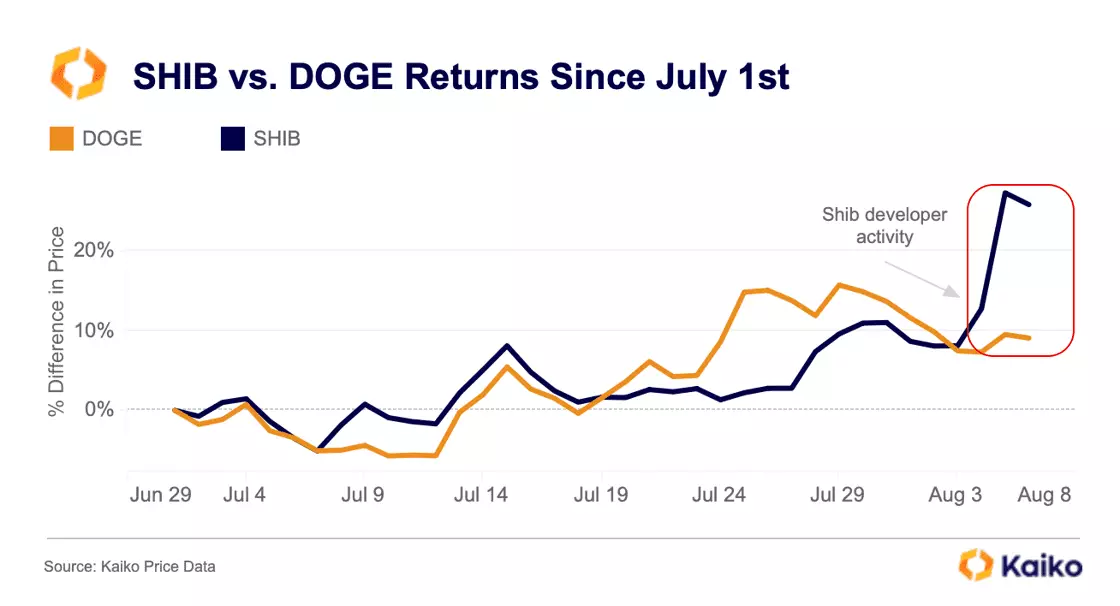
SHIB is no joke. At least that’s what the memecoin’s developers are striving for after announcing a new protocol for digital identity and starting tests for a bridge to the Ethereum network. SHIB is currently up 25% since the start of July.
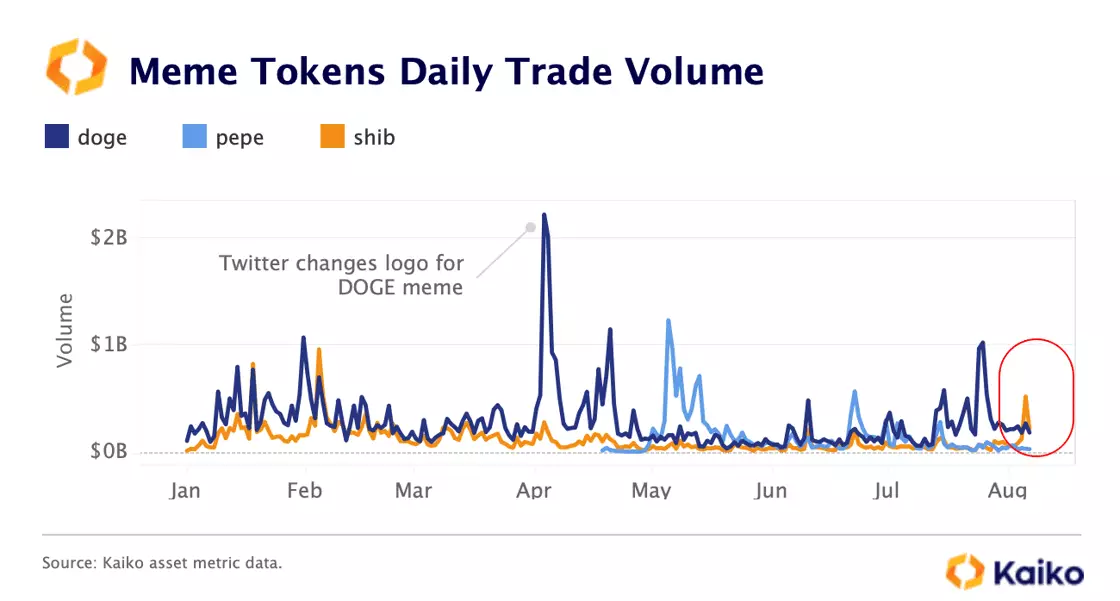
However, despite the price surge, memecoin trade volume remained lackluster in July despite a flurry of Twitter-related news boosting DOGE prices throughout the month. DOGE trade volume doubled to $8bn in July but remained below the yearly average of $11bn. SHIB trade volume was flat on the month at $1.7bn even though the upcoming Shibarium upgrade is expected to address the network’ congestion and scalability issues, boosting its attractiveness. The now third largest meme token by market cap, PEPE, has also lost steam with volumes down 70% relative to May’s highs.
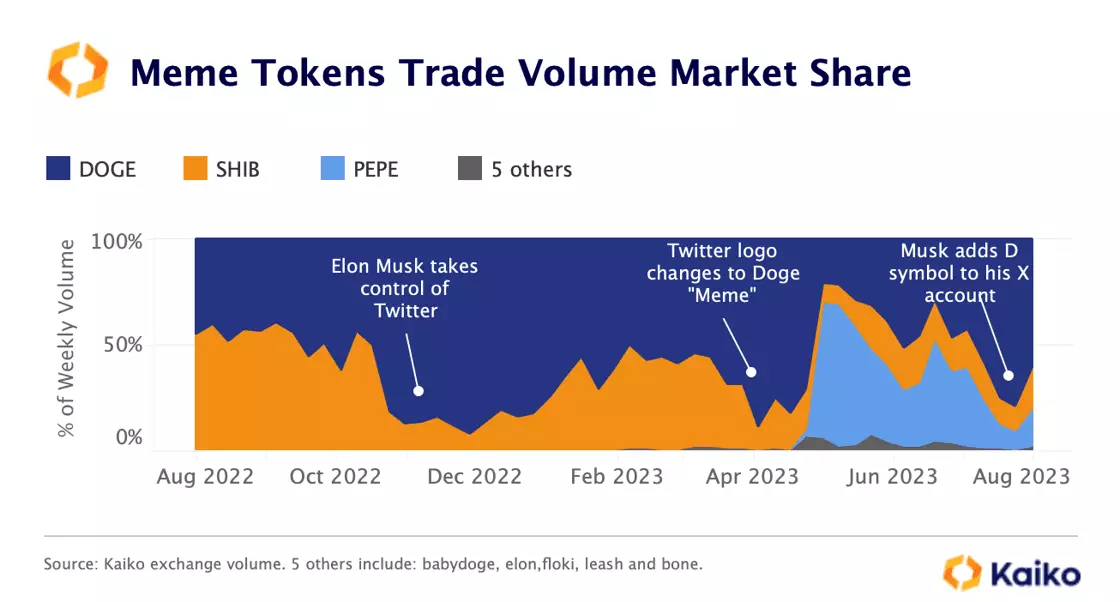
Looking at the market share of major meme-tokens, despite the emergence of PEPE, DOGE is by far the dominant token with 60% market share followed by SHIB and PEPE which both account for around 18% as of end-July.