Data Points
BTC Miners feel the heat.
Bitcoin miners remain under pressure after the fourth halving. Although they briefly benefited from higher network fees driven by Ordinals post-Halving in April, these fees have since decreased, averaging between $3 and $5, excluding a spike to $102 early June.

The decline in fees coincides with reduced block rewards, down to 3.125 from 6.25 BTC, leading some miners to sell their holdings. This trend could persist, potentially causing forced selling in the upcoming months.
For instance, Marathon Digital sold 390 BTC in May and plans further sales to fund operations and manage its treasury. In response to these challenges, miners may seek mergers to consolidate assets and increase efficiency. An example is Riot Platforms’ acquisition of 14% of rival Bitfarms for $2.45 a share in May. Such consolidations within the Bitcoin mining industry are expected to continue in 2024 as the halving’s impact unfolds.
Exchange listings cool off post-2021 bull run.
Crypto exchange listings growth has slowed from 9% during the 90 days before Bitcoin’s 2021 all-time high to 3% before its 2024 peak, suggesting increased caution due to higher regulatory scrutiny.

Looking at the breakdown by exchanges, Binance’s number of active trading pairs has risen at a much slower pace compared to other exchanges and remains 14% below its 2022 peak. In contrast, Bybit, the fastest-growing exchange during this year’s rally, has reached an all-time high in active trading pairs. New listings have also accelerated on Korean exchanges, particularly on Bithumb, which is outpacing Upbit in growth. This surge has caught the attention of local regulators, heightening fears of mass delistings in South Korea in recent weeks.

Interestingly, when examining the newly listed pairs this year by quote asset, the Turkish Lira has emerged as the most popular on Binance, surpassing FDUSD. There has also been a notable rise in trading pairs quoted in LATAM currencies, particularly with BRL and MXN leading this trend. This highlights the increasing demand for cryptocurrencies in emerging markets, driven by widespread inflation and, more recently, heightened FX volatility.

BCH sees net buying despite Mt Gox fears.
News last week that defunct Mt Gox will begin paying creditors sparked fears of a mass selloff, causing altcoins to drop and BTC to plunge to its lowest level in months. Mt Gox, which held an 80% market share between 2011 and 2013, is set to distribute its substantial BTC and BCH holdings in cash and in kind.
As we noted earlier, it remains uncertain whether creditors will hold or sell their assets. However, the liquidity gap between BTC and BCH suggests that large-scale selling could have a significantly stronger impact on BCH. Interestingly, the news did not have a lasting effect on BCH.
The cumulative volume delta (CVD), which indicates net selling or buying, briefly dipped into negative territory after the news broke but quickly rebounded as traders bought the dip.

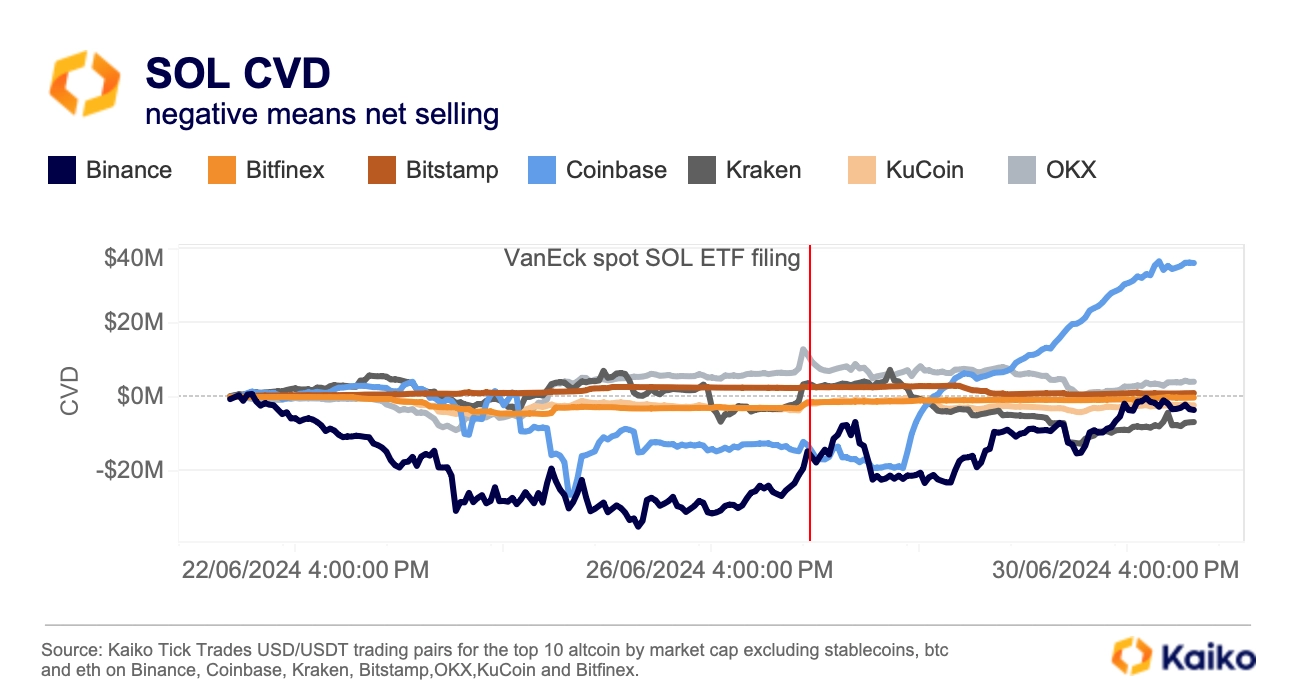
What’s even more surprising is that large-cap altcoins experienced widespread selling at the beginning of the week. The CVD for the top ten altcoins by market cap recorded a total negative of $180 million between June 21-25.
Altcoin liquidity improves in 2024.
Despite the recent market correction, altcoin liquidity has improved significantly this year. The aggregated 1% depth for the top ten altcoins by market cap currently stands at around $162 million, representing a 38% increase compared to the 2023 average. This suggests that altcoins are better positioned to withstand potential headwinds during the historically slow summer months.

While part of the increase in depth can be attributed to price appreciation in the first quarter of the year, the trend has persisted. Most altcoins have shown improvement relative to BTC since the 2021 bull run, indicating broadening adoption. The share of altcoins’ average daily depth as a percentage of BTC’s daily depth has increased the most for SOL, XRP, and DOGE.

Why are Asset Managers filing for joint BTC-ETH ETFs?
Last month, HashKey filed for a combined spot Bitcoin and Ethereum ETF, even before the debut of the latter as a single asset. Why is HashKey so eager to file? Kaiko’s Value at Risk (VaR) tool provides insights into the firm’s motivations, particularly the timing.
VaR is a risk indicator that assigns a dollar value to potential portfolio losses and their likelihood. It can be seen as an acceptable loss for a specific confidence level.
Analyzing an equally weighted Bitcoin and Ethereum portfolio during the 2021 bull run and this year’s record highs in January, we find that it would have yielded 58% in 2024, compared to 20.6% in 2021. Kaiko’s methodology considers crypto market idiosyncrasies when calculating VaR, offering a more comprehensive understanding of the portfolio’s risk profile.

Traditional investors could be drawn to these ETFs not only for returns, but also for the improved risk profile of a BTC/ETH portfolio. Using a 99% confidence interval for VaR, one of the more conservative levels used in traditional finance, we can see the realized daily profit and loss during the first quarter bull run.
The BTC/ETH portfolio maintains a manageable risk level and a balance of gains and losses. Assuming a 99% VaR of $10,000, statistically, we will have $10,000 in losses 1 day out of every 100, which we see below.


![]()
![]()
![]()
![]()


