BTC remained largely rangebound between $55k and $60k since June, but that could all be about to change. With the upcoming US election in November and the Fed’s ongoing rate-cutting cycle, Q4 could witness a significant improvement in sentiment, while also seeing a resurgence in volatility.
To gauge past, present, and future crypto market sentiment, we will use Implied Volatility (IV). First, we will revisit the August market crash, analyzing IV during the sell-off to comprehend the market’s response. Then, we will analyze options market positioning and headwinds using IV to gauge Q4 market sentiment.
What is IV?
Before diving into the analysis, here is a quick primer on IV and its meaning. IV is one of the most effective ways of determining risk in financial markets. It is a forward-looking measure of the expected volatility of an asset over a specified time period.
IV is derived from the current market price of an option contract, known as the premium. When a premium rises or falls, this signals increased or decreased demand. That change in demand tells us that traders are willing to pay more, or less, for certain options, signaling potential price movements in the underlying asset or increased risk perception.
For a deeper look at IV and how to use our IV tool download our latest report on options market dynamics and join our upcoming webinar.
Mitigating risk with IMPLIED VOLATILITY
Financial markets around the globe were roiled by the Bank of Japan’s decision to hike interest rates, as well as poor economic data in the US, at the beginning of August.
Crypto markets experienced significant volatility during this time, with BTC falling more than 12% over the first weekend of August.
Looking at IV during this market activity gives us insight into how traders viewed the crash. Below, we break down BTC IV with expiries fixed to monthly to show the evolution at one given point in time. Short-dated contracts have higher IVs than longer-dated contracts, which is known as an “inverted term structure.”
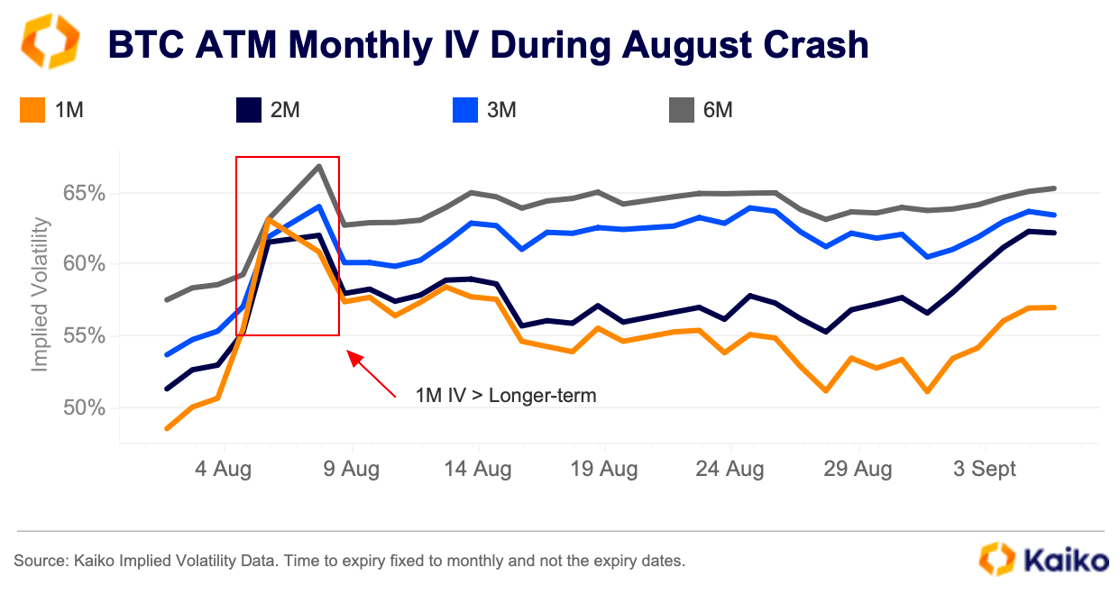
BTC’s IV term structure inverted on August 4, a day before BTC crashed below $50k for the first time since February. This signals panic in the markets and suggests a heightened probability of a risk event in the near term.
The term structure reverted before the broader market recovery. However, IV continued to slope upwards following the selloff. This indicates that, despite BTC’s price bouncing back, there was still a heightened perception of risk in the market.
Visualizing market crashes in real-time
One of several ways to visualize IV with Kaiko’s data is to create an IV surface. With this, we can also show how IV changed with regard to the strike price and time to maturity during the August crash.
On August 4th, before the market tumult intensified, we can see that IV was still relatively high for out-of-the-money options with higher strike prices and longer-term expiries. However, the market was beginning to price in some risk in anticipation of large price movements.
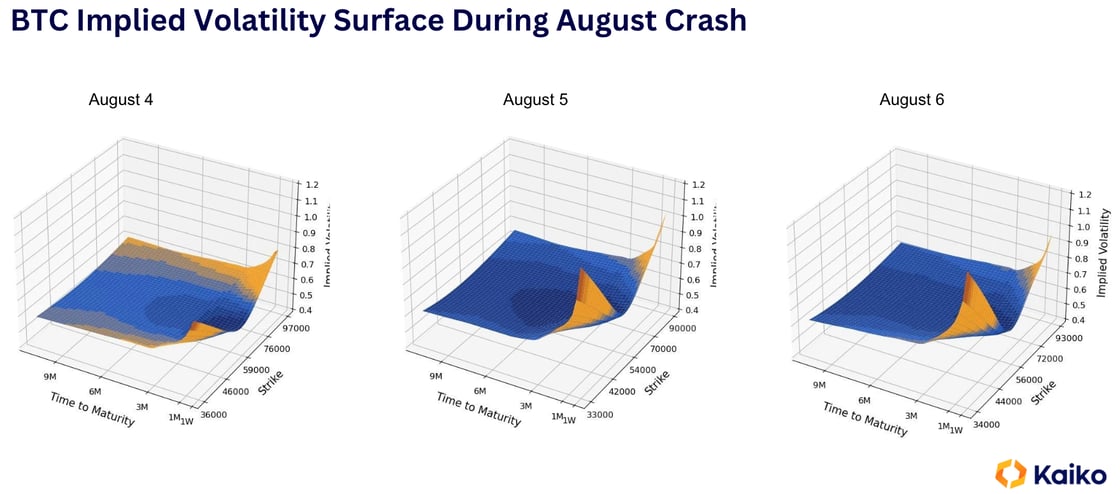
By the following day, Monday, August 5, we can see a clear spike in IV (yellow color) at high strike prices on options expiring in the near future. The jump in short-term IV tells us that there was a higher demand for protection against sharp price moves in the underlying asset, BTC. This was happening just as the market was showing signs of stress, symbolized by the hump in the IV surface.
what will drive volatility in the fourth quarter?
Besides the uptick in volatility linked to the August crash, the third quarter had been relatively quiet in crypto markets. At least until last week, when the US Federal Reserve cut interest rates by 50 basis points and signaled two more cuts before the end of the year.
The central bank has two more meetings before the end of the year, on November 7 and December 18. Last week’s jumbo rate cut boosted risk-on sentiment, and as we can see in the chart below, the October 4 contract briefly inverted with the October 25 contract before resuming a normal term structure.
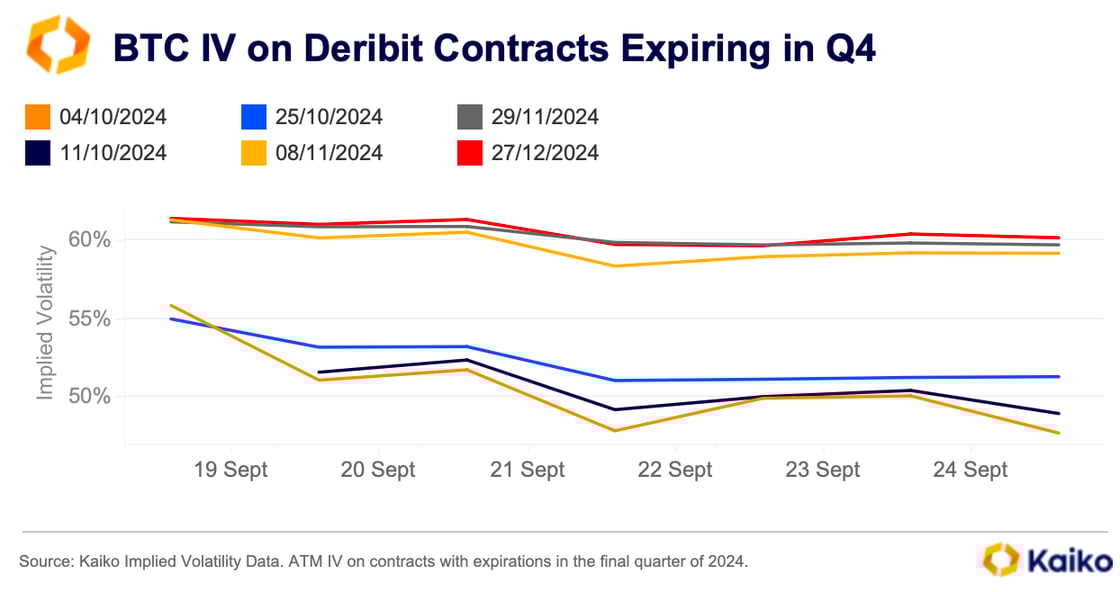
The November 8 contract also briefly inverted, and this is one to watch. The special US election contract offered by Deribit expires just 3 days after the American’s go to the polls, and just 1 day after the Fed’s next meeting.
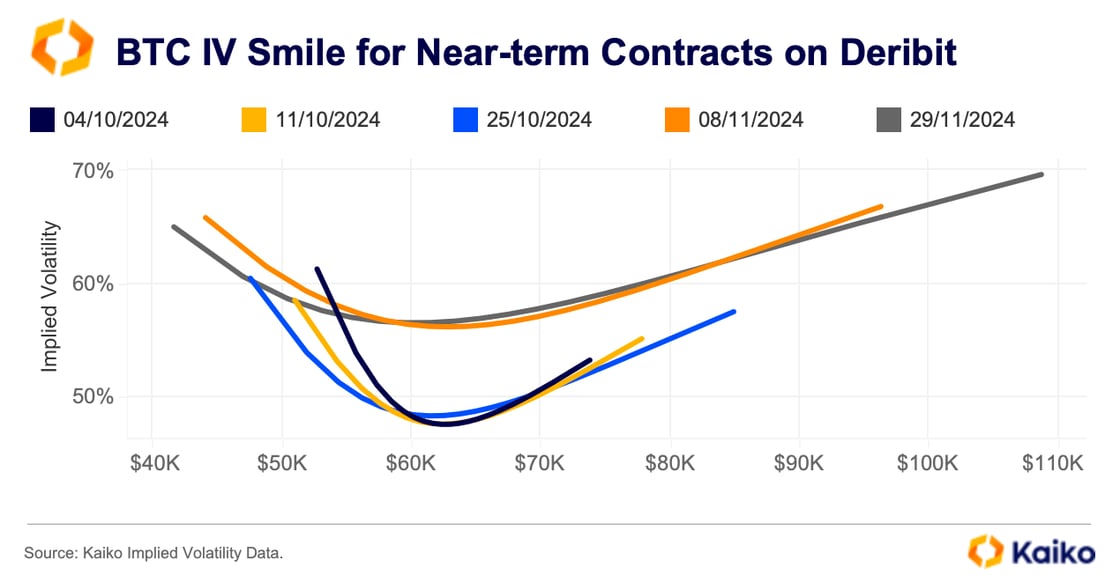
The increased skew to the right of the IV smile chart below suggests more demand for calls and is an indication of increased bullish sentiment in crypto options markets. The IV smile for the November 8 contract is quite high, which implies that these two events could lead to increased volatility. The smile is skewed slightly to the right on both the November 8 and 29 contracts, which indicates bullish sentiment in the market.
While rate cuts have been the primary driver of price increases this month, some of the increased bullish sentiment can be attributed to the US election.
The influence of cryptocurrencies in politics has grown significantly this year since former President Donald Trump pledged to support digital assets in the US and even spoke at the Bitcoin conference in August. More recently, Democratic candidate Kamala Harris said she would support digital asset innovation in the US.
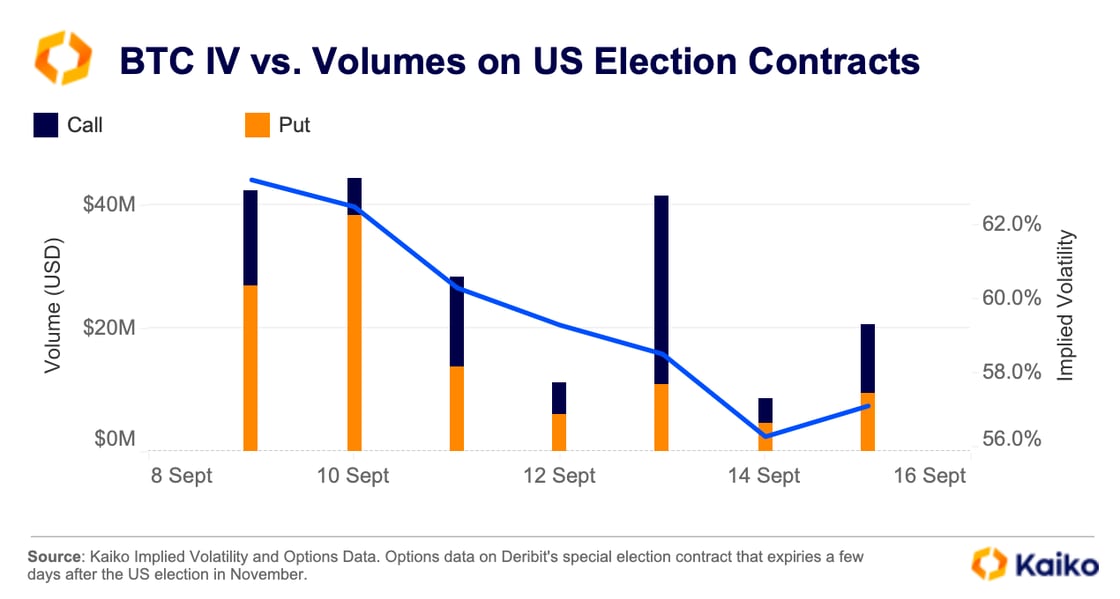
IV on the US election contracts spiked in the run-up to the first debate between Kamala Harris and Donald Trump in September. Volumes also increased on the day of the debate, with traders buying $38 million worth of put options as Donald Trump reportedly underperformed in the debate. However, just two days later, traders piled into calls following encouraging inflation data in the US.
conclusion
IV can play a crucial role in determining and managing risk in the options market, as well as measuring sentiment.
Keeping an eye on IV shows us where demand is in options markets. This demand is often a precursor to moves in the spot market, as seen with the August crash—as demand rose shortly before BTC fell to its lowest point since February.
IV can also help us gauge market sentiment. For instance, the increased bullishness following the Fed’s first cut—as well as Harris’s comments on digital assets—suggests the market is positioning for BTC to outperform in the fourth quarter after a lackluster third.