Supply overhang and liquidity woes
Supply overhang has been a topic in crypto markets throughout the summer. In particular, the potential for forced selling and the liquidation of bankrupt crypto estates have caused selling pressure at different stages between May and August.
The ongoing redistribution of funds to Mt. Gox creditors has been one of the overarching sources of fear in the market since May. The bankrupt crypto exchange’s estate has just over 46k BTC left to redistribute to creditors, representing more than $2 billion. However, this doesn’t necessarily mean these funds will be sold. Many holders could hold onto their funds; however, the first batch of redistribution, accounting for 100k bitcoins, has been followed by heavy selling in the market.
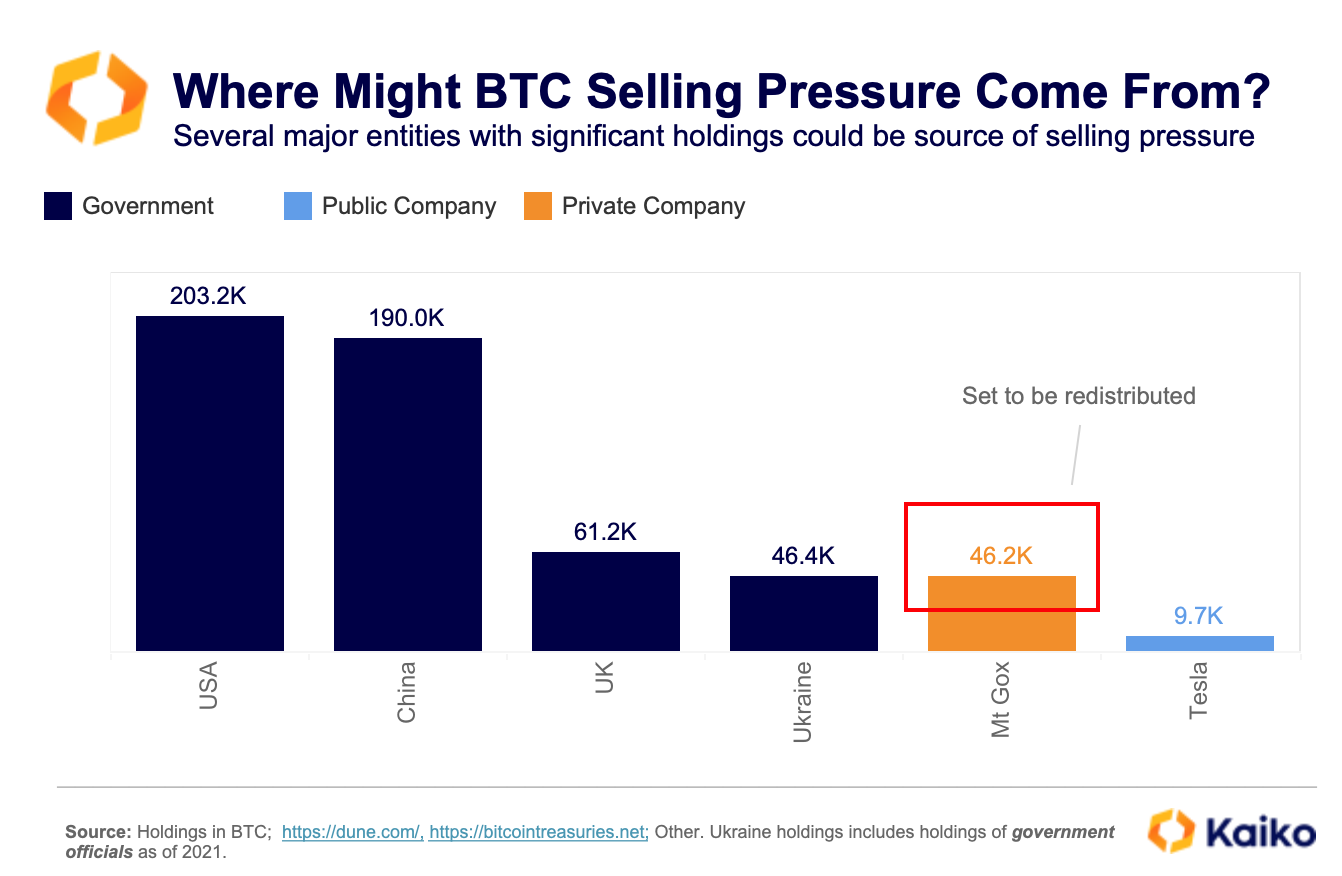
Beyond the $2.72 billion Mt. Gox has left to redistribute, there are several other prominent holders that could be potential sources of selling pressure in the coming months. These include the US government and its hefty haul of over 200k BTC, as well as other governments such as the UK, China, and Ukraine. Tesla, which hasn’t bought or sold BTC since 2022, could look to sell some of its holdings again in the future to fund new ventures.
With this supply overhang weighing on market participants, we decided to peel back the layers of liquidity metrics and give some insight into why liquidity matters and measure the impact of large holders’ portfolio liquidations.
Scratching the surface with trade volume
Trade volume provides us with a broad view of the realized liquidity level on an exchange. The daily trading volume on the top ten cryptocurrency platforms has surged by 30% since 2023 and has been mainly driven recently by the launch of spot BTC ETFs in the US.
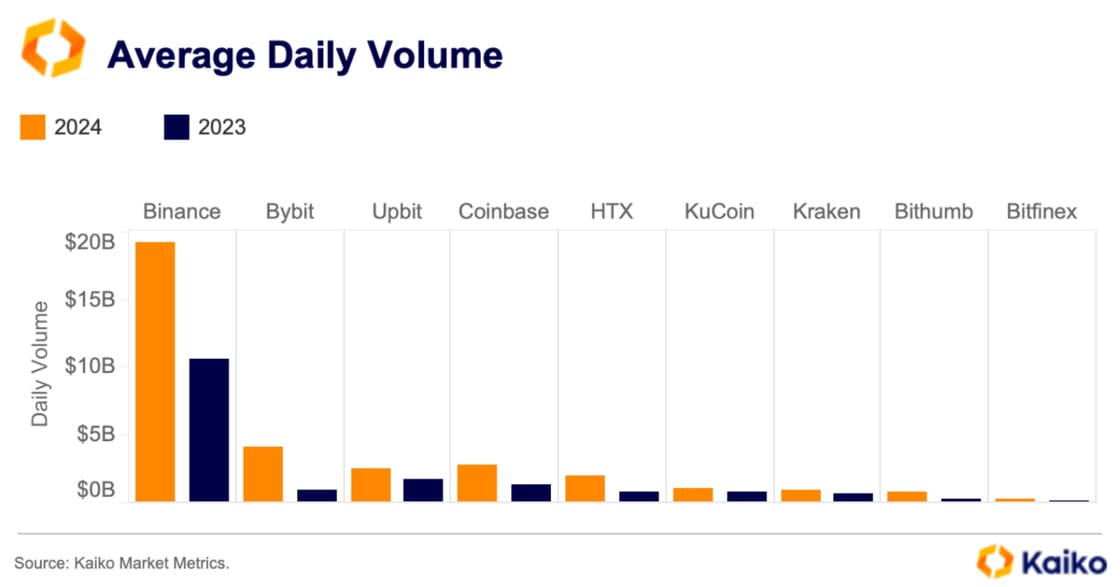
Binance remains the dominant player in the market, with an average daily volume of $19 billion — four times higher than the second-largest platform, Bybit, which averages $4 billion, and nearly five times the volume of the leading U.S. platform, Coinbase, which averages $2.8 billion daily.
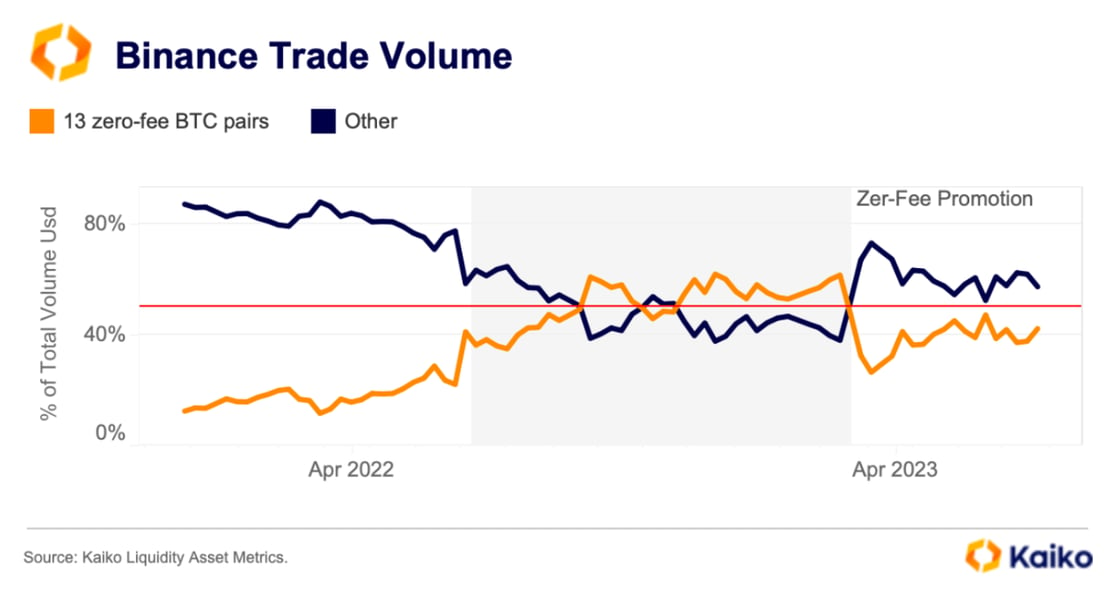
Does this mean that liquidity has improved across the board or that exchanges with the highest volumes offer greater market conditions than others with lower volume? Not exactly. Trade volume alone is not always the most reliable liquidity indicator: volumes are also heavily influenced by exchange fees and incentives, such as large-scale zero-fee campaigns. For instance, Binance’s Bitcoin zero-fee promotion, active from July 2022 to March 2023, substantially boosted its trading volumes. This promotion played a crucial role in maintaining Binance’s dominance during the 2022 bear market, with zero-fee trades accounting for over 50% of its volume during much of the campaign.
Looking at liquidity through a different lens
We believe it is important to consider additional metrics for a comprehensive view of crypto assets’ liquidity. As such, we find that it’s best to use trade volume in conjunction with market depth.
We define market depth as the market’s ability to sustain relatively large market orders without impacting the price of the underlying asset. Market depth is computed using order book data, and so, in contrast to trade volume, it gives a forward-looking view of liquidity, answering questions like: What volume of bitcoin is available to buy at prices that range between the best ask and +1% of that price?
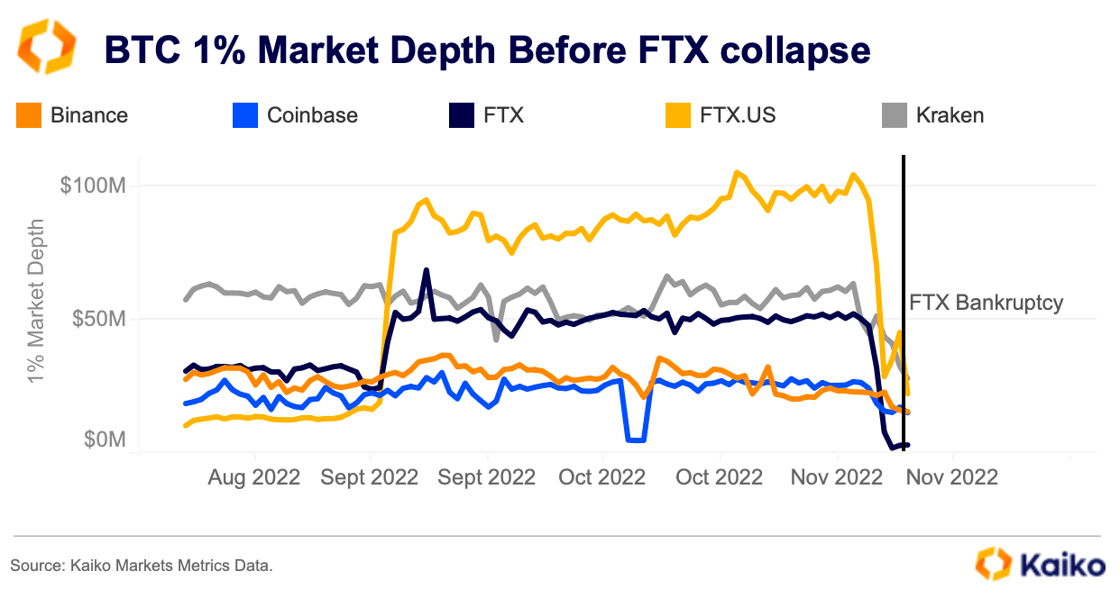
The chart below shows bitcoin’s 1% market depth before and after the FTX collapse, averaged across all cryptocurrency exchanges listing bitcoin. Interestingly, we find that depth across exchanges rose in the months leading up to the collapse, but this does not necessarily imply that everything was functioning well at the time.
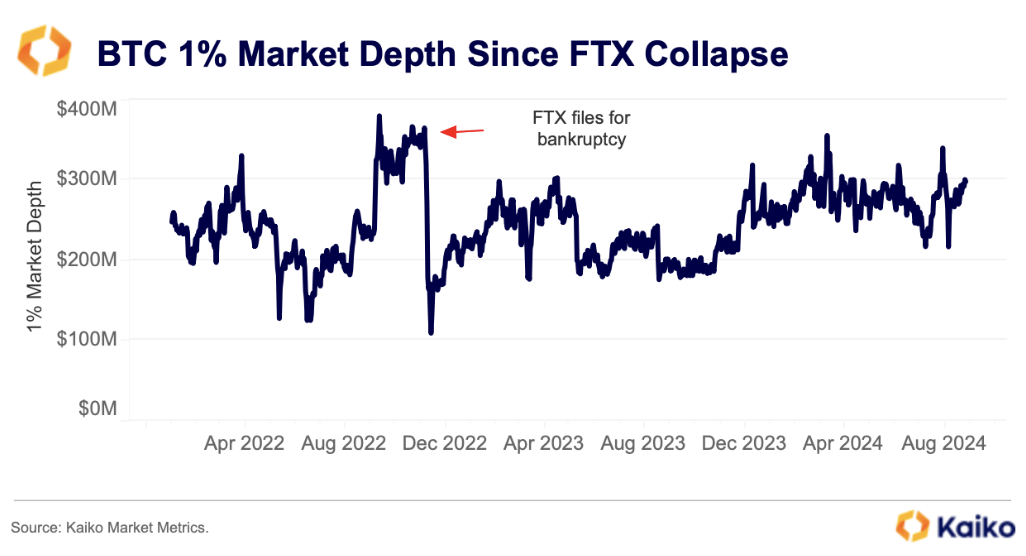
Much of the increase was linked specifically to FTX, as well as its US entity, FTX US.
These exchanges have been ones of the fastest-growing exchanges at the time. Both were supported and linked to one of the largest market makers active in crypto, Alameda Research. We now know that FTX and Alameda had a shady relationship that involved co-mingling user funds. This relationship likely explains the large increase in market depth on FTX and FTX.US in the lead up to its collapse.
The FTX collapse was a prime example of why it’s important to look deeper into an asset’s liquidity across crypto venues, revealing unique insights into an exchange’s market structure and health.
Another indicator to consider when assessing a market’s consistency is the volume-to-liquidity ratio. To measure this, we take the daily total volume for an asset and divide it by its average 1% market depth. A high volume-to-market depth ratio suggests that volume far surpasses current available liquidity. This is often used to raise concerns about inflated volumes on an exchange, and thus wash trading, as we have explained in past research.
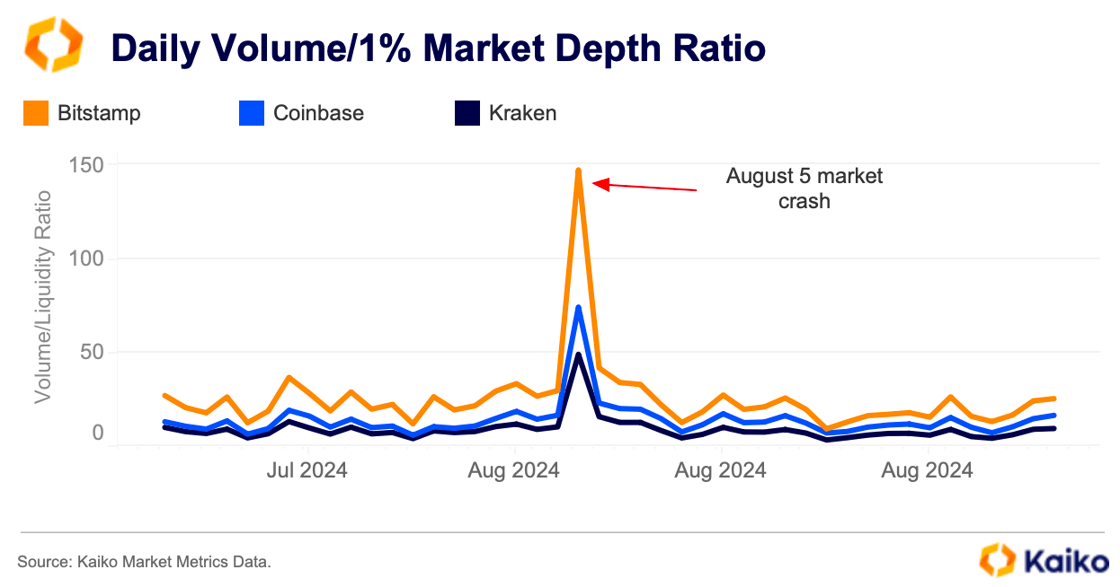
It can also be used as an indicator of an exchange’s capacity to handle market volatility. Looking at this ratio during the summer, we actually found that it peaked during the August market crash on all exchanges, but relatively more on those with the highest ratio. This suggests that these exchanges went through higher market pressure, with their order books being relatively more impacted than others. These observations coincide with those made using other liquidity indicators, like slippage, explained in the next section.
What happens to liquidity when things go wrong?
The most recent crypto market crash was a good test to assess exchanges’ efficiency. During the weekend of August 2nd, liquidity across crypto exchanges was affected as prices plunged. Driven by macroeconomic factors and structural changes in FX markets, volatility spiked and BTC dropped around 20%—briefly trading below $50k for the first time since February 2024.
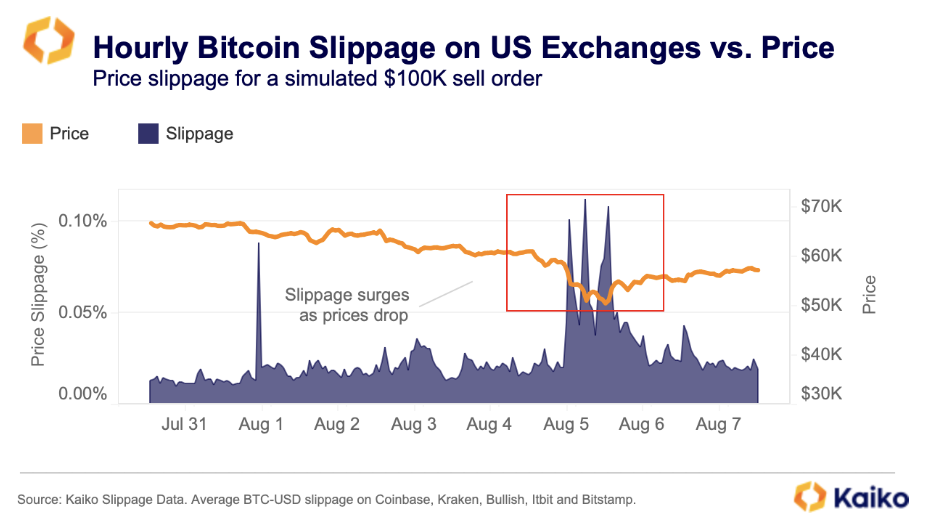
The market tumult was punctuated by changes in some crucial liquidity indicators, namely price slippage—the difference between the expected price of a market order and its actual execution price.
Increasing uncertainty made it more difficult to fill orders at the desired prices, creating spikes in volatility and price slippage. On August 5th, as US job market data was made public and rumors of a potential recession gained traction in the market, slippage for BTC-USD on major US exchanges tripled within hours. Notably, it remained elevated on average after the sell-off, indicating ongoing uncertainty.
 Zaif’s BTC-JPY pair experienced the highest slippage on the day of the sell-off. Much of the market strife was linked to an unwinding carry trade, which relied on borrowing JPY at low rates to reinvest in high-yielding US Treasuries.
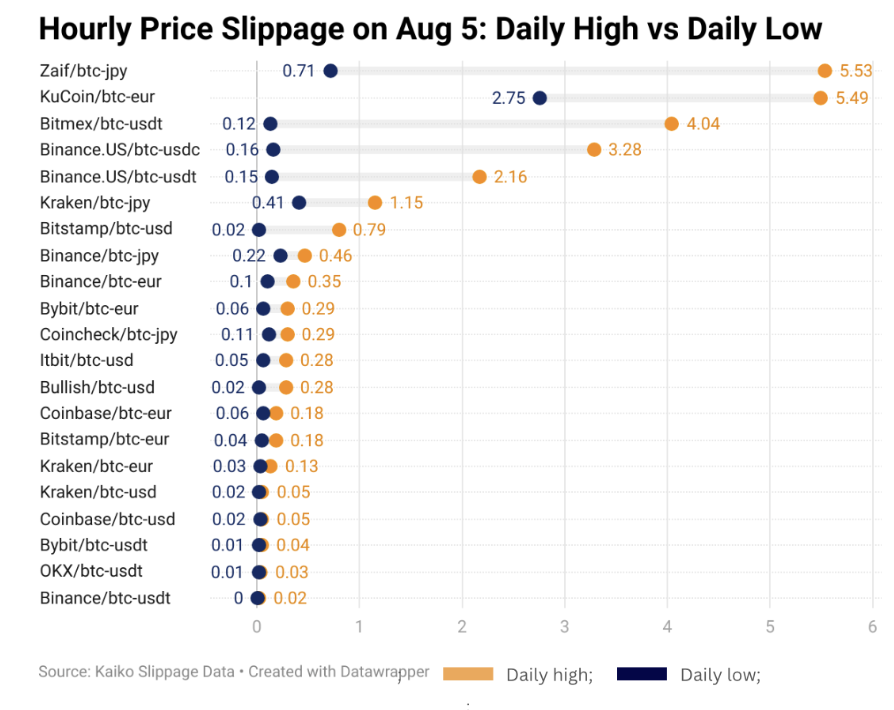
While Europe’s equities market performed better than those in Japan and the U.S., partly due to its lower exposure to tech and the yen, KuCoin’s BTC-EUR pair saw similar slippage, exceeding 5% on that day. Surprisingly, even stablecoin-quoted pairs, including USDT and USDC on BitMEX and Binance US, which are known for being relatively more liquid compared to fiat-quoted pairs, experienced significant slippage, with increases of more than 3 basis points compared to normal market conditions.
Fine-tuning slippage management.
When large orders face exchanges’ order books, they are typically executed across different price levels until the whole requested volume is filled, moving the market’s mid price. The higher the order’s size, the higher the price impact and, thus, slippage will be on a specific market. Price slippage is therefore considered both a liquidity indicator and a direct cost of trading on an exchange.
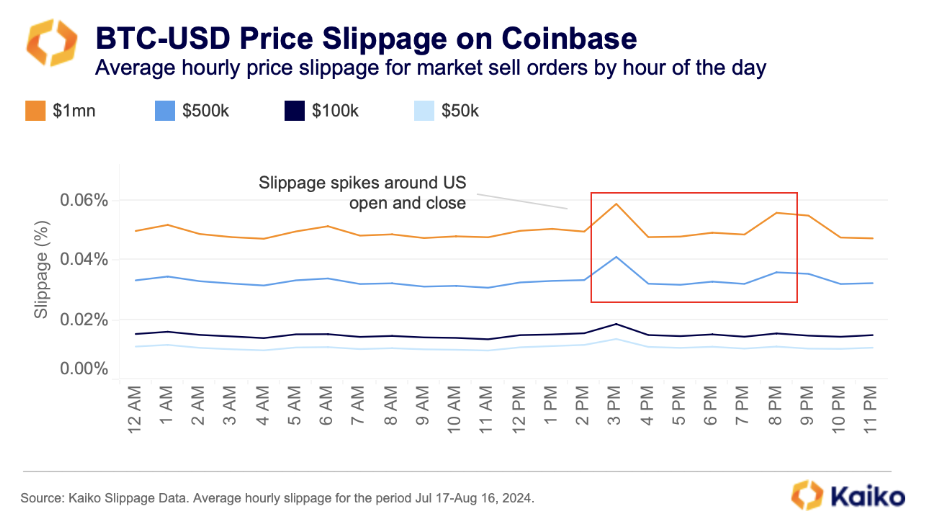
Slippage can also vary between exchanges, trading pairs, and times of the day, making overall slippage management particularly challenging for market participants. Kaiko’s slippage calculator enables the simulation and comparison of BTC price slippage for different sizes of sell or buy orders across exchanges.
For instance, the hourly BTC-USD price slippage for a $100k sell order on Coinbase tends to increase at the start and end of U.S. market hours (15:00 UTC and 20:00 UTC, respectively). This may be due to higher volumes executed during these hours, particularly since the launch of BTC ETFs in the United States, which puts greater pressure on market liquidity, as shown in past research.
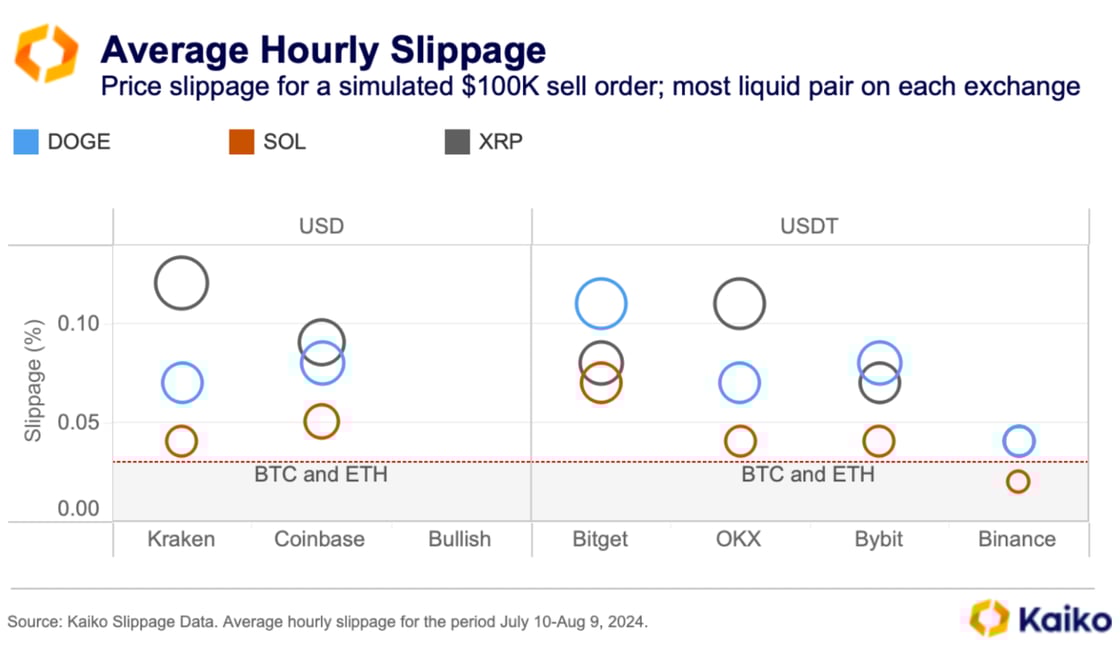
Kraken is a little different, Bitcoin slippage peaks around 14:00 UTC but tends to decline afterward, reaching its lowest point around 23:00 UTC. Slippage also varies between assets. Even the most widely traded altcoins have significantly higher slippage — on nearly all exchanges. The low integration of crypto markets with global FX markets adds another layer of complexity, further increasing the cost of large sales for traders.
Conclusion.
Liquidity in crypto markets has improved since the collapse of FTX, and the introduction of new products like BTC and ETH ETFs has accelerated this process. However, it remains a tricky beast. A better understanding of liquidity can mitigate fears related to the liquidation of large holdings.
It’s not simply a case of looking at volumes or market depth in isolation; it requires a combination of several indicators. Therefore, understanding the potential impact of the current supply overhang and any impending large liquidations is not a straightforward task.
Take the Mt. Gox estate, which still has around $2.72 billion to return to creditors within the next year. What will this look like? We know the estate works with Kraken on the redistributions. Kraken has handled BTC ETF flows with just a minor increase in slippage at the US market close. Its liquidity profile suggests that any additional selling pressure from the Mt. Gox repayments is unlikely to cause structural issues that could affect the broader market. However, to effectively track liquidity going forward it is important to use various metrics in combination with one another, as different events impact different indicators.