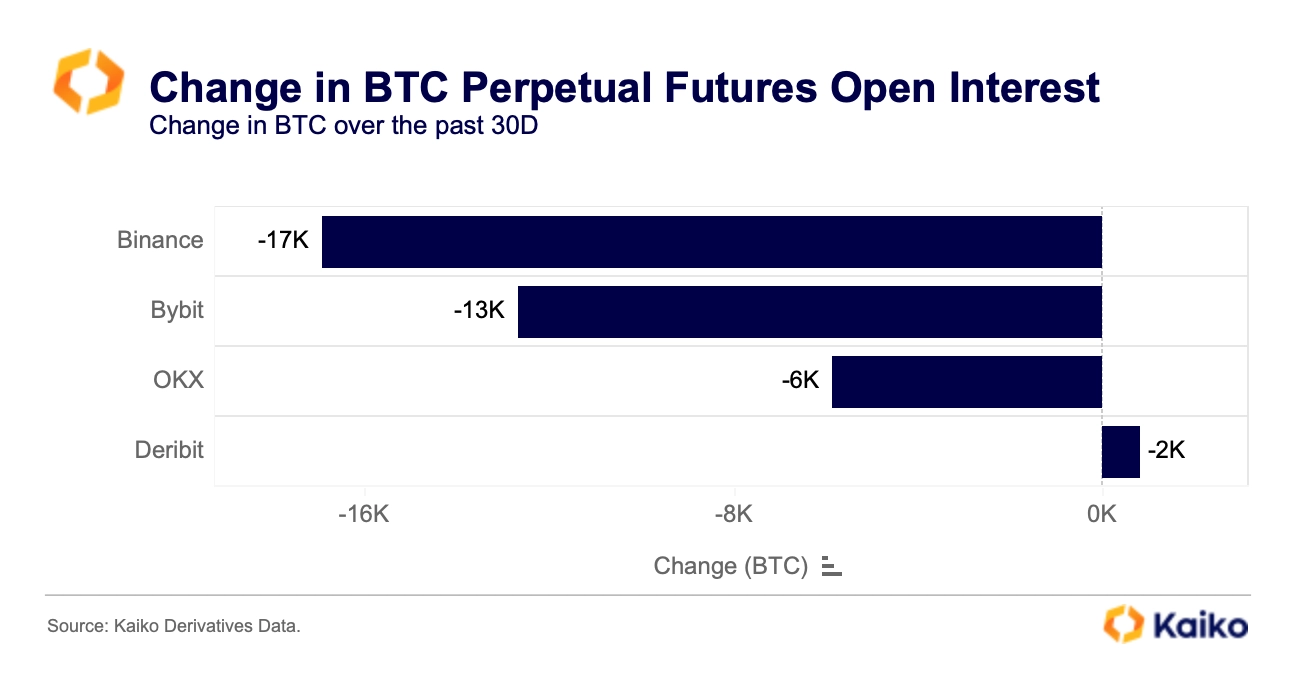
Crypto derivative markets have come back to life this month as traders price in the possible approval of a spot bitcoin ETF, which could come as early as January. However, as leverage rises, so does the risk of cascading liquidations. Over the past month alone, BTC saw over $720mn in short and $400mn in long liquidations – as well as the largest single-day liquidation event since the August selloff.
Most of these liquidations took place on Binance, which led to the Chicago Mercantile Exchange (CME) topping the list of the largest BTC futures markets by open interest (OI), overtaking Binance for the first time in two years.
Crypto exchanges all have slightly different liquidation mechanisms, margin requirements, and fair value estimation methodologies that impact the speed and number of positions being liquidated. While most platforms have various measures to reduce the risk of unnecessary liquidations in time of market volatility – or due to manipulation or illiquidity – the computation of stable, manipulation-resistant prices remains an essential input for the settlement of financial derivatives.
Determining a liquidation price is particularly challenging because the crypto market is notoriously fragmented, with trade volume and prices across exchanges exhibiting strong fluctuations.
In today’s Deep Dive, we explore the mechanics behind margin calls and the importance of pricing data. The pricing methodology used by a derivatives exchange can have a huge impact on liquidations.
We compare some common aggregation methodologies with one of our newest data products, Robust Pair Prices (RPP), which is designed to be outlier-resistant while still incorporating a diversity of price feeds reflective of real market prices.
How does a margin call work?
In traditional finance, a margin call can occur when an investor borrows money from a broker in order to leverage its investments. Many large crypto derivative exchanges still offer up to 125x leverage, while some can go as high as 200x.
A margin call is issued when the equity in a margin account falls below a certain level. It refers to the broker’s demand to provide additional money or securities so that the investor’s equity rises to a minimum value indicated by the maintenance requirement. Most brokerages have their own margin level requirements. If the demand isn’t met, the broker can close out any of the investor’s positions to bring the account up to the minimum maintenance value.
Determining when to close a position, or “liquidate”, is where price data comes in. Every investor has their own liquidation threshold depending on the value of their position.
Moreover, one of the greatest difficulties in determining a fair market value and avoiding unnecessary liquidations lies in estimating the value of illiquid assets. In crypto markets, there are derivatives contracts for dozens of assets across the liquidity spectrum; the less liquid the asset, the more subject its price is to volatility and manipulation.
Methodology Analysis
To show how important pricing methodologies are, we will compare three different methodologies over normal conditions and stressed conditions. We will compare Kaiko’s Robust Pair Price (RPP) and two aggregation methodologies widely used by other data providers: the Volume Weighted Average Price (VWAP) and the Volume Weighted Median (VWM).
RPP leverages a weighted median methodology designed to minimize outliers in prices and in volumes. We proved theoretically and numerically in an academic paper that our methodology is more robust and efficient than the existing ones. VWAP is calculated by averaging traded prices with a weight equal to the traded volume while VWM is computed as a usual median, though each price is weighted by its volume.
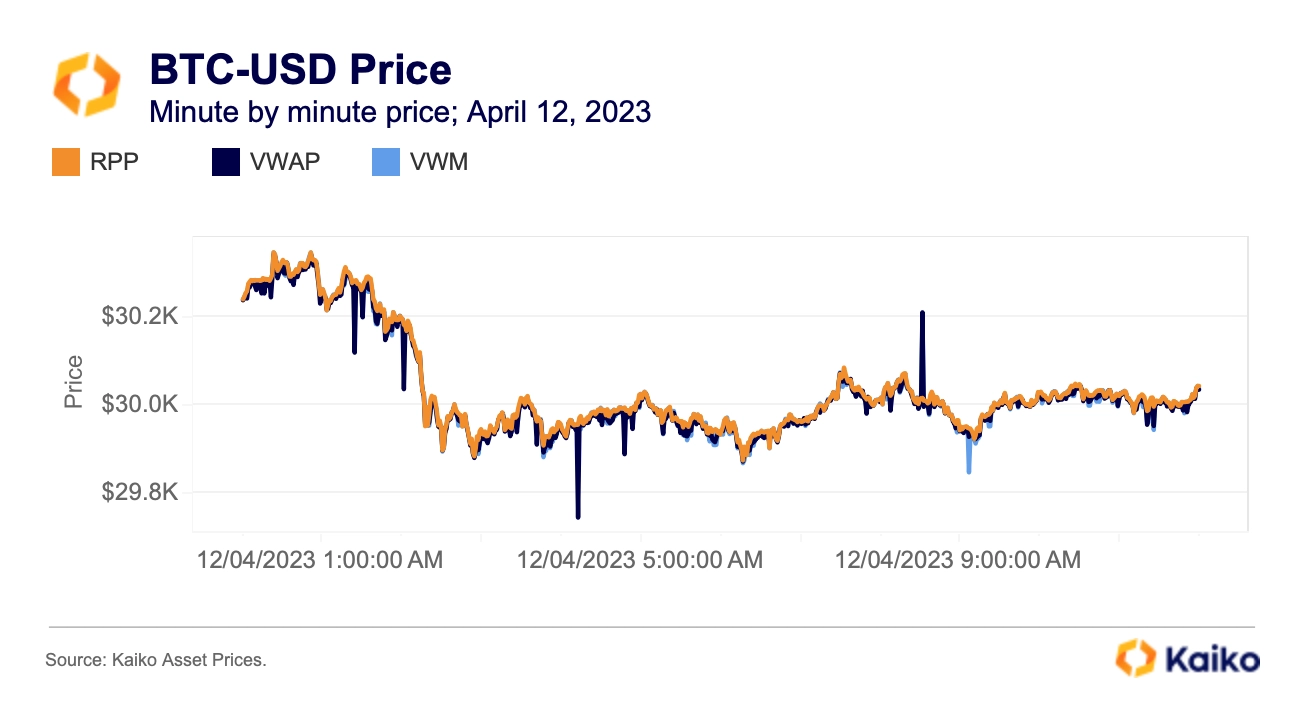
Normal conditions (2023/04/12)
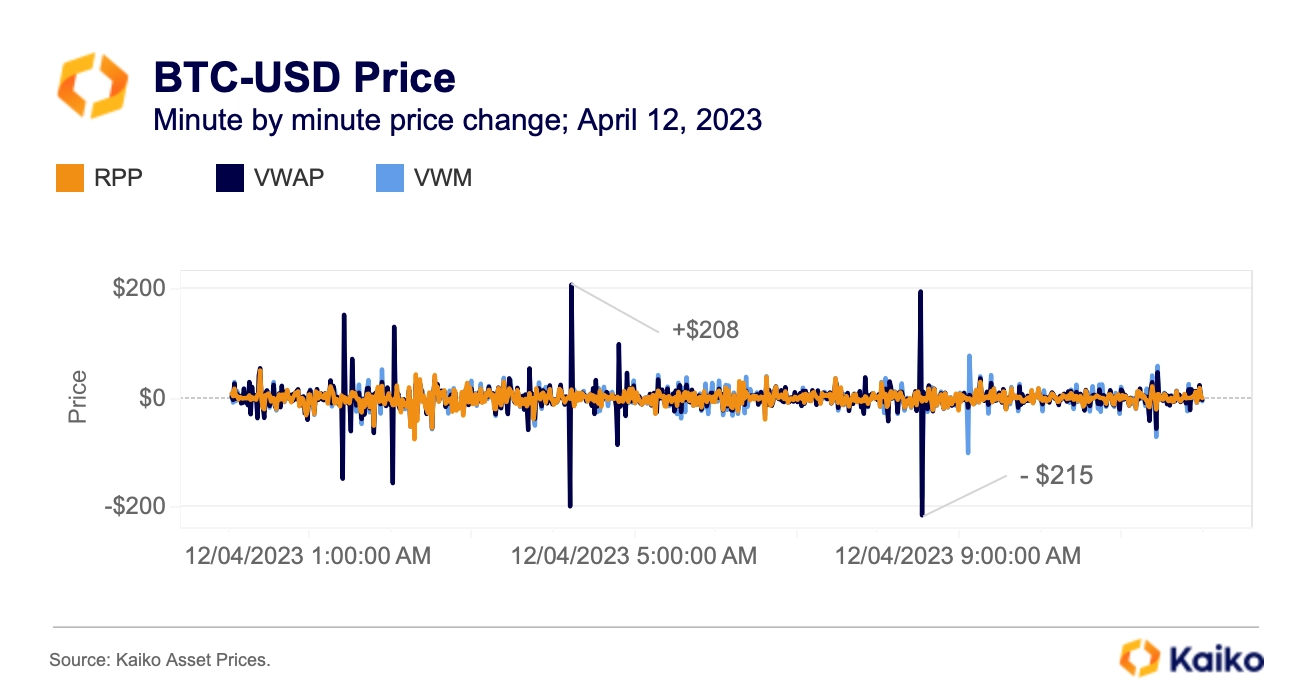
During normal conditions, even for a very liquid pair (e.g. BTC/USD), we observe some large noisy price deviations using either the VWAP or the VWM.
Intra-minute price changes hit $200 using VWAP, while RPP showed just $75 in this time frame.
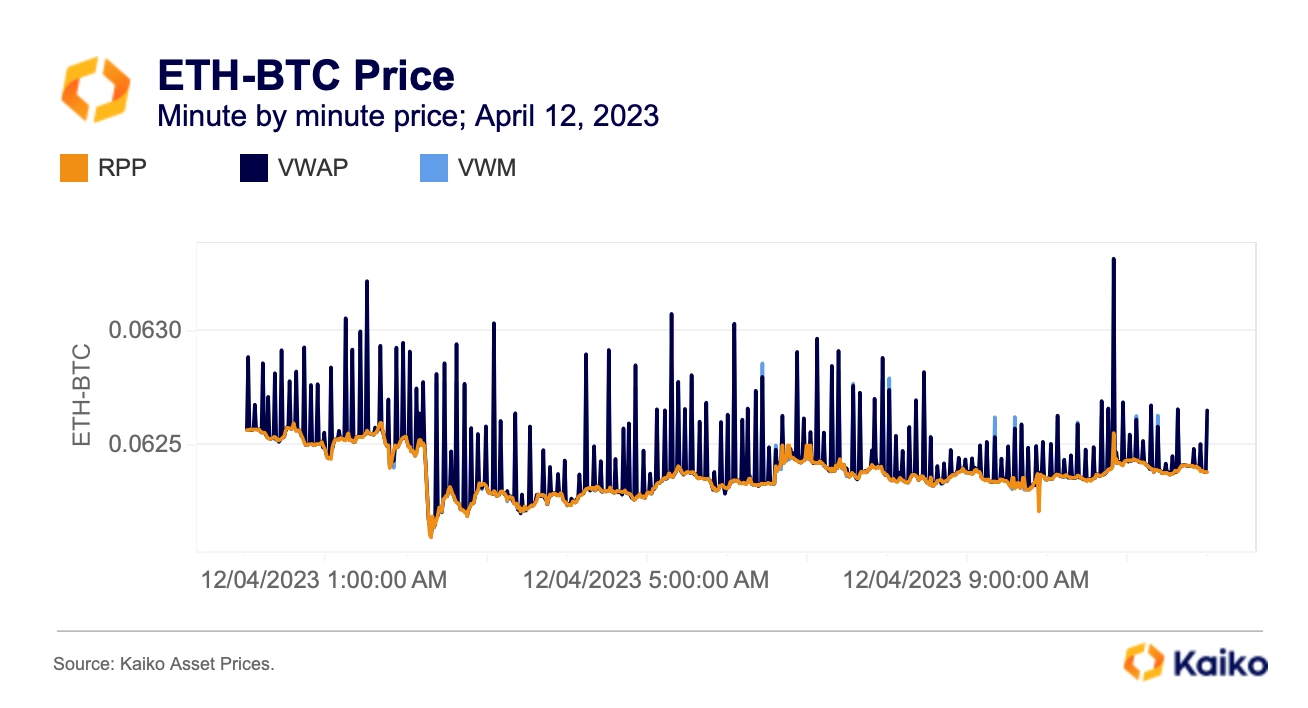
This behavior is amplified when dealing with less liquid pairs (e.g. ETH/BTC) with the minute-by-minute VWAP varying significantly on April 12th.
Stressed conditions (2023/03/11)
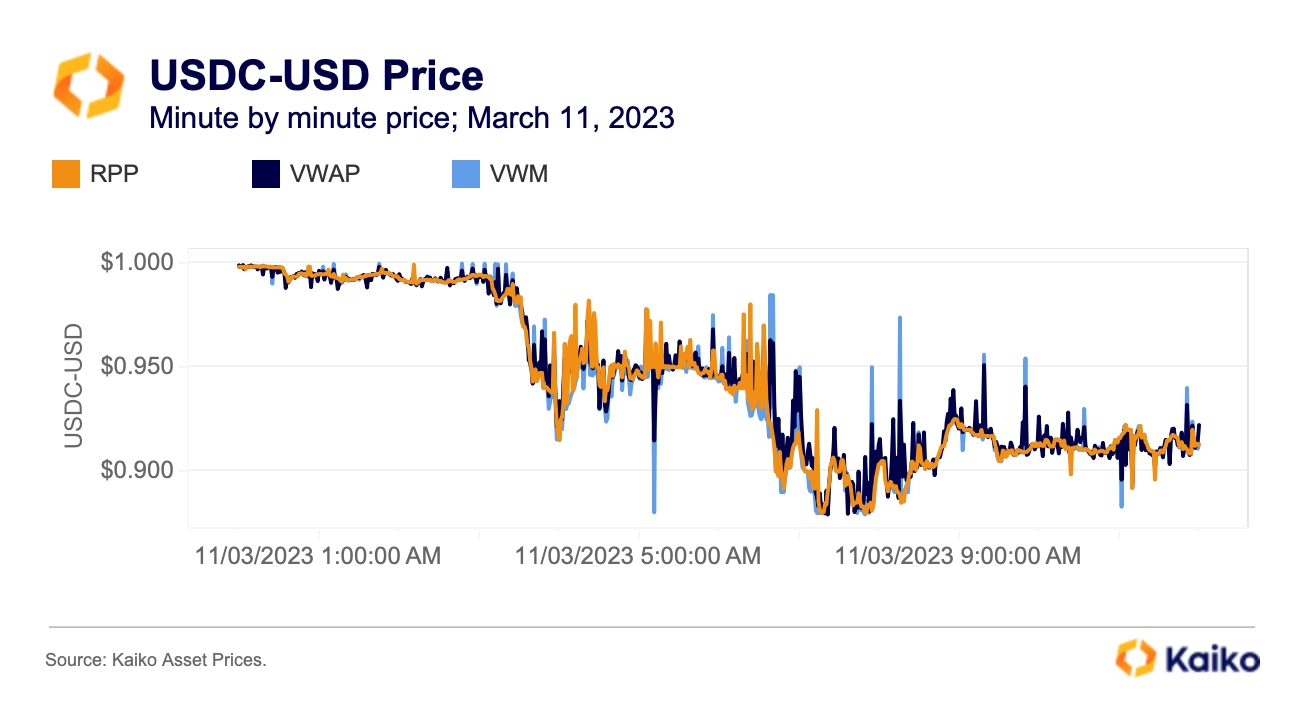
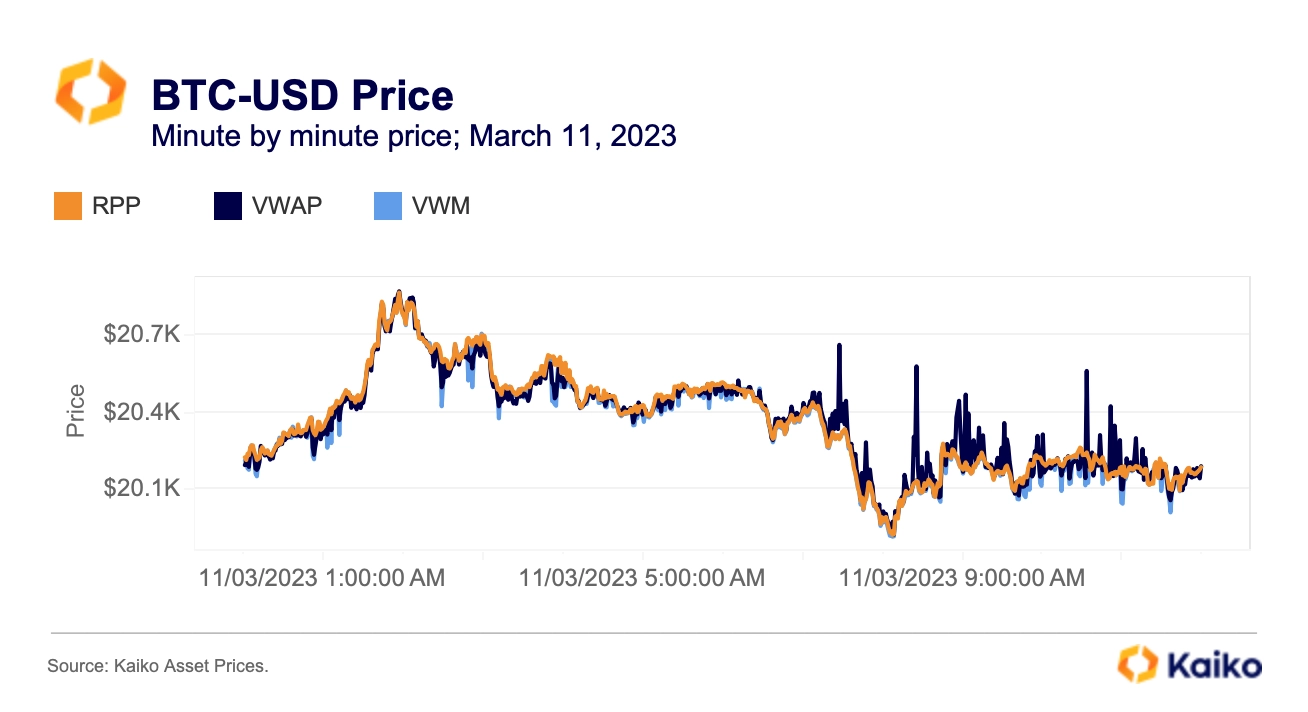
The deviation of BTC-USD prices using different price aggregation methods is even more striking during stressed market conditions. During USDC’s depeg, there were price deviations of up to 5% on BTC/USD and 40% on USDC/USD between our methodology and the two others.


![]()
![]()
![]()
![]()


