Data Points
Why pricing methodologies matter.
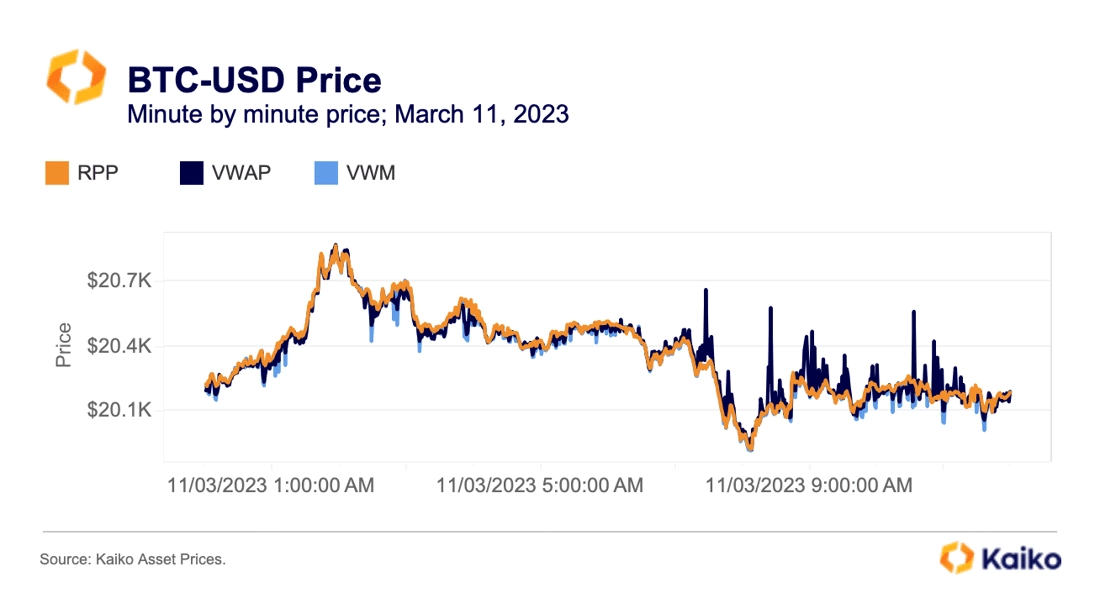
Crypto derivative markets have come back to life over the past weeks, experiencing a wave of liquidations as spot prices rallied. In our latest Deep Dive, we explore the mechanics behind margin calls and the importance of pricing data.
We compare some common price aggregation methodologies with our new pricing service, Robust Pair Prices (RPP), which is designed to be outlier-resistant while still incorporating a diversity of price feeds reflective of real market prices. We find that the RPP outperforms other price aggregators, especially in times of market stress. For example, even for very liquid trading pairs such as BTC-USD there were price deviations of up to 5% in the wake of the Silicon Valley Bank (SVB) collapse, between our methodology and the two others.
View Deep Dive
Has FTX sold its SOL yet?
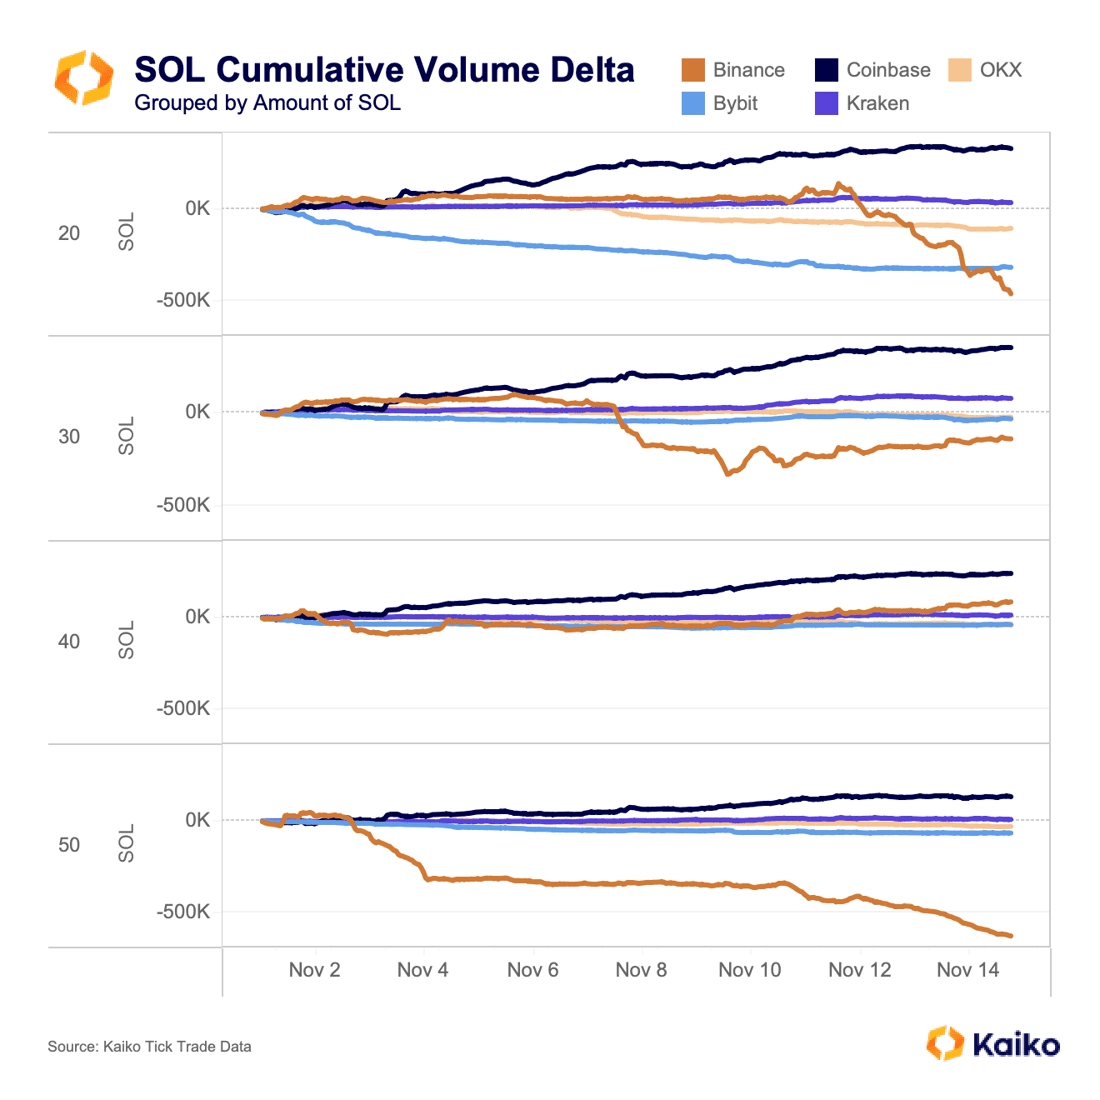
This question seems to be flummoxing the crypto community. While on-chain trackers have noticed that FTX has sent much of its crypto holdings to CEXes, many have assumed that this means these holdings have been sold. Not so. Crypto firm Galaxy is responsible for liquidating FTX’s assets, and it’s in everybody’s interest for them to do it carefully; when a court set weekly selling limits earlier this year, many rushed to judgment that the asset manager would be selling the max each week.
Instead of showing mass, rushed selling, Cumulative Volume Delta (CVD) data shows SOL has been sold methodically on Binance in orders of 50-60 SOL, totalling about 500k SOL in two weeks. Meanwhile, about 250k SOL has been sold on Bybit in order of 20-30, with another 100k sold on OKX. It’s impossible to say whether this is FTX/Galaxy, but the consistency and size does indicate that a large holder has been carefully selling their SOL.
Bitcoin-Argentian Peso prices hit ATH.
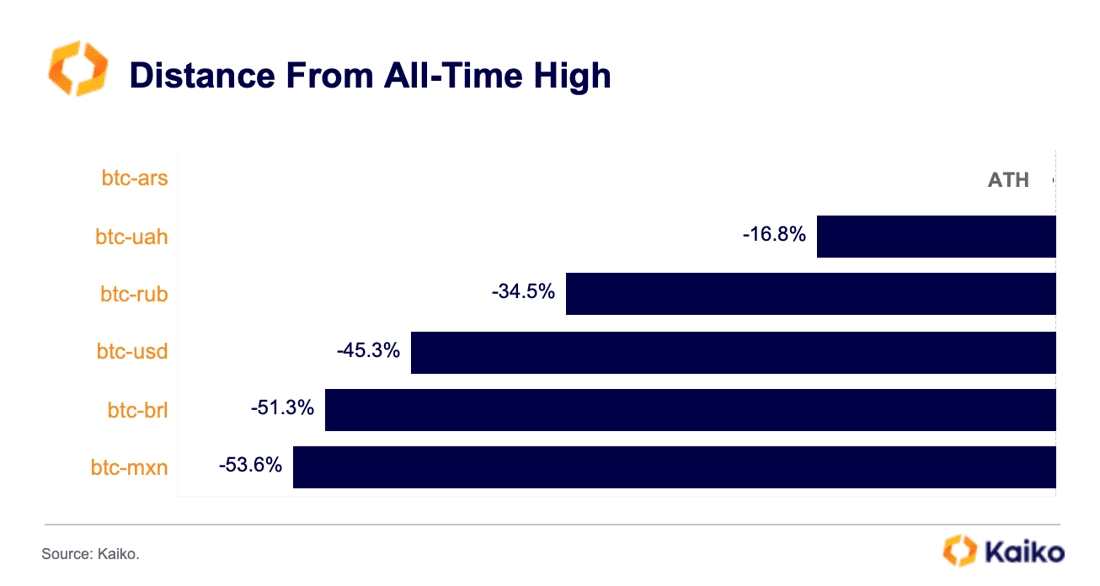
The cost of buying Bitcoin when using the Argentinian Peso (ARS) — one of the world’s worst performing fiat currencies — rose to an all-time high on Nov 19th just as the country was undergoing a highly contentious presidential election. The increase comes despite Bitcoin still being down 45% relative to its peak of $67K against the US dollar. The surprise victory of the far-right libertarian Javier Milei which has vowed to dollarize the economy, is expected to cause a new wave of currency volatility for the ARS.
Markets in Argentina are closed on Monday for a holiday. However, the ARS-USDT price on Binance which is seen as a proxy for the black market price of the dollar has declined sharply in the late hours on Sunday, before stabilising on Monday.
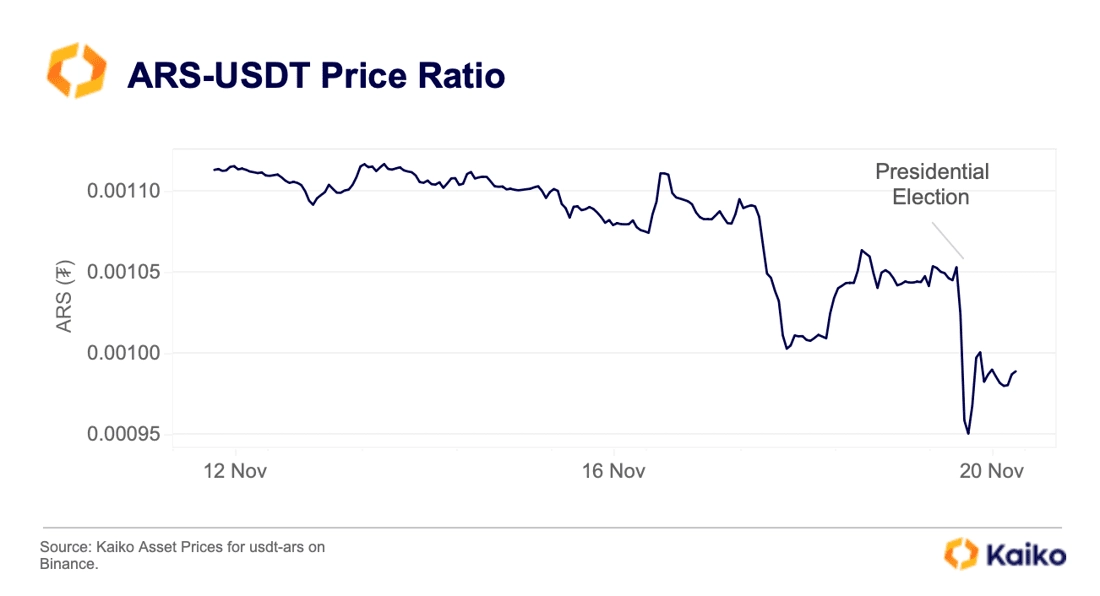
This could suggest that the peso is losing ground against the dollar and will be volatile once markets open. The data also shows how crypto markets, which are open 24/7, can price in big market events even when traditional markets are closed.
Worldcoin price exhibits volatility after CEO dismissal.
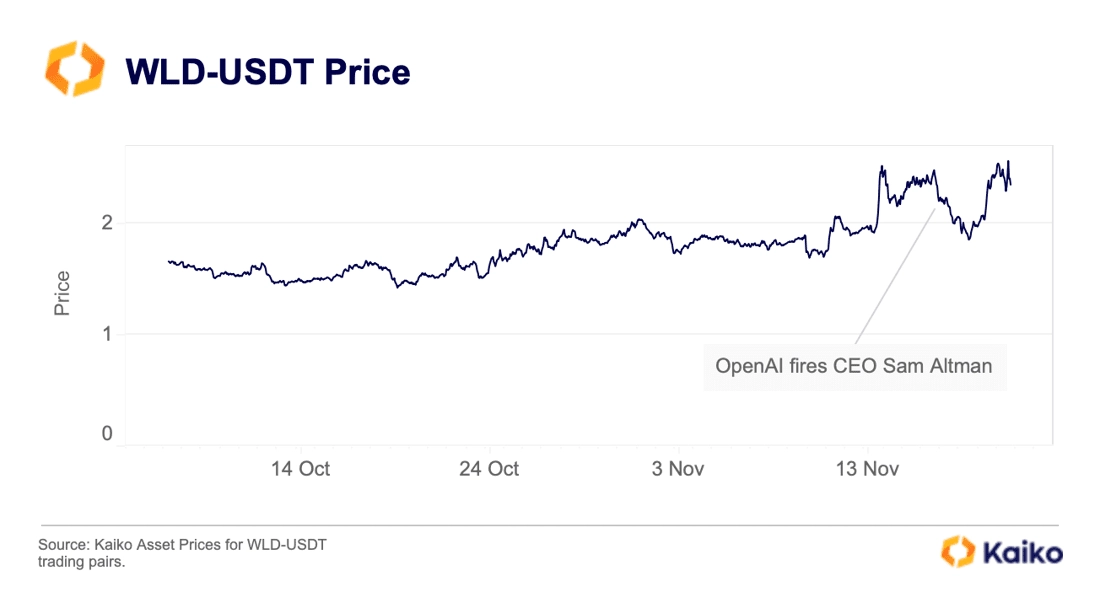
WorldCoin (WLD) price exhibited strong volatility after OpenAI announced on Friday the dismissal of its CEO Sam Altman, following an internal review. WLD prices initially fell by 15% to $1.85 before recovering in the early hours of Monday. The ousting of Altman has reportedly led to dozens of staff quitting the company after it became clear that he is not going to return.
WLD weekly trade volumes also increased hitting their highest level since the coin was launched at the end of July. However, its market depth (in native units) has been on a steady decline since mid- September which could also contribute to the token volatility.
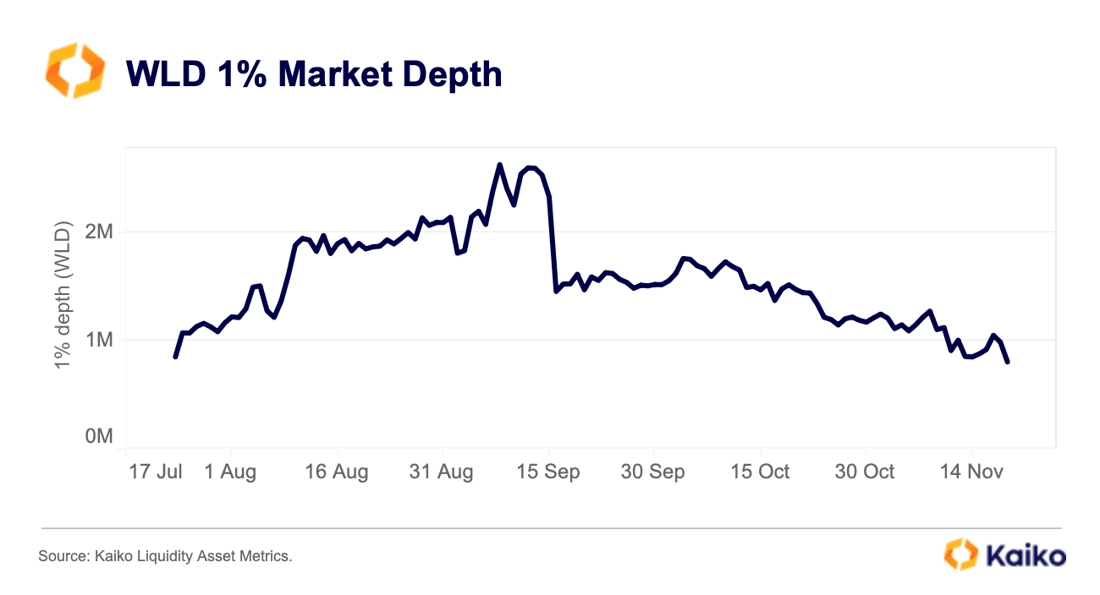
In July OpenAI awarded a combined 100mn of WLD to five market makers in a controversial deal to enhance the token’s liquidity. The deal expired at the end of October, a deadline which forced market makers to either buy or return the tokens. The strong decline in depth suggests that some market makers have been reducing their exposure to the token ahead of the Oct 22nd deadline.
Korean exchange trade volume hits 15-month high.
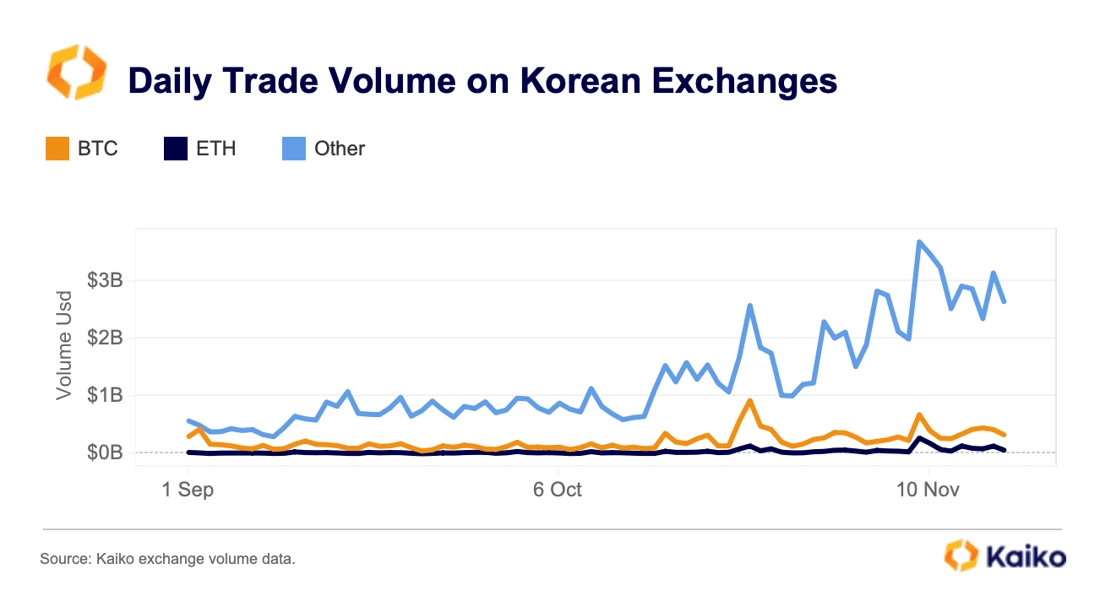
Daily trading volume on Korea’s 4 major exchanges rose to $4.6 billion in early November, the highest level since July 2022, driven by rising altcoin trading. Although the volume declined slightly last week, it remains well above the annual average.
Korean markets are dominated by altcoins, which account for 85% of total volume and typically see a greater increase in trading activity in risk-on markets. However, the recent increase in trading volume is also boosted by zero fees. Over the last two months, both Bithumb and Korbit have launched zero-fee promotions to challenge Upbit’s dominance.
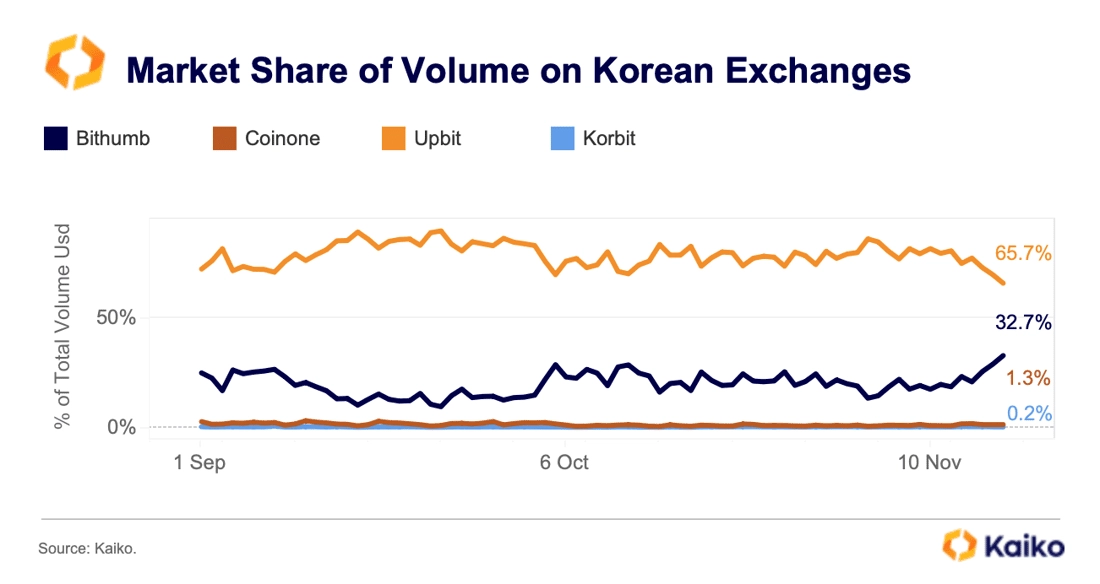
Bithumb, which reportedly plans to go public in 2025, increased its market share from 10% in September to 33% last week. However the impact on Korbit has been more mixed with its market share stagnating at 0.2%-0.3%. One of the reasons for this is that Korbit is very illiquid and offers significantly higher slippage. Its daily 1% market depth was just $500k compared to $4mn for Bithumb and $15mn for Upbit.
Upbit has dominated the Korean crypto landscape since 2021 with an average market share of 80% over the past two years. Although its market share has fallen below 70% for the first time since January, it is still too early to predict whether the decline will last. Zero-fee promotions represent a significant loss of revenue for exchanges and the positive impact on trading volumes usually disappears as soon as the promotion ends.
BTC correlation with Nasdaq approaches multi-year low.
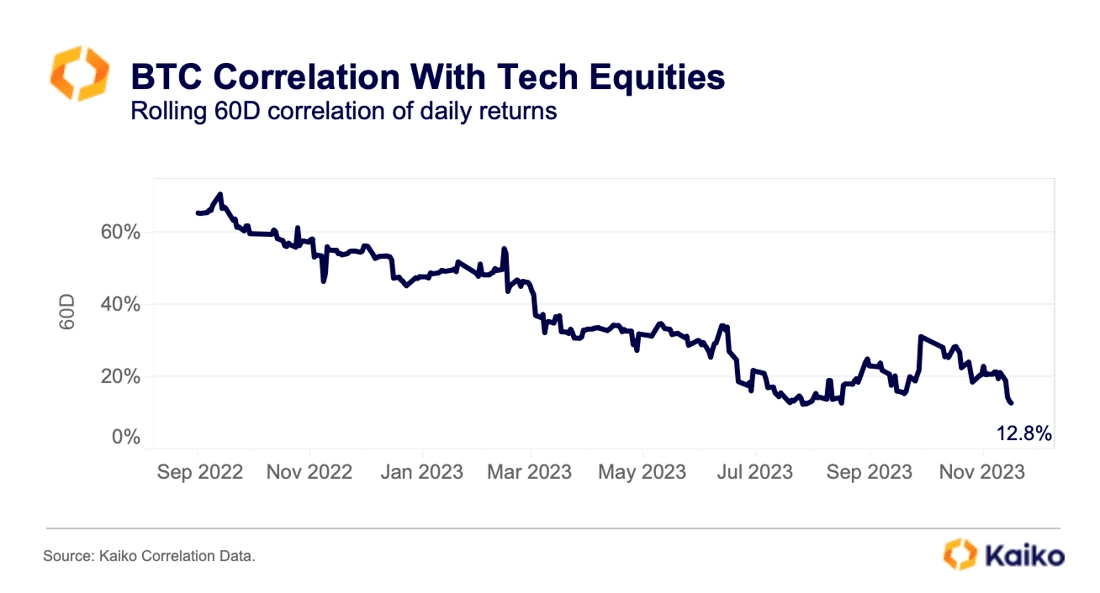
Bitcoin’s 60-day correlation with the Nasdaq 100 declined to 12.8% last week, its lowest level in months. US equities rallied following weaker than expected inflation data which reinforced the soft-landing scenario and the view that the Fed is done hiking. Markets are now expecting that the Fed will start cutting rates as soon as May 2024.
However, BTC’s reaction was muted as the market remains dominated by crypto specific narratives. Last week saw the delay of three spot ETF applications which likely boosted some profit-taking. Overall, however, BTC prices found a floor around $36k, suggesting there are dip buyers.
Grayscale alt coin-linked products trade at a premium.
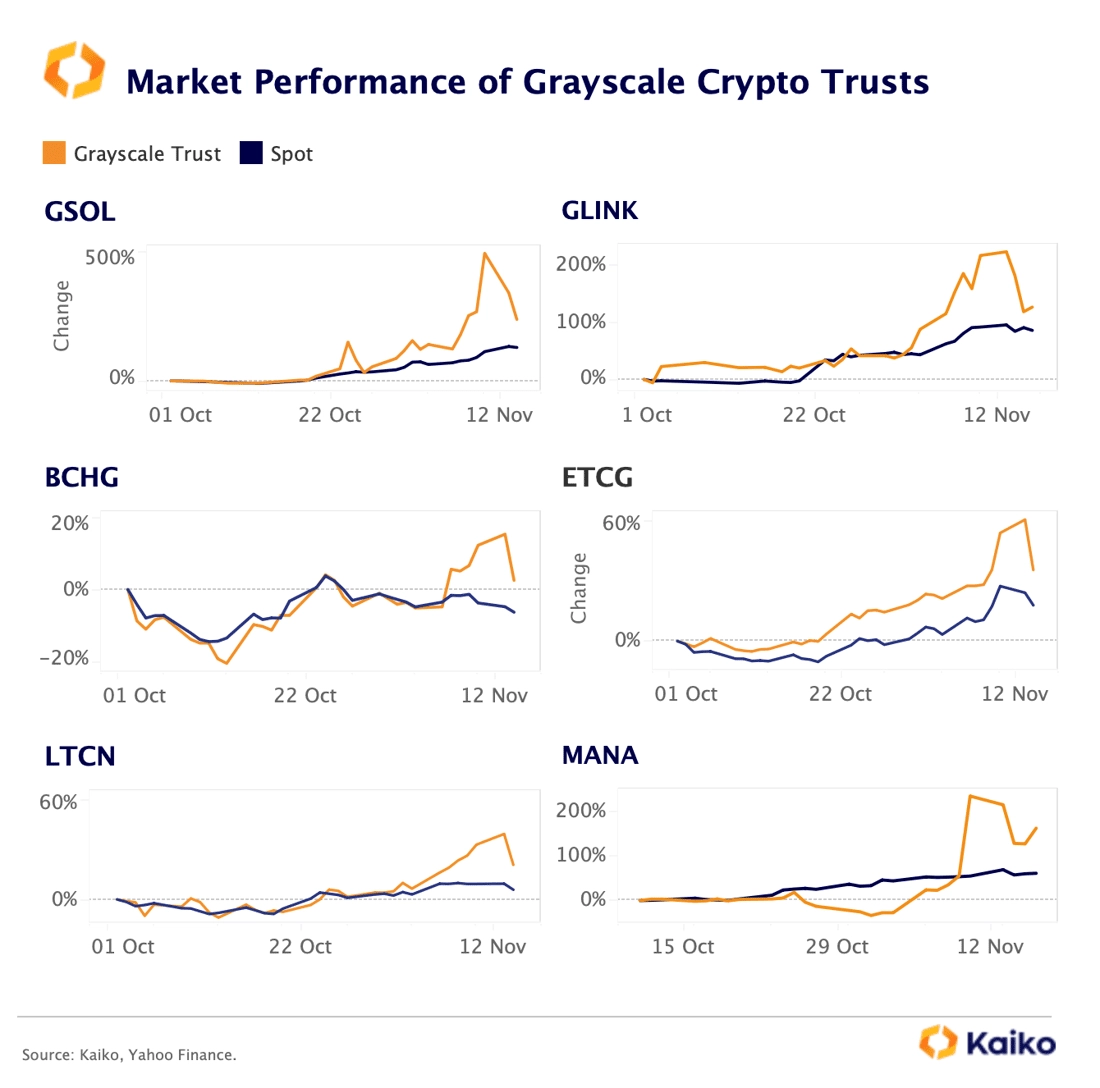
Since the beginning of October, Grayscale’s altcoin-linked investment products have been trading at an increasing premium to spot. However, the premiums have varied significantly from product to product.
Grayscale Solana Trust (GSOL) has been the best performer by a wide margin. GSOL shares are up 240% since October 1st, and hit an all-time high of $202 last week, eclipsing SOL’s 120% gains. Shares of Grayscale Chainlink Trust (GLINK) and Grayscale Decentraland Trust (MANA) increased between 130% and 160% while the spot prices of these assets are up between 60% and 90%.
By contrast, other product saw more modest gains. Grayscale ETC and BCH linked trusts, ETCG and BCHG – were up 21% and 3% respectively. Although all of Grayscale products outperformed the spot market, part of these premiums are due to structural reasons such as lock-up periods and limited availability of tradable shares, rather than increased institutional demand.