Data Points
Outflows weigh on ETH ETFs
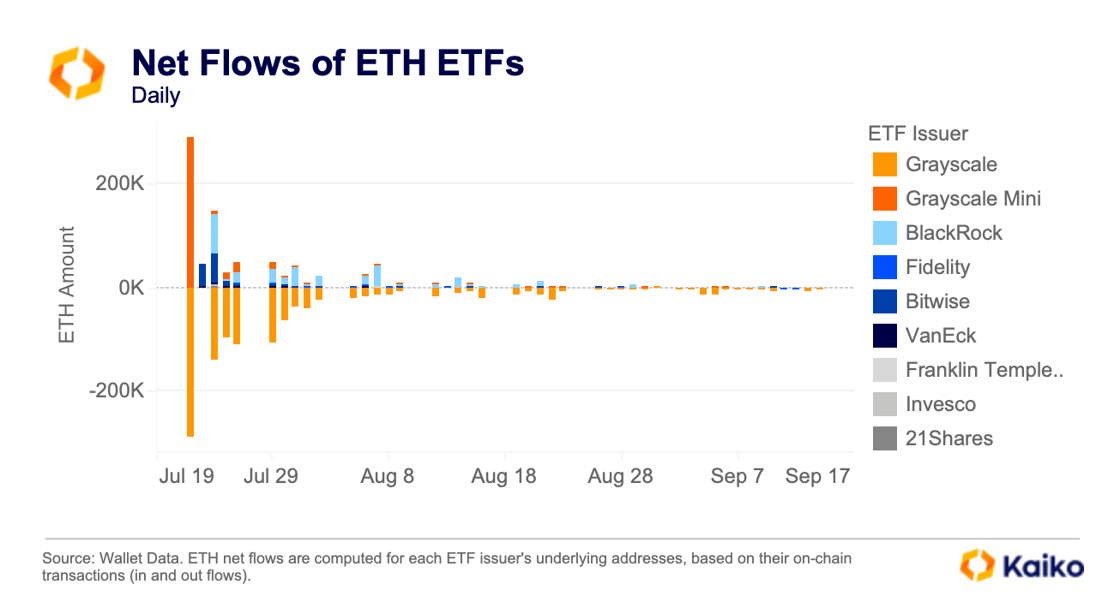
BTC’s growing dominance is also present in the traditional finance space. Decreasing demand for ETH ETFs tells a similar story, with ETH failing to attract institutional demand since its launch in late July. Overall, when looking at on-chain flows registered by ETH ETF wallets, most funds have failed to attract net-positive demand from investors.
Similar to BTC ETFs, the exodus has largely been linked to Grayscale’s ETHE, which converted from a closed-end trust to a spot ETF. One thing was different this time, though: Grayscale launched a mini trust concurrently, with the lowest fee on the market. The mini trust was aimed at long-term investors and charges just 0.15%, while the ETHE was left elevated at 1.5% — in the hope that traders would use the highly liquid fund as a trading vehicle.
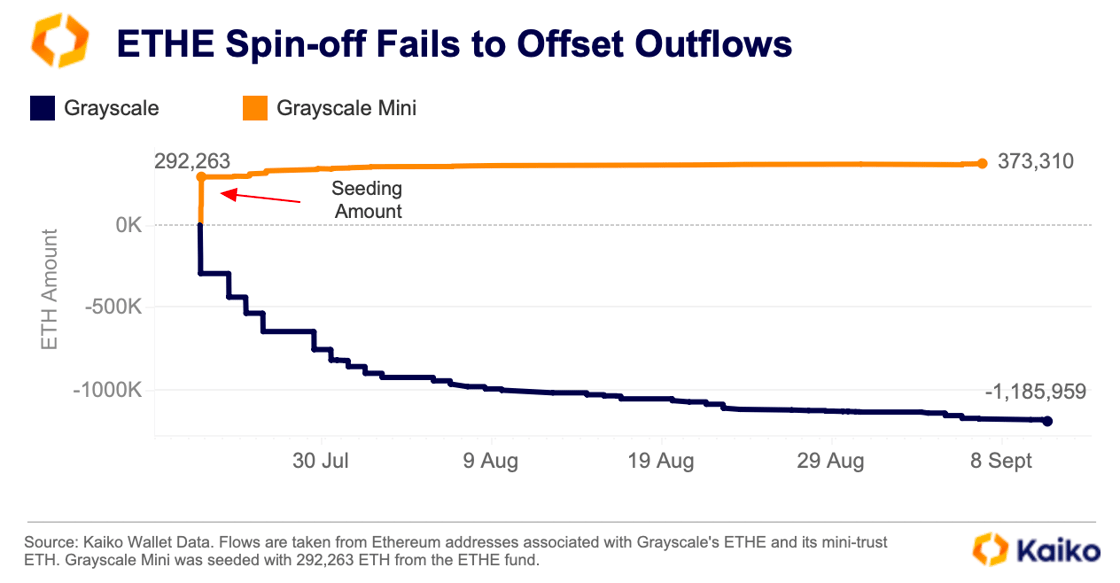
The Grayscale mini trust was seeded with 10% of the assets from its ETHE fund. This amounted to 292,262.99 ETH, which can be seen in the chart below. While the mini trust did attract inflows following its launch, it failed to offset the massive exodus from the ETHE fund.
Since July, there have been organic outflows of 893,696 ETH from Grayscale’s ETHE, as well as the 292,263 ETH sent to the firm’s new mini trust. That means a combined 1.18 million Ether has left Grayscale’s ETHE in just under two months. Meanwhile, the mini trust has only managed to attract organic inflows of 81k ETH.
BTC ETFs haven’t had a smooth ride either; however, the funds tend to show more durability as flows often bounce back after periods of outflows. For example, BTC ETFs saw $1.2 billion in outflows between August 27 and September 6, the longest streak of successive outflows since their inception in January. The BTC funds quickly bucked the trend, though, seeing net inflows of just over $400 million.
Altcoins and retail investors are driving BitGet’s growth.
Crypto market participation has declined during the summer, further intensifying competition between exchanges. This week, we examine Bitget, a fast-growing platform whose market share relative to Binance grew from 7% to 9% in August. The exchange currently facilitates $2.5 billion in daily trade volume, comparable to Bullish and Bithumb. What has been driving its growth?
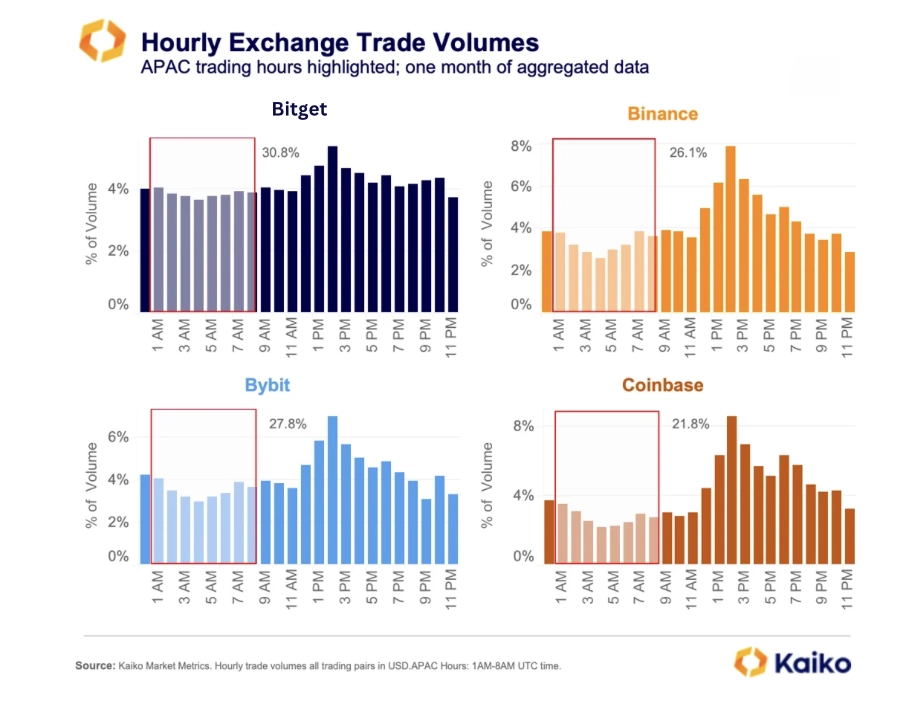
While trade data is anonymous, analyzing trading hours and weekend activity can offer insights into user preferences and geographic distribution. Bitget sees the most activity during APAC trading hours (1 AM to 8 AM UTC), with 31% of volume, compared to 28% for Bybit and 26% for Binance.
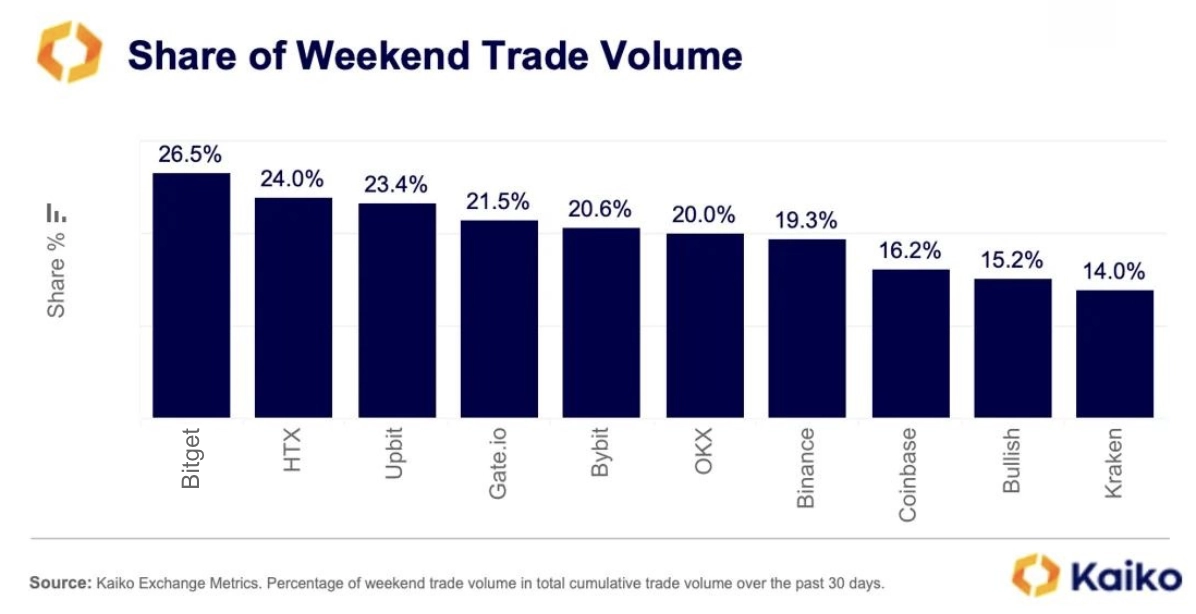
Bitget also leads in weekend trading, with over 26% of its volume occurring during weekends, outpacing other offshore platforms like OKX and HTX. Moreover, nearly half of Bitget’s volume comes from altcoins, while Bitcoin and Ethereum contribute 25% and 26%, respectively. For comparison, Binance’s altcoin trade volume averaged 30% last month. Such high altcoin volumes suggest a higher degree of retail participation, which we can also verify by looking at relative trading activity on weekends compared to weekdays.
Retail traders are a key revenue source for exchanges, as they pay higher trading fees. For example, despite contributing a small share of overall volume, retail traders account for over 80% of Coinbase’s transaction revenue. Offshore exchanges have been fiercely competing for market share by offering incentives such as fee discounts, reward programs, and rapid asset listings.
Stablecoins adoption is growing.
In 2024, the turnover ratio of stablecoins has risen, adding to evidence of growing adoption. The turnover ratio, calculated by dividing annual trade volume by the end-of-year market capitalization, measures how frequently an asset is traded. An increase in this ratio suggests that trading volume is growing faster than market capitalization, reflecting greater use of stablecoins as a medium of exchange.
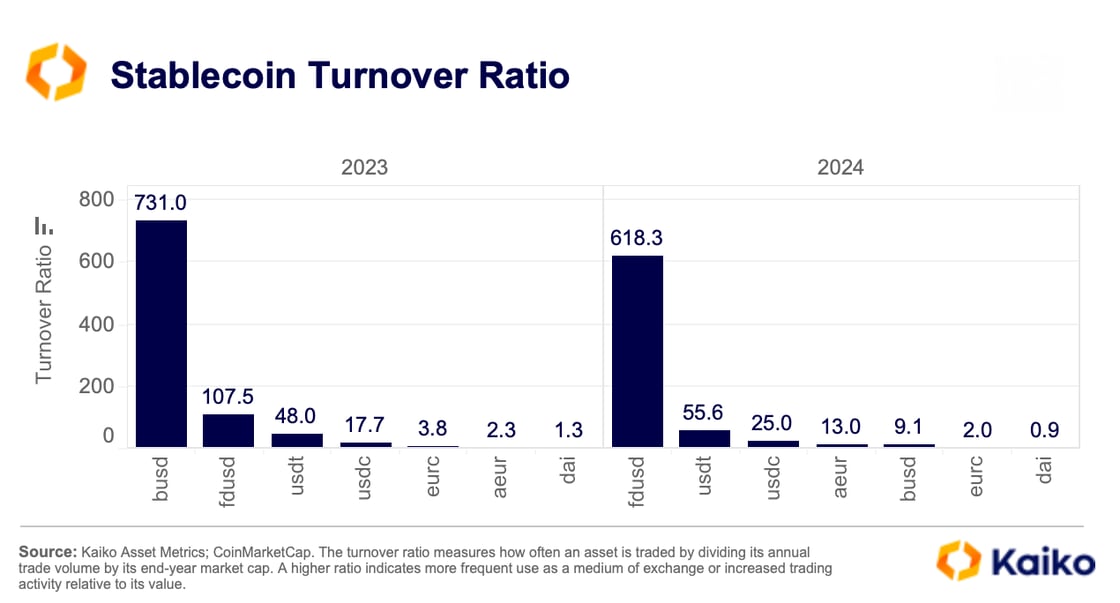
Tether’s USDT, the largest stablecoin by market capitalization, saw its turnover ratio climb from 48 to 56. Similarly, Circle’s USDC saw a rise from 18 to 25. While stablecoins generally have much higher turnover ratios compared to other crypto assets, these ratios have moderated significantly compared to the early years of 2018 and 2019.
Extremely high turnover ratios can also indicate market stress or de-risking. In 2023, BUSD’s turnover ratio surged dramatically from less than 100 in 2022 to over 730 in 2023. This increase followed a significant drop in BUSD’s market capitalization, which plummeted from over $20 billion to just $70 million by September 2024, due to regulatory actions by the New York Department of Financial Services (NYDFS).
Similarly, FDUSD from First Digital Labs has shown a comparable trend this year. FDUSD’s turnover ratio jumped from 108 in 2023 to over 618, driven by high trading volumes relative to its market capitalization. Most FDUSD trading pairs saw increased buying activity during recent market sell-offs.
Friend.tech: the one where the protocol closes.
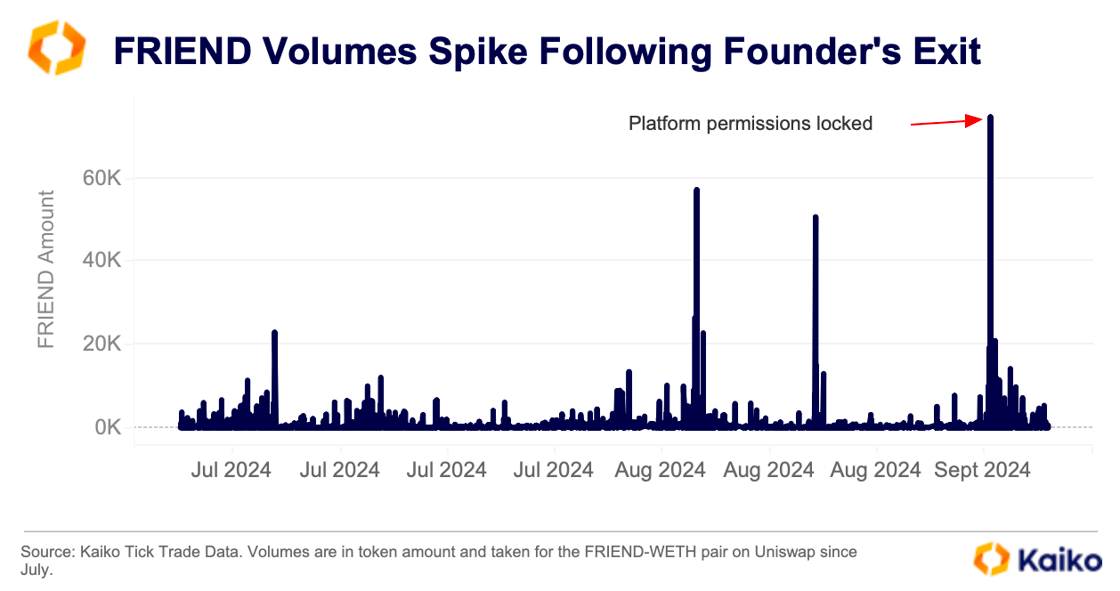
One-time sensation Friend.tech is no more. Last week, the protocol’s founders revoked their ability to make changes to the platform’s fees and functionality in the future, effectively shutting down the protocol. The decentralized social network took off after launching on Base in August 2023. However, interest dwindled towards the end of 2023, and by the time its airdrop occurred in May 2024 user numbers had fallen off significantly.
The Friend.tech team launched the FRIEND token in May, around nine months after the platform’s initial launch and as the platform stagnated. The token launch failed to reignite interest in the platform. The token price has plunged 96% since May and is currently trading around $0.08. Trade volumes on Uniswap briefly spiked last week before falling again.
Friend.tech had been one of Base’s early success stories, as it attracted users to the platform and generated fee revenue. However, the layer-2 has since branched out beyond the social networking app, and its most lucrative period over the past year was actually tied to memecoin trading. As such, the fate of Friend.tech is unlikely to have an impact on its fortunes going forward.
How about the Friend.tech copycat? The fervor around the app in late 2023 inspired copycats like Stars Arena on Avalanche. It hasn’t been all plain sailing for this platform either, as it was hit with a $3 million exploit in October of last year.