Now Available: Q2 2024 Crypto Market Report


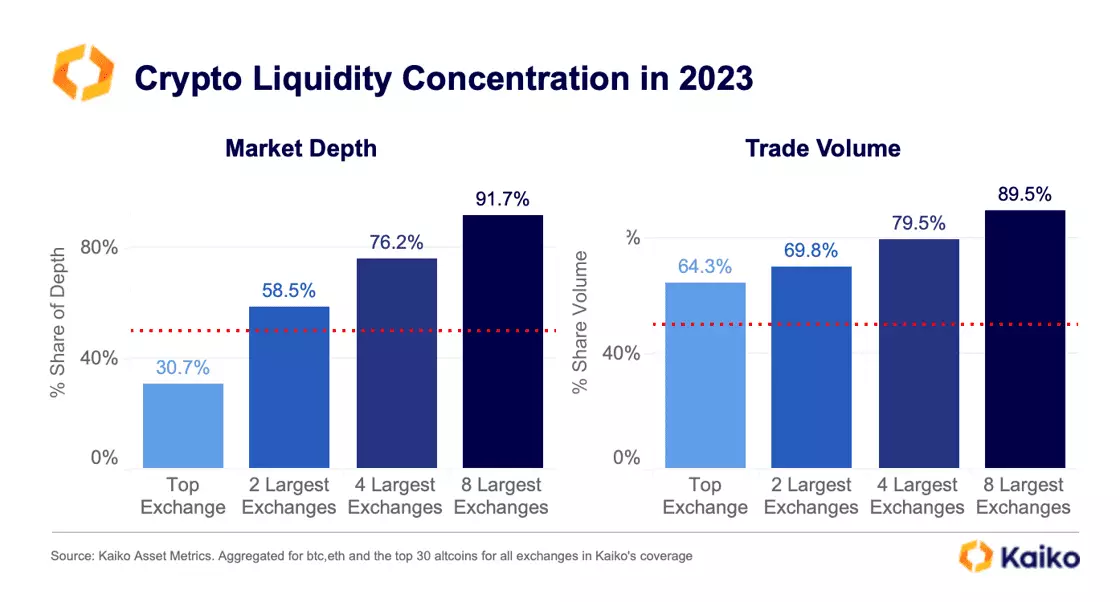
The Crypto Liquidity Concentration Report.
07/09/2023

Welcome to Deep Dive!
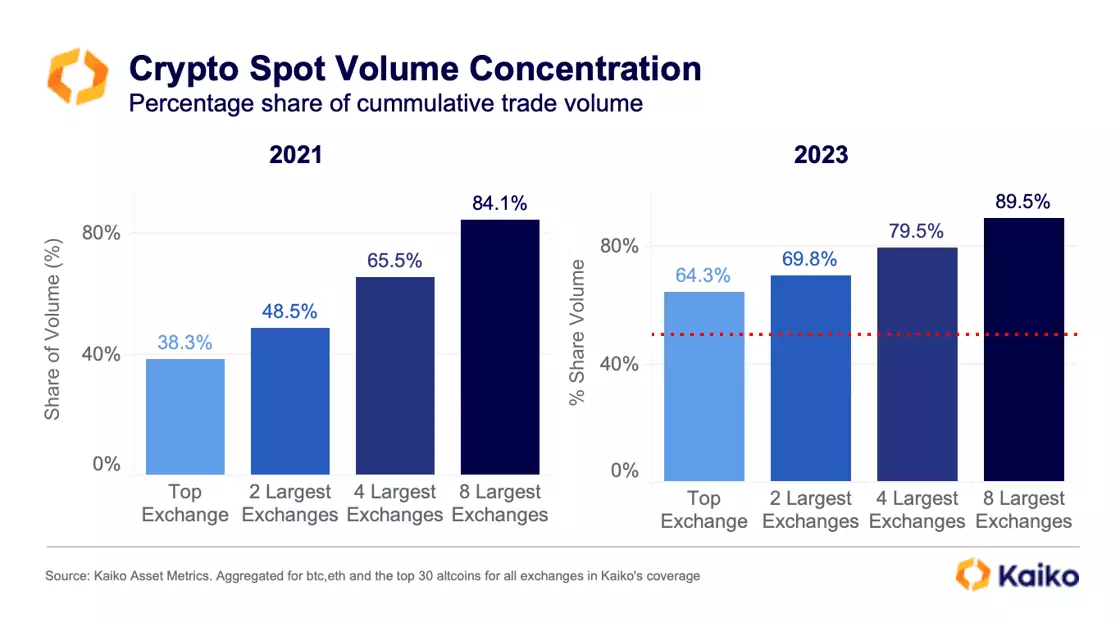
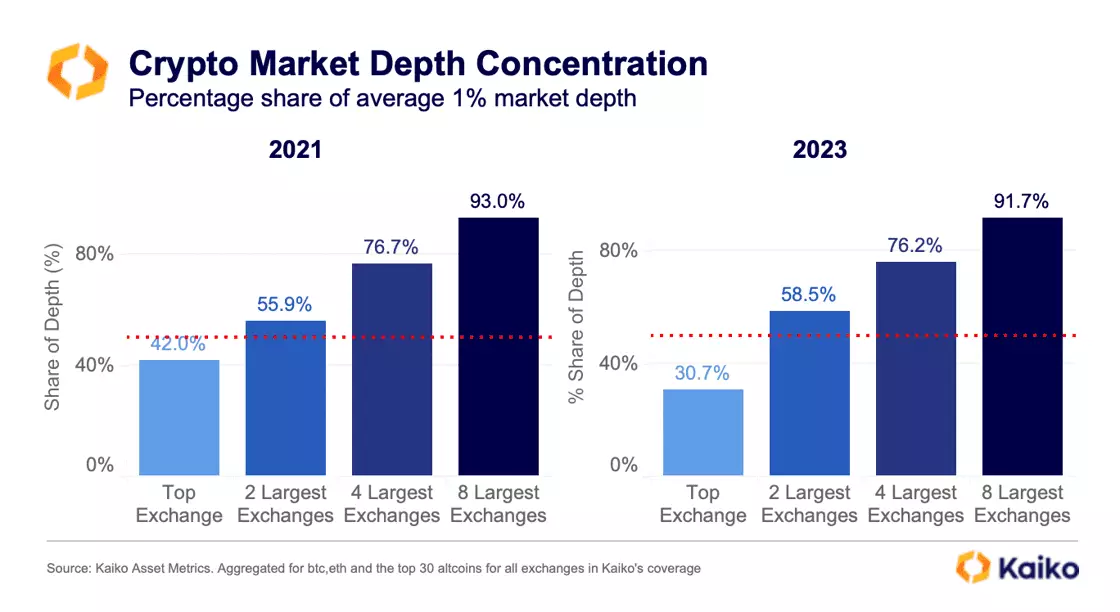
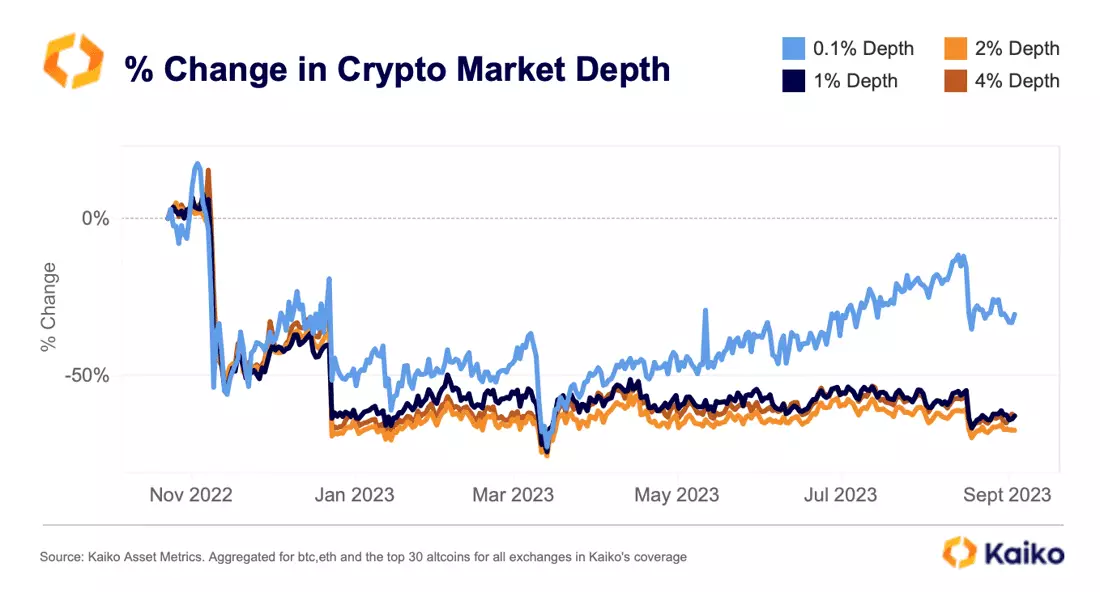
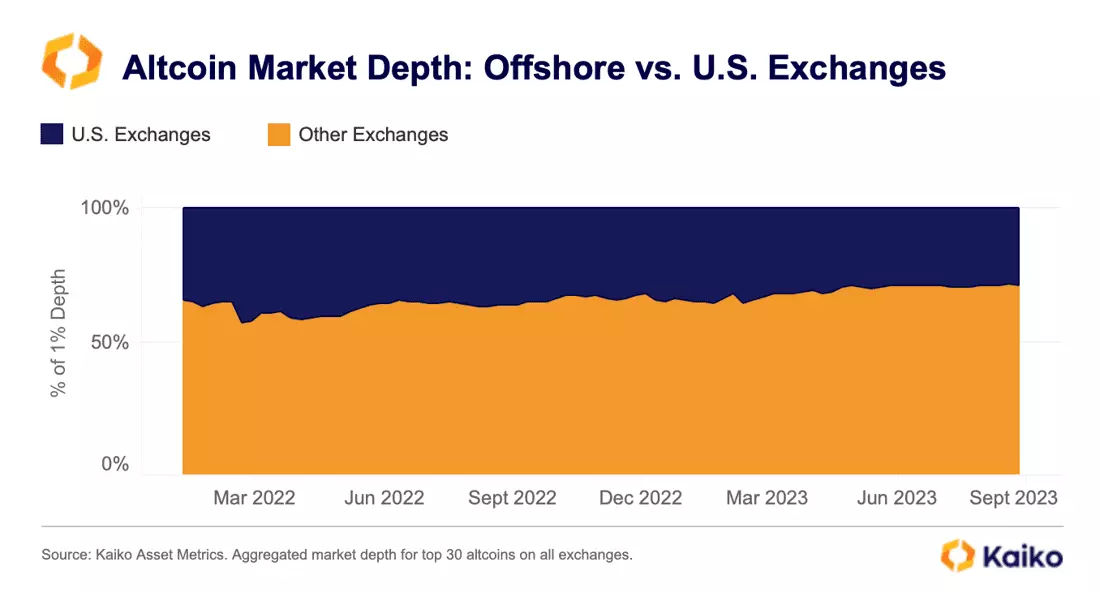
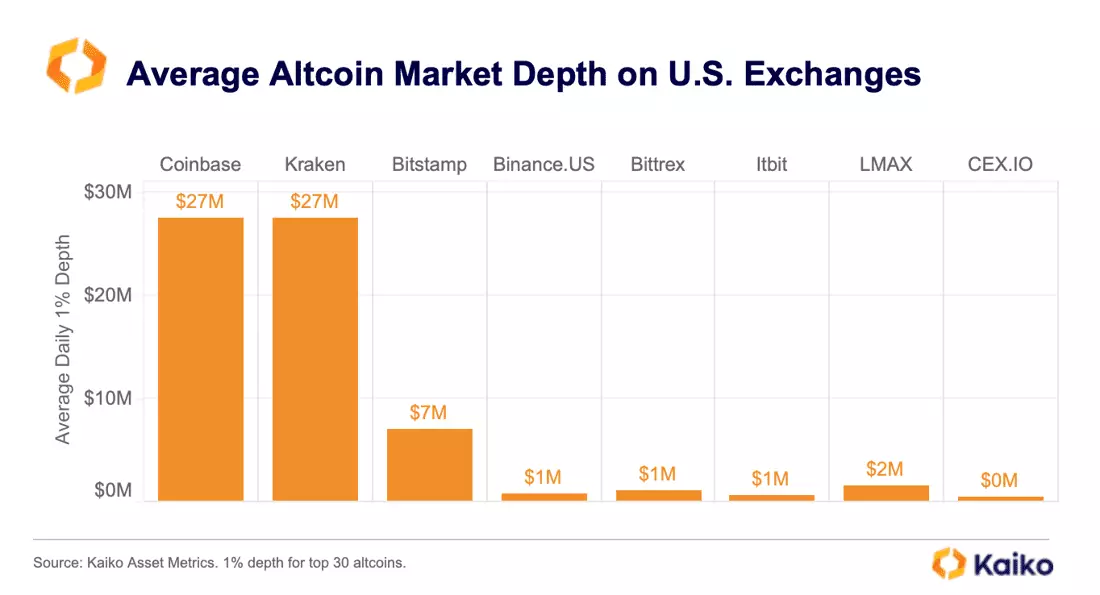
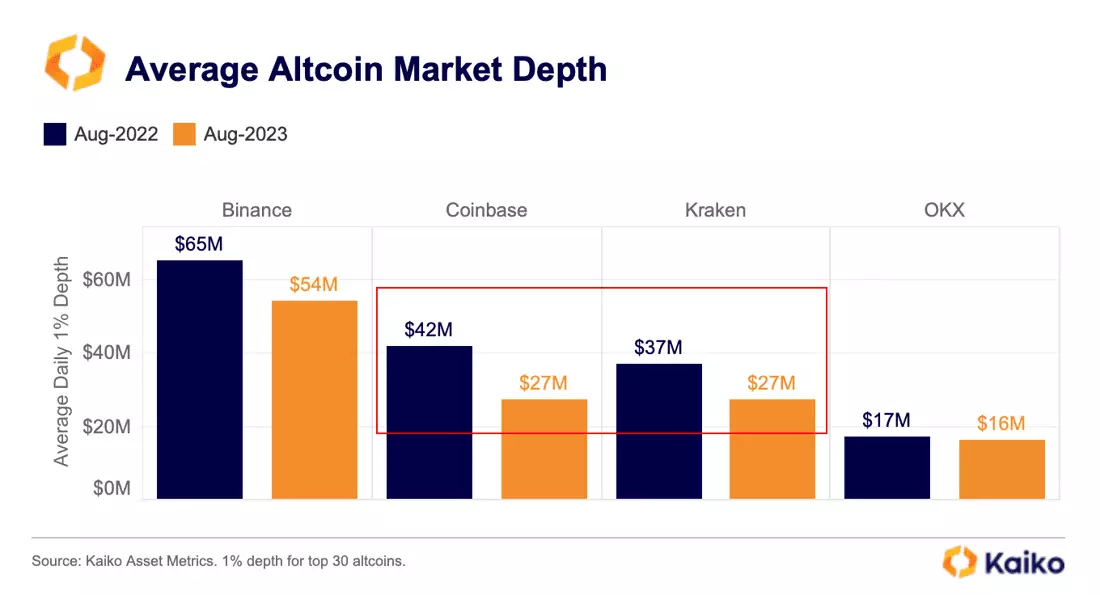
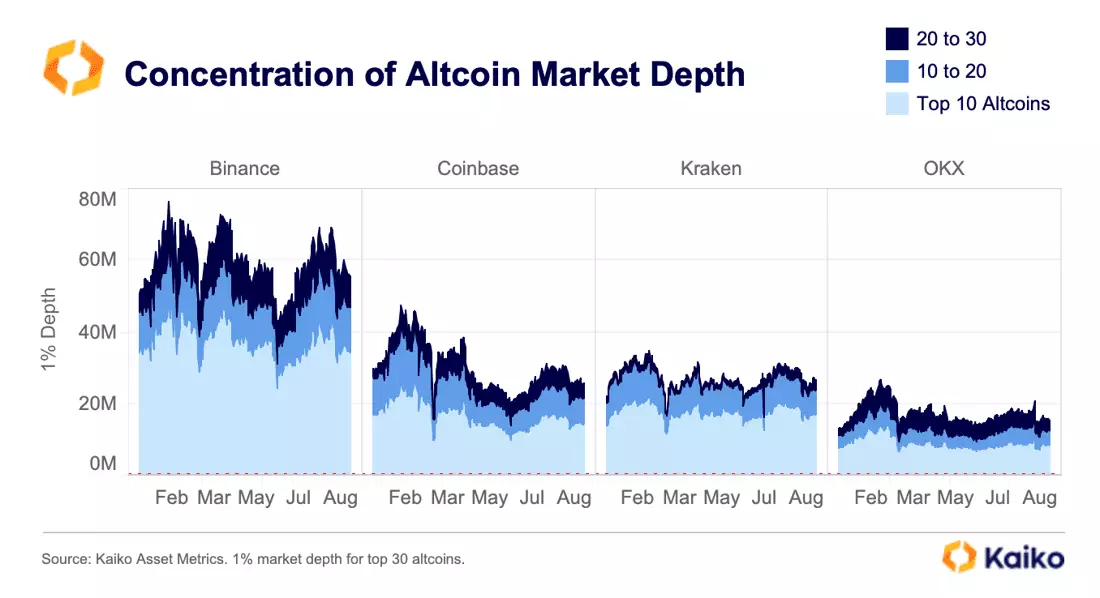
We are back this week with a brand new crypto liquidity analysis. Using trade volume and market depth, we find that the majority of liquidity is concentrated on just a handful of exchanges.


More From Kaiko Research
![]()
CEX
25/07/2024 Deep Dive
What's Behind Turkey's Booming Crypto Market?Welcome to the Deep Dive! This week, we take a closer look at the rapidly growing Turkish crypto market. We’ll focus on the exchange landscape and evolving crypto regulation in Turkey.
Written by Dessislava Aubert![]()
Ethereum
22/07/2024 Data Debrief
Will the launch of spot ETH ETF be sell the news event?BTC surged above $67K following a massive global IT outage, Joe Biden ended his reelection bid on Sunday night, Indian exchange WazirX halted trading at it experienced a $230 million hack.
Written by The Kaiko Research Team![]()
ETF
19/07/2024 Deep Dive
BTC ETF 의 현물 시장 영향이번 주 리포트에서는 비트코인(BTC) ETF가 현물 BTC 시장 구조에 미친 영향을 분석하겠습니다. 특히 거래 활동과 유동성 측면에서 BTC ETF가 어떤 변화를 야기했는지 확인해 보겠습니다.
Written by Adam Morgan McCarthy![]()
Ethereum
15/07/2024 Data Debrief
ETH Spot Market Cools as Wait for ETF Launch IntensifiesU.S. inflation cooled further in June, bolstering the case for a September rate cut. BTC traded above $62K in the early hours of Monday, up nearly 11% over the past seven days. The SEC dropped its investigation into Paxos and BUSD on Thursday, while a voteto overturn President Biden’s veto of the SEC’s SAB 121 failed to reach the required majority in the House.
Written by The Kaiko Research Team


