Data Points
Supply implications of plunging gas fees on Ethereum.
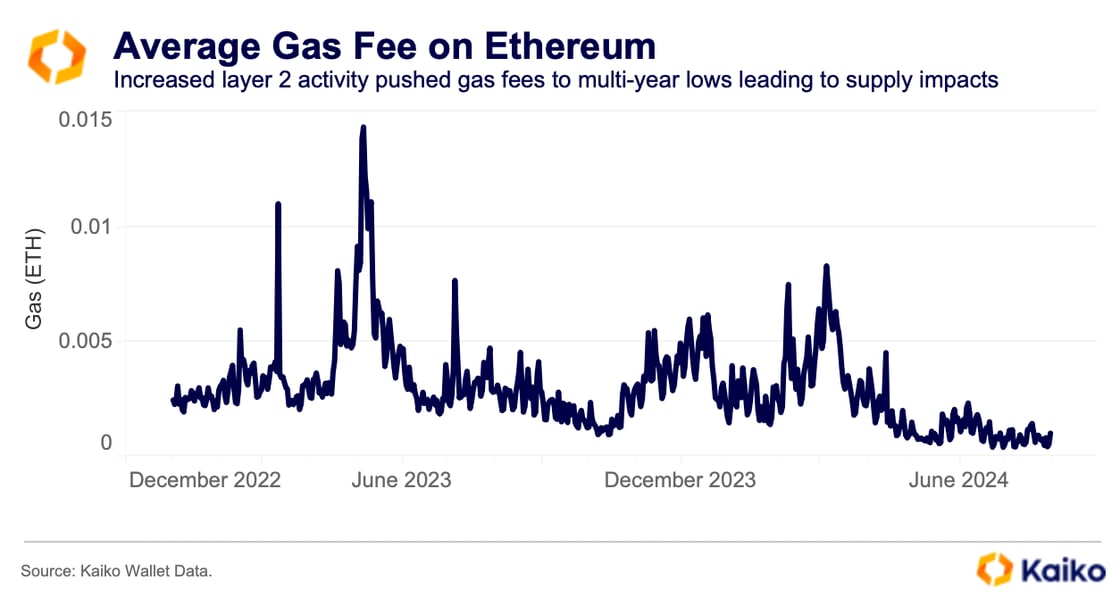
Ethereum’s gas fees have recently hit five-year lows, driven by increased layer 2 activity and the Dencun upgrade in March, which lowered layer 2 transaction fees. This fee reduction has implications for ETH, as lower fees mean less ETH is burned, increasing the token’s supply. Consequently, ETH’s total supply has risen consistently since April. Despite demand drivers like spot ETH ETFs, this growing supply could dampen potential price increases in the near term.
Demand for collateralized loans on Aave cools off.
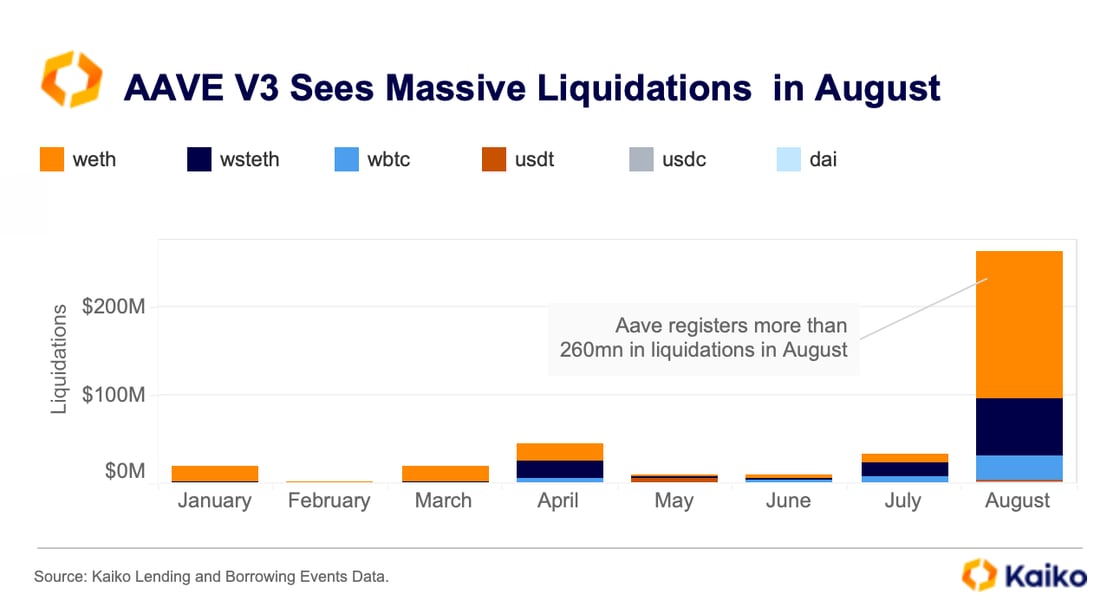
Demand for collateralized loans on Aave V3, the largest DeFi lending protocol by TVL, cooled off in August following over $260mn in liquidations amid plummeting crypto prices and a broad market sell-off beginning on August 5th.
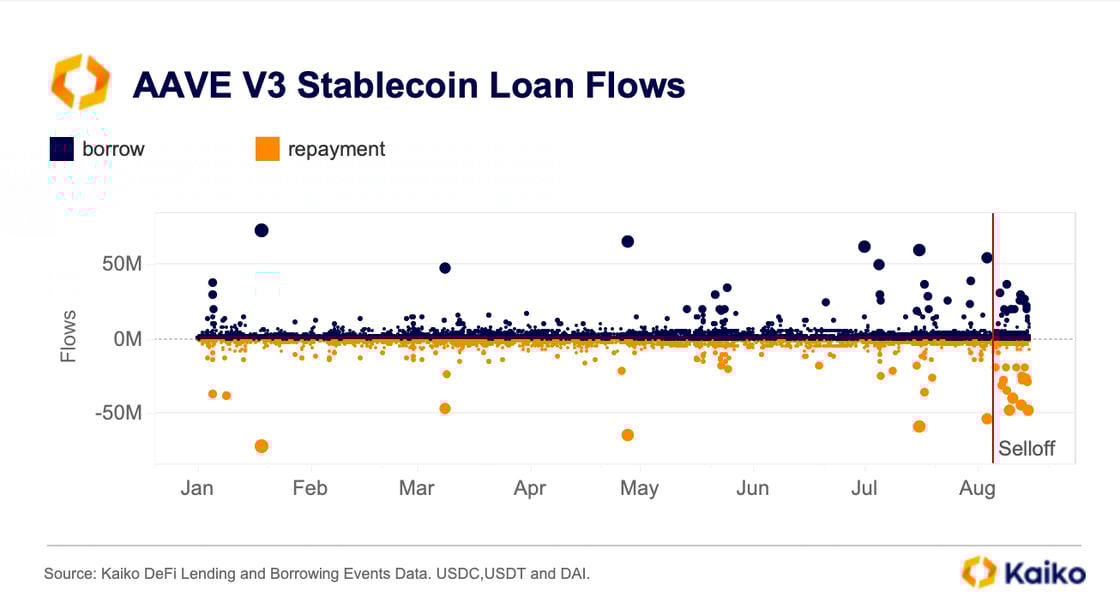
Aave V3 registered net inflows between May and July, with borrowings surpassing repayments. In July, stablecoin borrowing volumes hit a yearly high of $1.4bn, while repayments totaled $1.2bn, bringing net inflows to around $200mn. However, the trend has reversed after the recent selloff, with more than $200mn in net outflows since the start of the month.
AI crypto token merger struggles to reignite market interest.
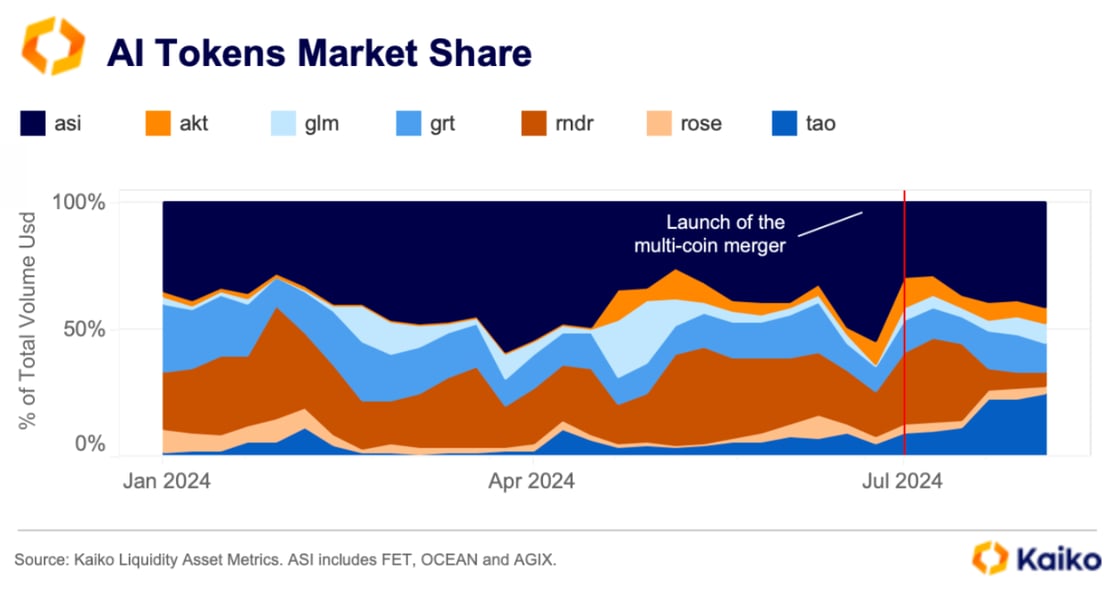
Last month, three of the top AI-focused crypto projects—Fetch.AI, SingularityNET, and Ocean Protocol—initiated the first phase of merging their native tokens into one, called the Artificial Super Intelligence (ASI) token. This merger, initially announced in March, is part of a broader initiative that aims to develop a new AI platform offering a “decentralized alternative to existing AI projects controlled by big tech.”
Since July, the combined market share of SingularityNET’s AGIX, Ocean Protocol’s OCEAN, and Fetch.AI’s FET tokens has risen from 30% to 40%. However, our tick trades data shows that this growth has been primarily driven by increased selling, indicating that traders view the merger as a risky event.
Overall demand for AI tokens has sharply declined since the start of Q2. Weekly trading volumes plummeted to $2 billion in early August, marking a six-fold drop from a multi-year high of over $13 billion in Q1.
AI-related crypto tokens are linked to projects that use artificial intelligence to improve security, user experience, power decentralized exchanges, or provide image and text generation services. However, their 60-day correlation with chip maker Nvidia (NVDA), which is widely perceived as a bet on a potential AI-related boom, has been weak. It currently hovers around 0.1-0.2, down from a peak of 0.3-0.4 in March. In contrast, they remain strongly correlated with Bitcoin, with correlations between 0.5 and 0.7 as of early August, suggesting traders see these projects as high-beta crypto bets.
FDUSD’s market share on Binance hits an record high.
The stablecoin FDUSD’s market share on Binance hit an all-time high of 39% at the end of July, reversing a downward trend that had persisted for the past three months. The increase is notable as the exchange had reintroduced zero taker fees for FDUSD trading pairs for its regular and VIP-1 users back in April.
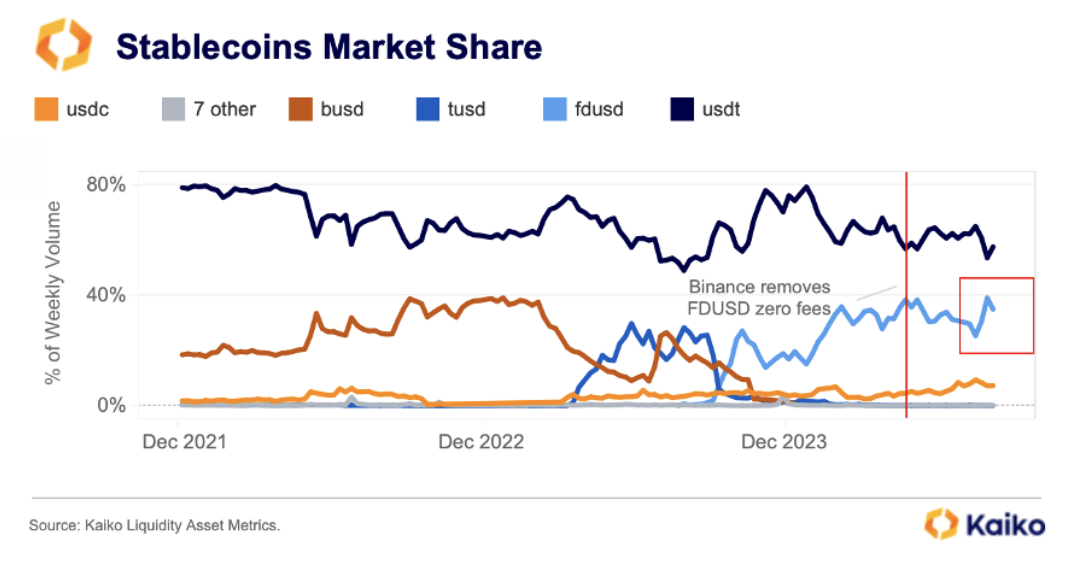
A closer examination of tick-trade data suggests that this surge in FDUSD volume was primarily driven by increased buying in Binance’s four main FDUSD-denominated pairs, as well as a rotation into other stablecoins, particularly Tether’s USDT.
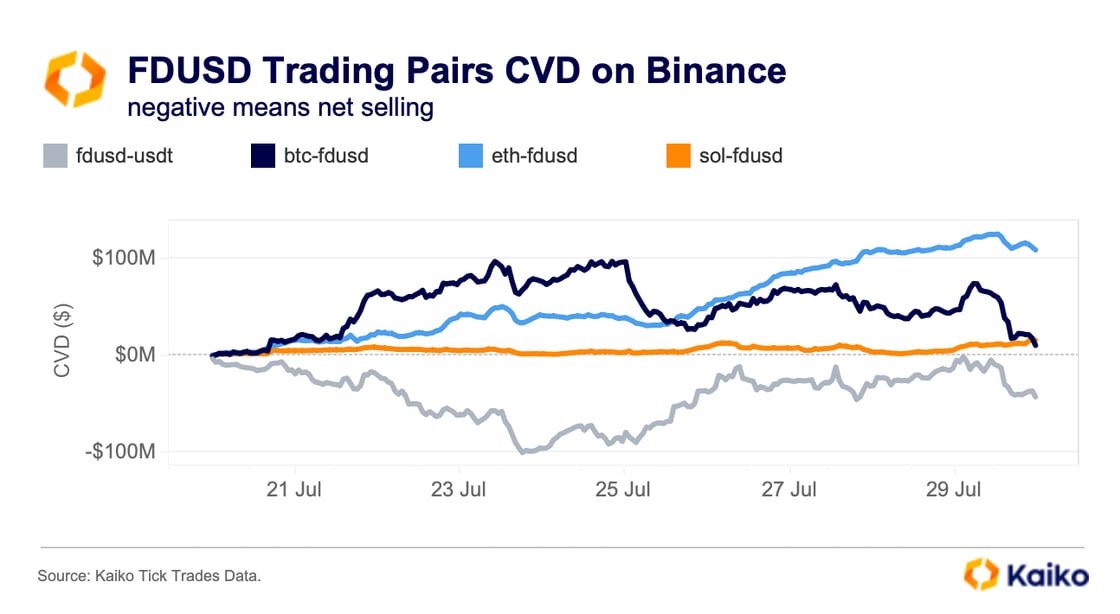
This is particularly interesting as Bitcoin saw strong selling on Binance’s USDT markets during the same period (not charted).
Hong Kong-regulated First Digital USD (FDUSD) was launched in June 2023 and started trading on Binance shortly afterward with zero maker and taker fees. By 2024, its daily trade volume had skyrocketed, averaging $6.5 billion, which is more than six times the volume of the next largest stablecoin, USDC, at $1 billion. However, FDUSD’s success is heavily reliant on Binance, as it is solely traded on the platform and closely tied to its fee policies.
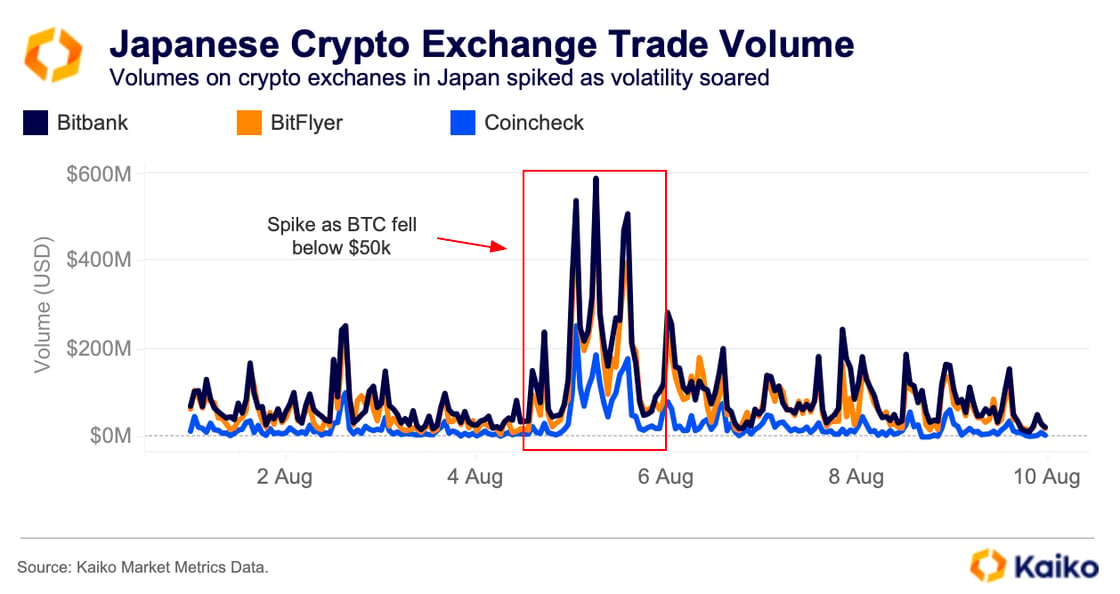
Japanese markets led crypto sell-off.
The Bank of Japan’s rate hike at the end of July was a precursor to a spike in volatility across financial markets in August. Crypto markets plunged alongside equities as the changing rate environment in Japan and poor economic data in the US spooked investors.
The fallout over the first weekend of August hit crypto markets immediately. BTC fell by over 12% throughout the weekend, crashing below $50k by Monday morning in Europe. During the sell-off, trade volumes spiked on Japanese crypto exchanges, particularly on Bitbank and Bitflyer, reaching their highest point since early March, when Bitcoin hit new record highs.
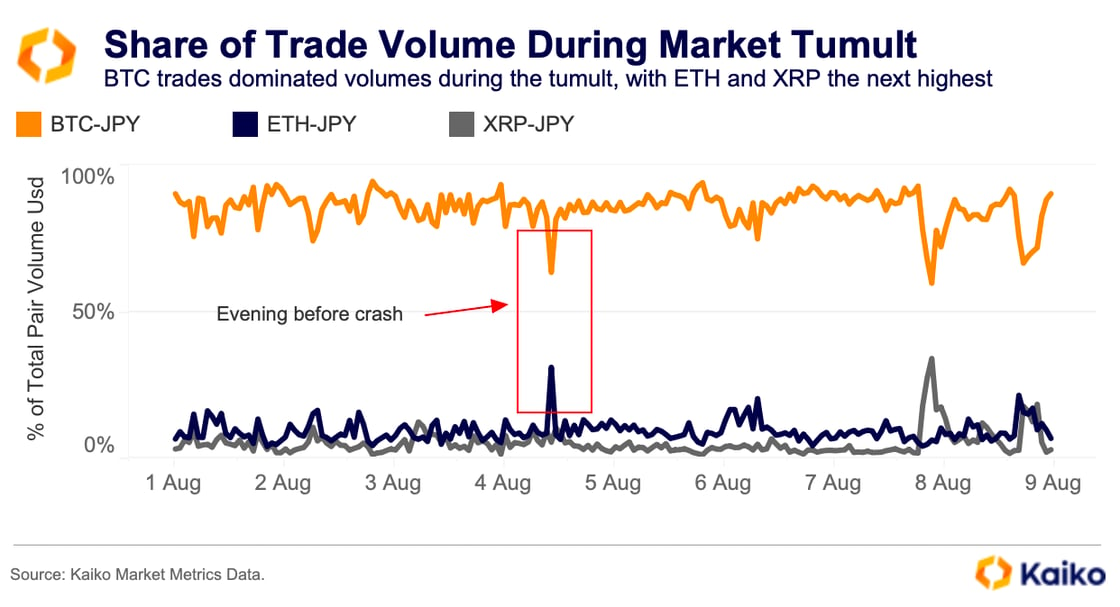
Most of this volume surge was primarily due to the trading activity on BTC-JPY markets, followed distantly by ETH-JPY and XRP-JPY markets. However, the Japanese crypto markets registered an interesting spike in ETH’s share of trade volume on Saturday evening Japan time, briefly commanding over 30% of activity. The spike in trading volume came the day before much of the volatility and coincided with panic tied to reports that Jump Trading had begun liquidating its ETH positions.
What was behind the pre-emptive moves in Japanese markets versus the US and other major regions? A significant portion of the volatility at the beginning of August was linked to the Japanese Yen carry trade.
A carry trade involves traders borrowing one asset at a low rate, the Yen in this example, and reinvesting it in a higher-yielding asset like US Treasuries. Considering that Japanese investors are the largest group of non-US investors in US Treasuries, it’s likely most were exposed to both assets. This exposure came right as the BoJ increased rates and chances of a Fed rate cut soared.
The carry trade works best when markets are stable. So, when the BoJ hiked interest rates for the second time since 2007, this trade suddenly lost its appeal.