Around the world in crypto trends

The State of Crypto Derivatives

Derivatives

Bitcoin

Ethereum

04/05/2023

Welcome to Deep Dive!

This week we’ll provide an update on all things crypto derivatives and look at how perpetual futures are increasingly driving price action in markets.

  • Perpetual futures commanding higher share of volumes, leading to more price discovery.

  • BTC and ETH perpetual futures saw huge buildup of speculative long positions in mid-April.

  • Altcoin to Market Cap ratio shows which perpetual futures have outsized influence on price action. BLUR, OP and ARB have highest ratios.

  • Coinbase and Gemini entering offshore derivatives market amid falling spot volumes.

Derivatives markets in crypto are not only where the most speculation occurs, but also where many sophisticated investors place their bets, hedged or conviction-based. The directionality of these bets: long/shorts or puts/calls can give us great insight into investor sentiment in crypto markets particularly before and after big market events, such as a Fed meeting or the Merge. In this article, I’ll walk through the state of derivative markets in crypto right now, looking closely at Bitcoin and Ethereum first, before exploring some altcoins that are getting attention in futures markets, and finally looking at the exchange landscape in the derivatives market.

First, a very quick primer on derivatives and perpetual futures. A derivative is a product that derives its value from the underlying asset it is designed to track, exactly like traditional futures contracts and options. One of crypto’s best innovations has been the perpetual future (perps), a future contract that has no specified expiration date. Perpetual futures have a funding rate which is the fee charged for keeping the position open indefinitely, which is paid by either the long or short side depending on the demand imbalance (more demand for long positions and the funding rate is paid by the long side). Open interest refers to the amount of open positions there are in the market, long or short. Otherwise, crypto derivatives operate the same as their tradfi counterparts. Now, how do we gauge investor sentiment?

Never Miss a Deep Dive.

Price Discovery

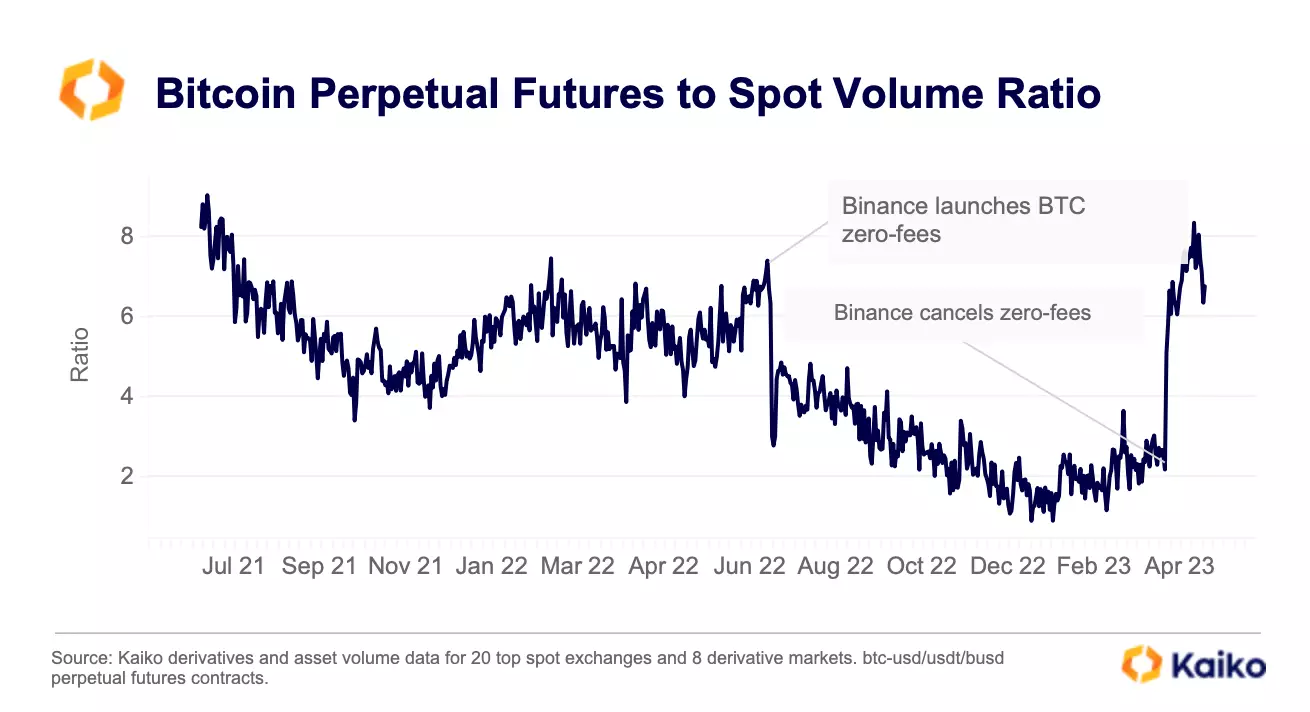
Price discovery in crypto markets has historically been correlated to volumes. The more volumes taking place on Binance for example, the more Binance is responsible for price discovery, obviously. Looking at the ratio of perpetual future volume to spot volume allows us to determine which market is gaining more relative to the other in its share of volumes, suggesting it is becoming more responsible for price discovery. That ratio is at its highest in nearly two years for Bitcoin markets, meaning derivatives have seen relatively more volumes as of late than spot markets. This suggests price discovery is shifting towards futures markets.

Interestingly, Binance introducing zero fee trading on BTC pairs had seen spot markets gain a larger share of volumes last year. However, the reintroduction of fees on most BTC pairs on Binance has seen spot volumes drop, while perpetual futures command more of the market: now over 6x the volumes on spot markets. With that in mind, derivatives markets should be a particularly strong indicator for Bitcoin’s price action in the short term, so let’s take a closer look at various metrics to gauge sentiment.

Bitcoin

As a refresher, open interest is the amount of open positions, either long or short, and funding rate is the fee paid by either the long or short side, depending on demand. Combining the two allows us to see when there is a buildup of positions on either side and determine whether a move was driven by shorts or speculative longs. 

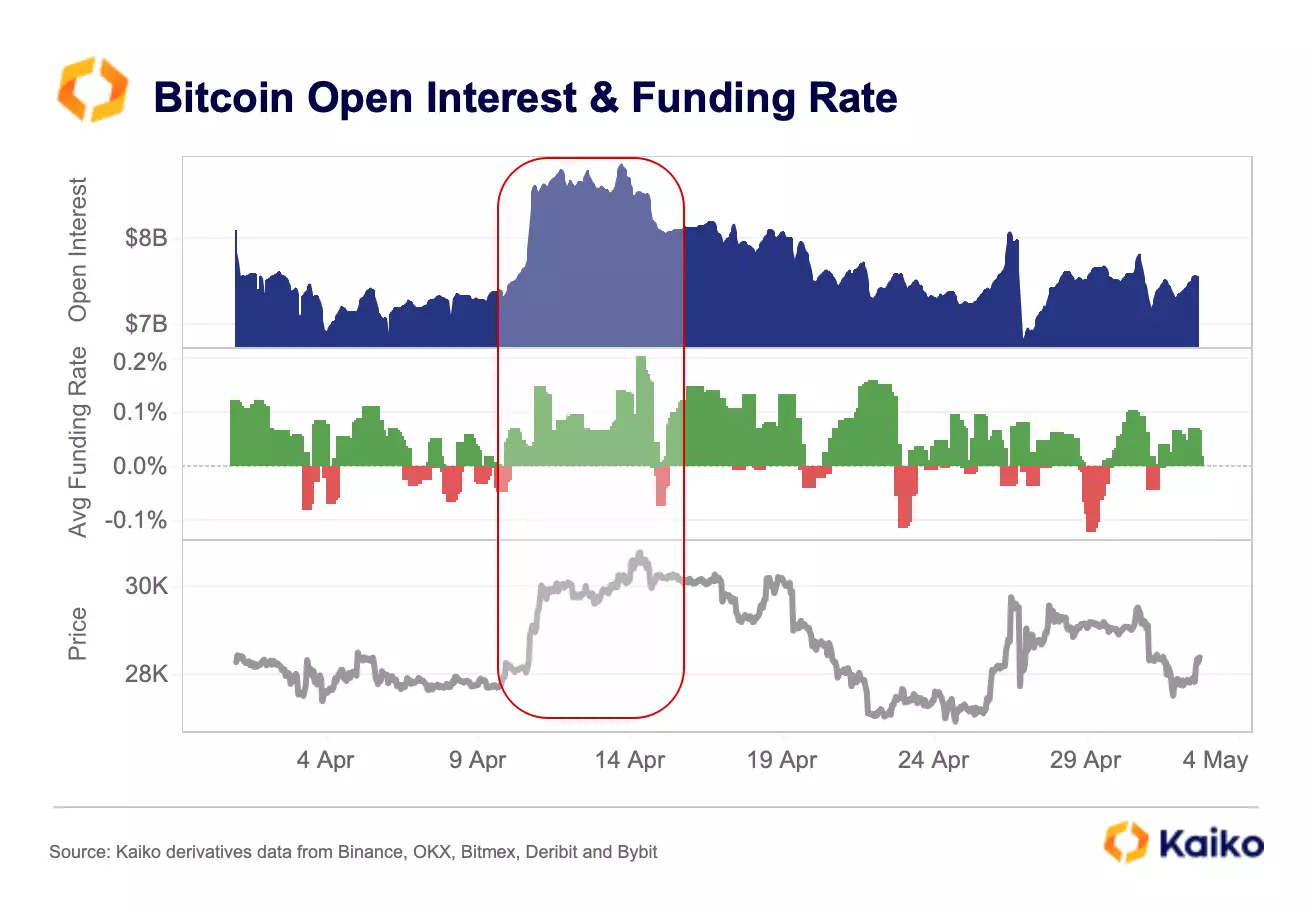
We can see a huge buildup of nearly $2bn of open interest on the 10th of April for Bitcoin futures, coinciding with some of the most positive funding rates we saw this month.

We can conclude that speculative long positions drove this rally and the positive price action seemed to top out as soon as funding rates flipped negative. This chart is a good example of how perps are driving BTC price action at the moment. As of today, open interest is relatively muted and there has been no persistent bias in funding rates, so there is no clear indication of short term price action just yet.

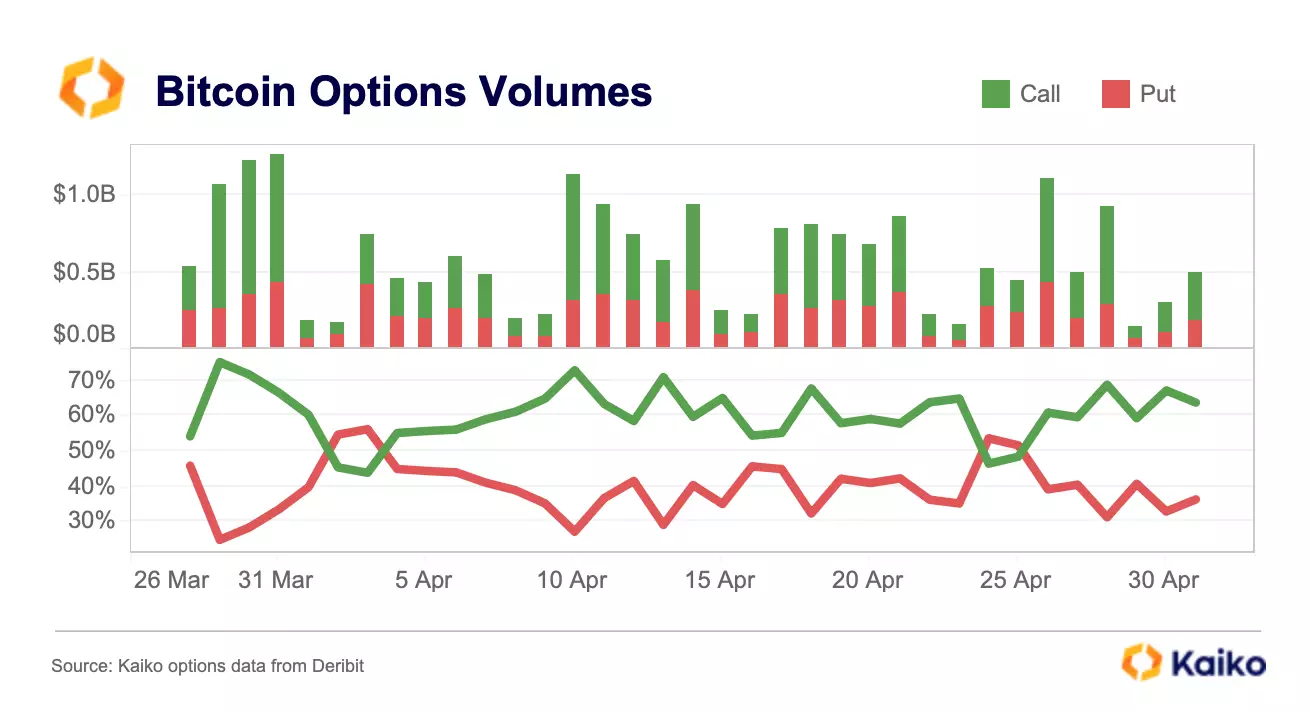
Options markets are another extremely useful gauge of sentiment, with calls being bullish indicators and puts being bearish bets. Keeping track of not only general volume increases in option markets but also the split between calls and puts offers us another insight into investor sentiment. We can see that every spike during the month of April were predominantly calls, often reaching up to 70% of volumes.

As of today, that share is around 60%, suggesting continued bullish sentiment among option investors.

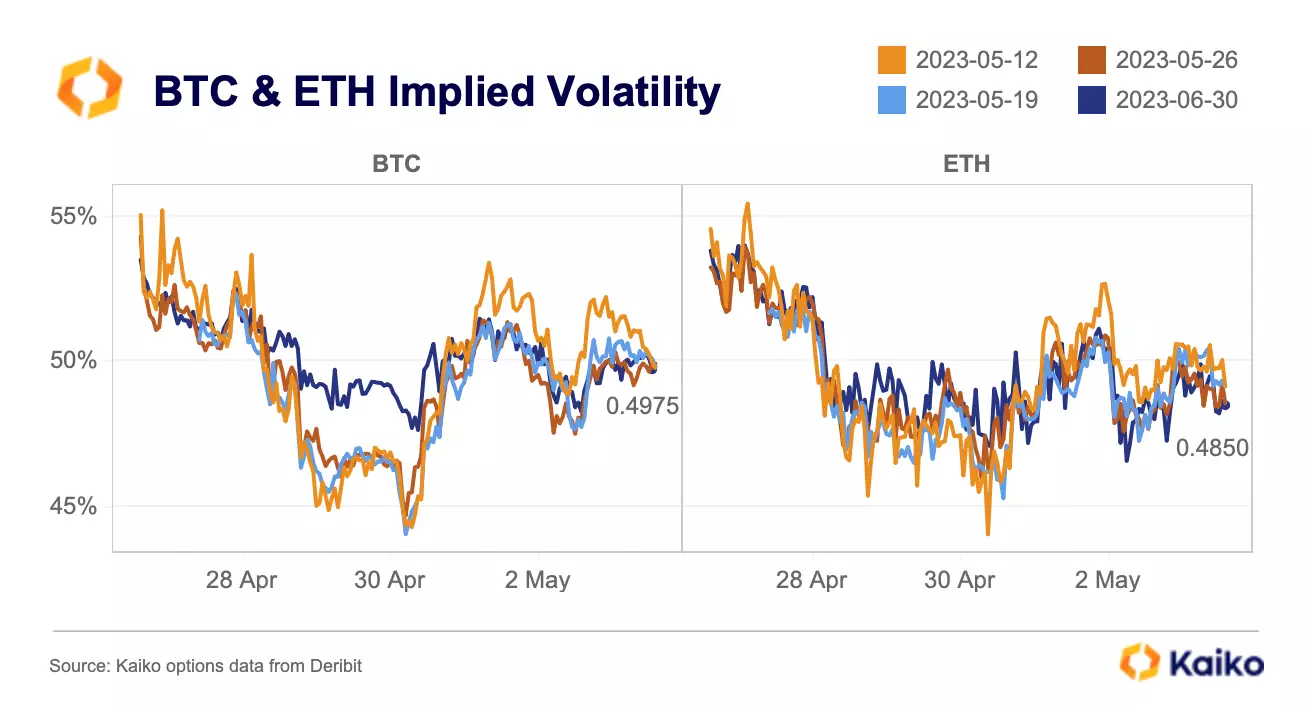
Volatility is one of the inputs that make an options price, and as such can be derived from the other inputs, such as strike price and time to expiry, to give us a measure of implied volatility i.e the amount of volatility that is priced into an options price. This allows us to arrive at implied volatility (IV), a forward looking measure of volatility that offers us an insight into the volatility expected by option prices.

As of today, and for the last week, Bitcoin’s IV is actually higher than ETH’s IV for most expiries, suggesting option investors are expecting relatively more volatility for BTC. This is not the usual structure for IV, normally ETH has consistently higher IV as BTC is seen as the safer asset.

Speculating as to why this might be the case, perhaps the possibility of more bank failures on the horizon has investors expecting BTC’s price to react more than ETH’s. Another explanation could be that with Shapella in its rear view, perhaps ETH has entered a new era following its big upgrades and its volatility may be on par with BTC’s moving forward.

With that in mind, let’s take a closer look at ETH derivative markets. 

Ethereum

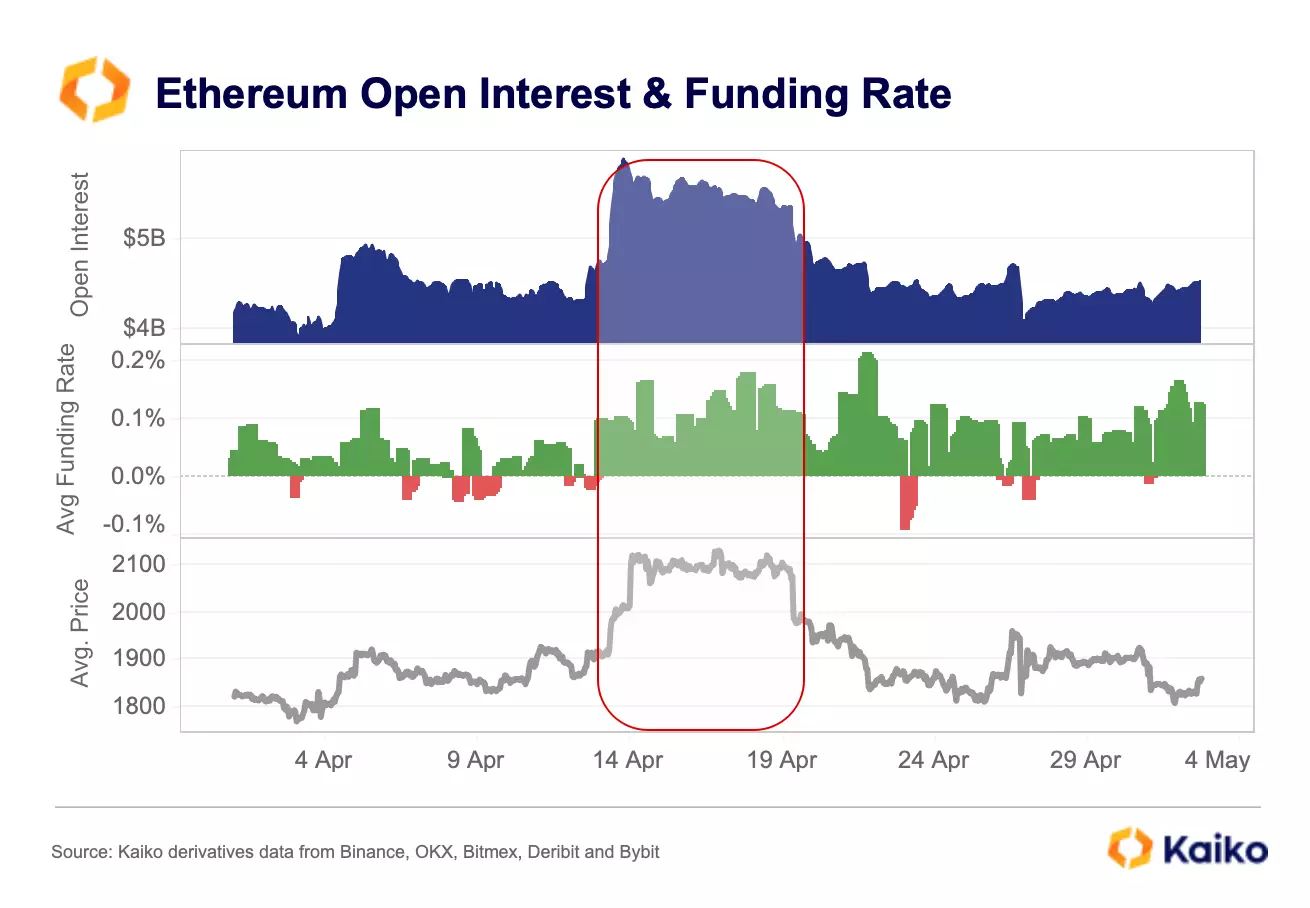
Unlike BTC futures, ETH didn’t have a buildup of open interest on the 10th of April, rather the big buildup for ETH was on the 13th, one day after the successful completion of Shapella. The buildup was huge, touching a near $2bn increase, while funding stayed positive until the 24th of April.

Interestingly, the price rally for ETH was a couple of days later than BTC, which again should show us how driven these prices are now by derivatives markets. As of today, funding rates are more positive for ETH than for BTC, but open interest remains muted for now.

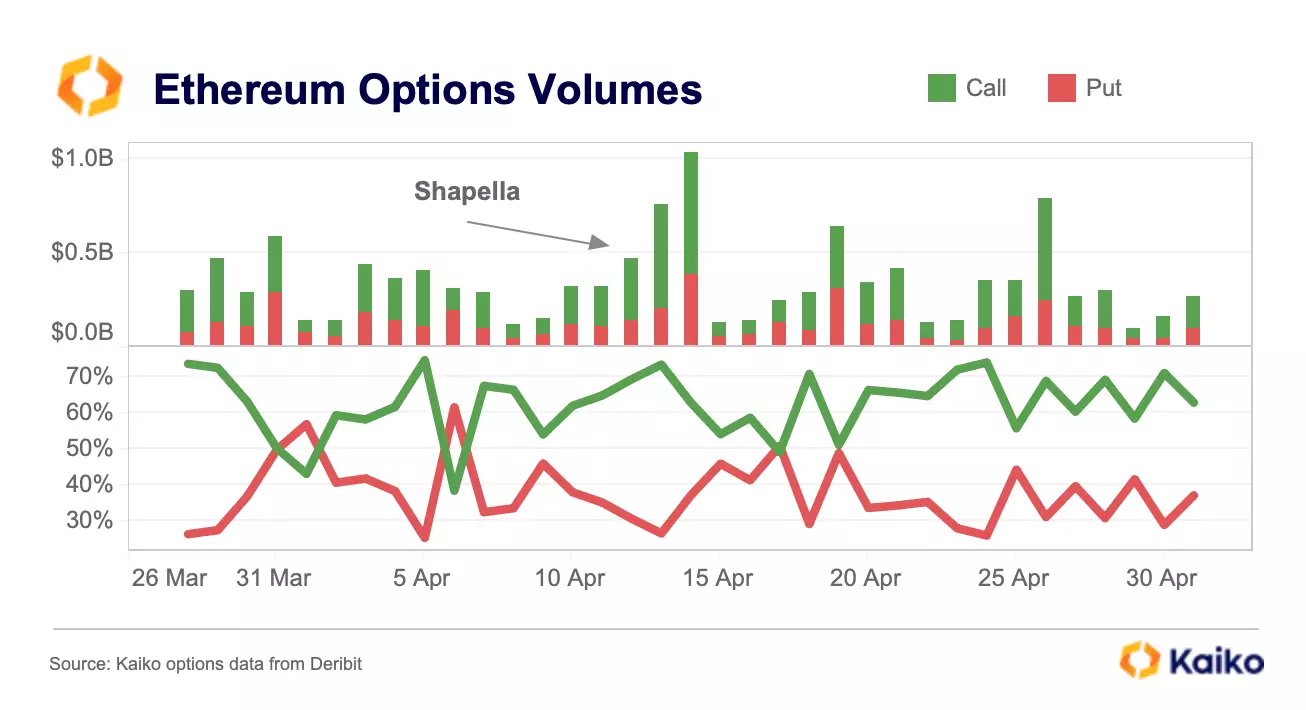
ETH option market volumes really picked up pre- and post-Shapella, and a successful update saw call bets commanding over 70% of volumes in the days after.

altcoins

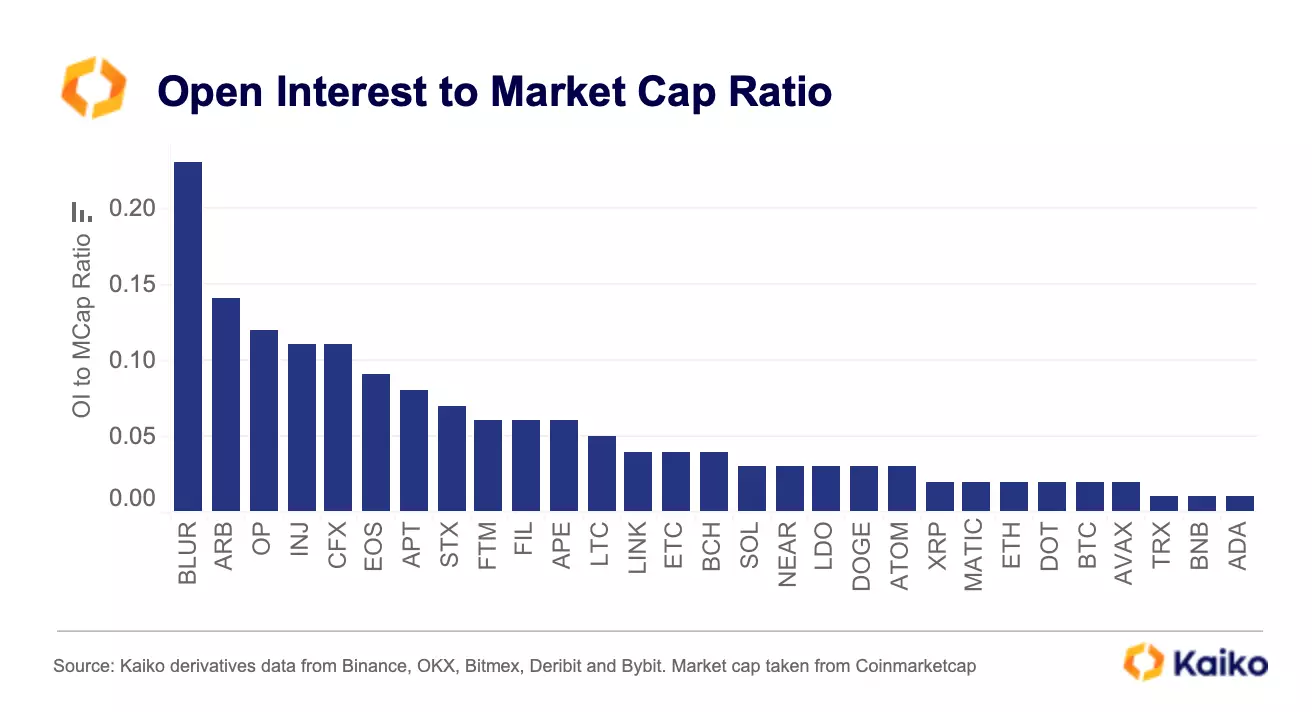
Altcoins are particularly interesting from a derivatives point of view as positions taken up in futures can be rather large compared to that altcoin’s market cap. This makes price discovery for these tokens even more concentrated in futures markets. Using an open interest to market cap ratio allows us to highlight those tokens with outsized perpetual futures positions open relative to its market cap, indicated by a higher ratio.

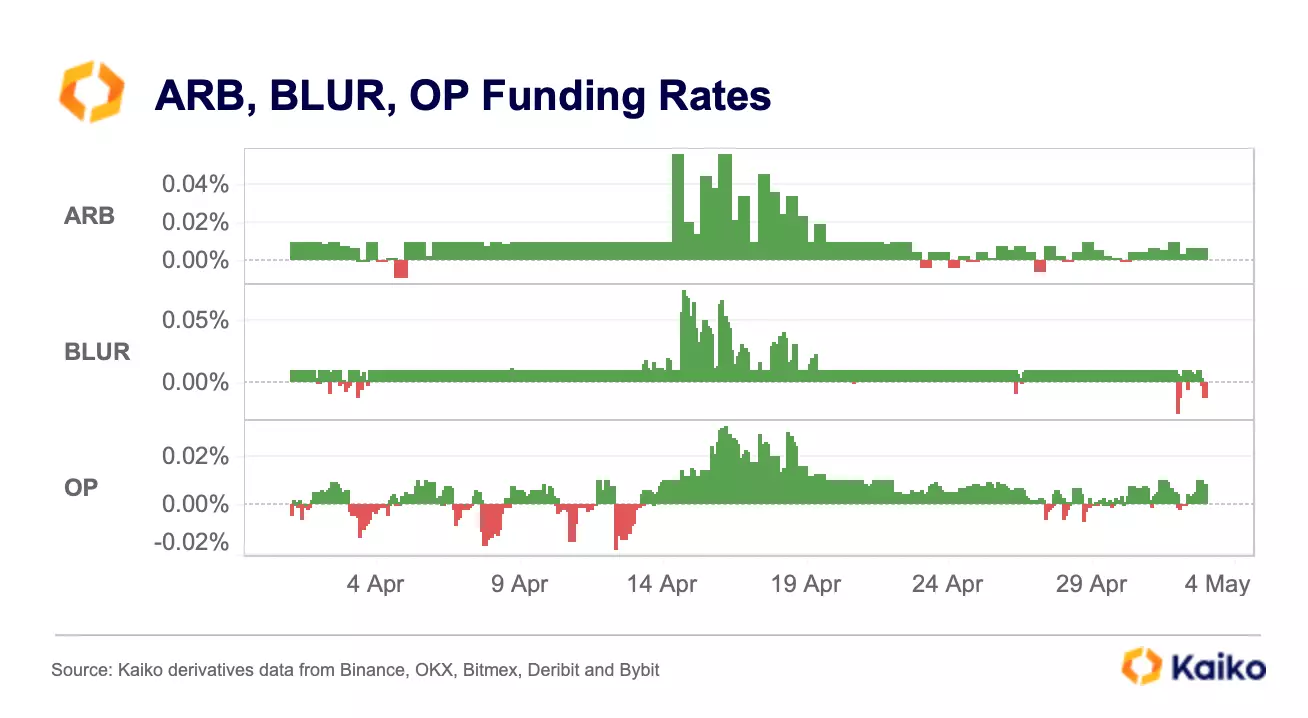
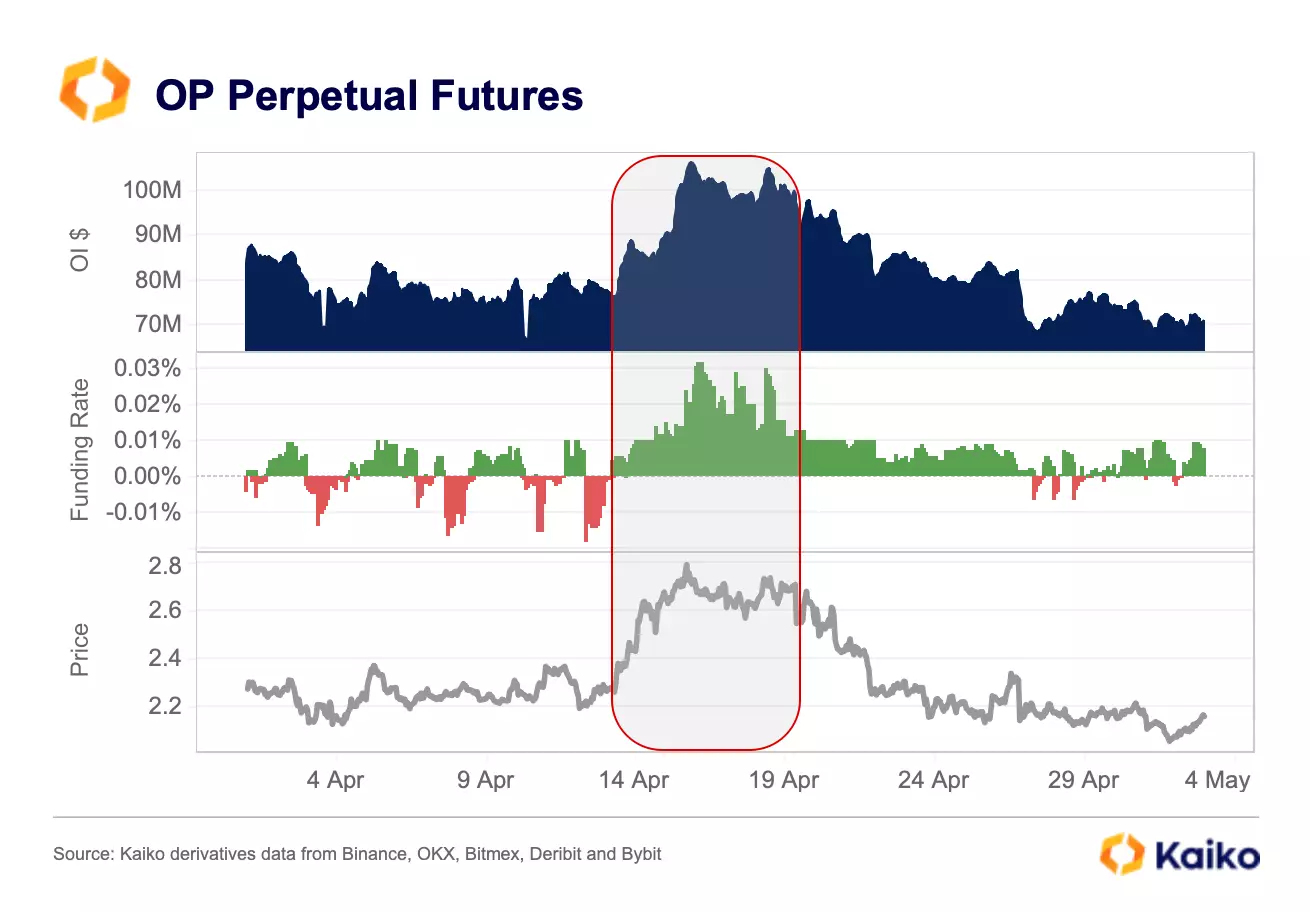
We can see the highest ratios belong to NFT marketplace BLUR, and Layer 2’s ARB and OP, suggesting perpetual futures are having an outsized influence on their token prices. Looking at funding rates, all three tokens benefitted from speculative long positions with persistently positive rates, similar to the run up we saw for ETH. However, there doesn’t seem to be any major bias as of today, with the exception of BLUR whose rates remain negative.

Taking OP as an example, we see very similar action in perpetuals and price movements as we saw with ETH, a buildup of open interest from longs which drove price higher after a successful Shapella update.


Exchange Landscape

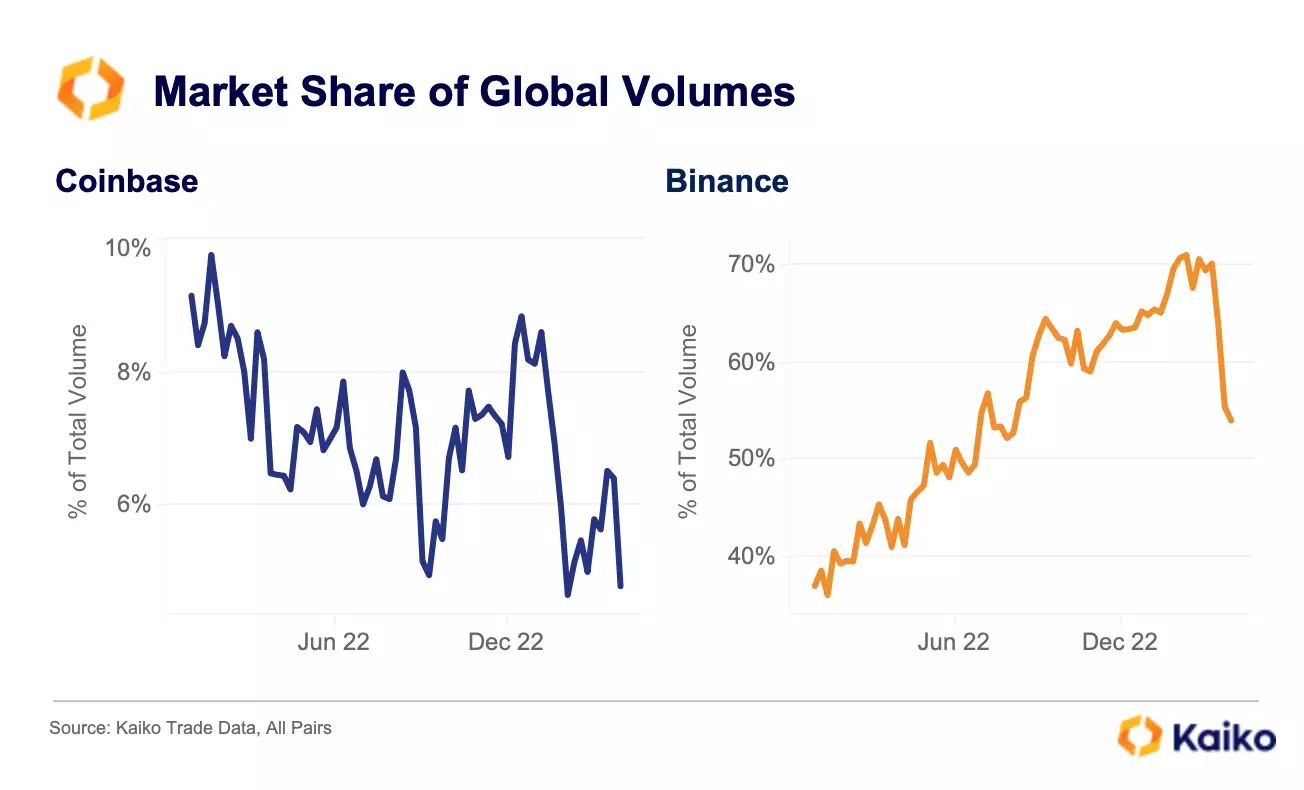
This week, Coinbase launched an offshore derivatives exchange, based in Bermuda. This move makes a lot of sense, particularly when looking at Coinbase’s share of total spot volumes.

Since the start of 2022, Coinbase’s share of volumes has almost halved, falling from 10% to 5% while Binance gained as much as 30% market share over the same time period, before losing some in the last couple of weeks with their reintroduction of fees. 

As with most U.S crypto exchanges, Coinbase has been the target of significant attention from the SEC, threatening their growth prospects. Overseas exchanges, on the other hand, are facing a lot less regulatory uncertainty, making them more competitive against their U.S counterparts.

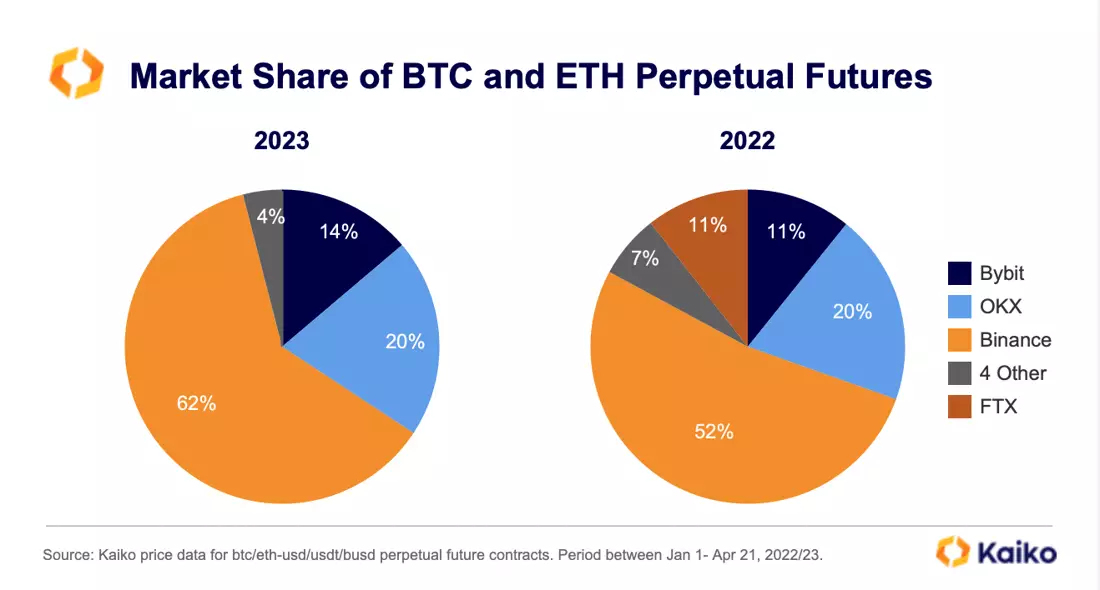
Binance benefitted the most from FTX’s collapse in terms of derivatives market share, gaining virtually all of the 11% share FTX had, with Binance rising from 52% share of volumes in 2022 to 62% in 2023.

Gemini also looks to be entering the race for perpetual futures market share, announcing they were making the same move as Coinbase in an effort to become more competitive.

With Coinbase and Gemini entering the market, it is very possible they can command significant market share in the space, particularly with less regulatory concerns to worry about offshore.


Conclusion

With perpetual futures increasingly commanding more share of volumes than spot, investors should pay close attention to the shifts in sentiment among derivatives investors for an insight into short term price action. One thing we didn’t see in April was a big buildup of short positions, which usually sets up nicely for a short squeeze on any positive news. Instead, we saw a buildup of longs after both banking failures and a successful ETH update. Exchanges are aware of the increasing relevance of derivatives, as evidenced by Coinbase and Gemini launching offshore exchanges amid falling spot volumes. Launching offshore perpetual future exchanges allows Coinbase and Gemini to be more competitive with the likes of Binance who dominate both spot and derivative markets.

Data Used In This Analysis

  • Derivatives

    Perpetual Future Volumes, Open Interest, Funding Rates and Option Volumes

  • Trade Data

    Aggregated trade volume across all exchanges

  • Learn More

    Dozens of data types from 100+ CEX and DEXs

More From Kaiko Research

  • Bitcoin

    19/12/2024 Deep Dive

    Kaiko's Top 10 Charts of 2024

    As the year comes to a close we wanted to recap some of the top stories and datapoints of 2024. It was a seminal year for crypto markets. In spite of hostile regulatory conditions persisting it was also a monumental year for regulatory development with the launch of BTC and ETH ETFs alongside impending regime changes.


  • Bitcoin

    16/12/2024 Data Debrief

    What are the odds of Santa Rally?

    Bitcoin hit a new all-time high early Monday, surpassing $106K on some exchanges amid US BTC strategic reserve buzz. In other news, Microstrategy secured Nasdaq-100 inclusion, the parent company of Japanese exchange Coincheck began trading on Nasdaq, and USDC issuer Circle announced a strategic partnership with Binance.

  • Asia

    12/12/2024 Deep Dive

    Around the world in crypto trends

    As the year winds down, we’ve analyzed global crypto market trends, spotlighting key figures driving adoption across various countries. This regional deep dive highlights successes, challenges, and how unique market drivers, regulations, and structures shape crypto usage in each country.

  • CEX

    09/12/2024 Data Debrief

    Isolationary regulation, a double-edged sword

    Bitcoin finally crossed $100k in the early hours of Friday morning. It has since whipsawed either side of that number amid heightened volatility. Elsewhere, Donald Trump chose Paul Atkins to lead the SEC, following confirmation by the senate.