Trend of the Week
ETH breaks out on strong spot demand.
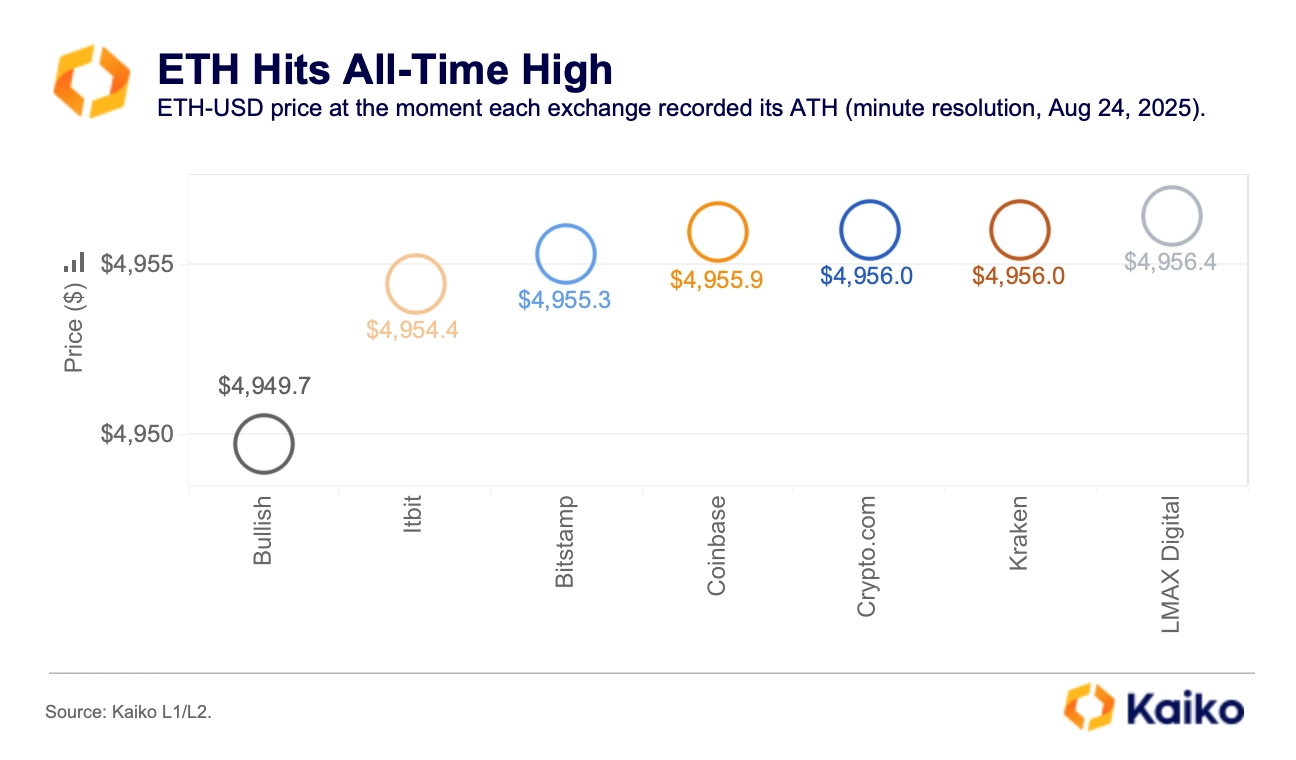
Ethereum finally broke above its 2021 all-time high after Fed Chair Powell’s Jackson Hole remarks boosted risk assets. ETH surged more than $600 within hours on Friday, set a new record that day and another on Sunday, then eased as traders took profits.
So is this just a catch-up move or the start of something bigger? Even after the pullback, liquidity and volumes remain supportive for ETH.
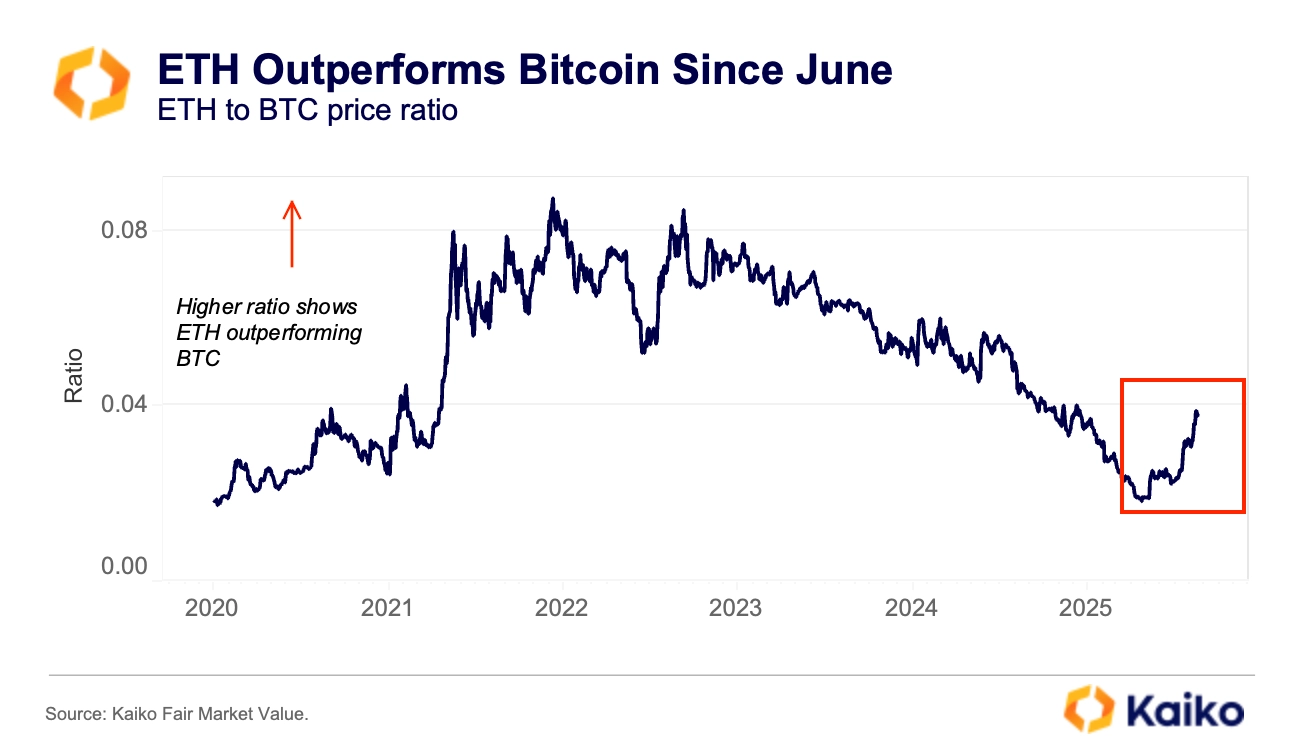
Since July, the ETH to BTC price ratio has trended higher, indicating ETH’s price has risen faster than BTC. ETH has also outperformed other large caps like SOL and XRP, supported by steady ETF inflows and reported corporate treasury buying.
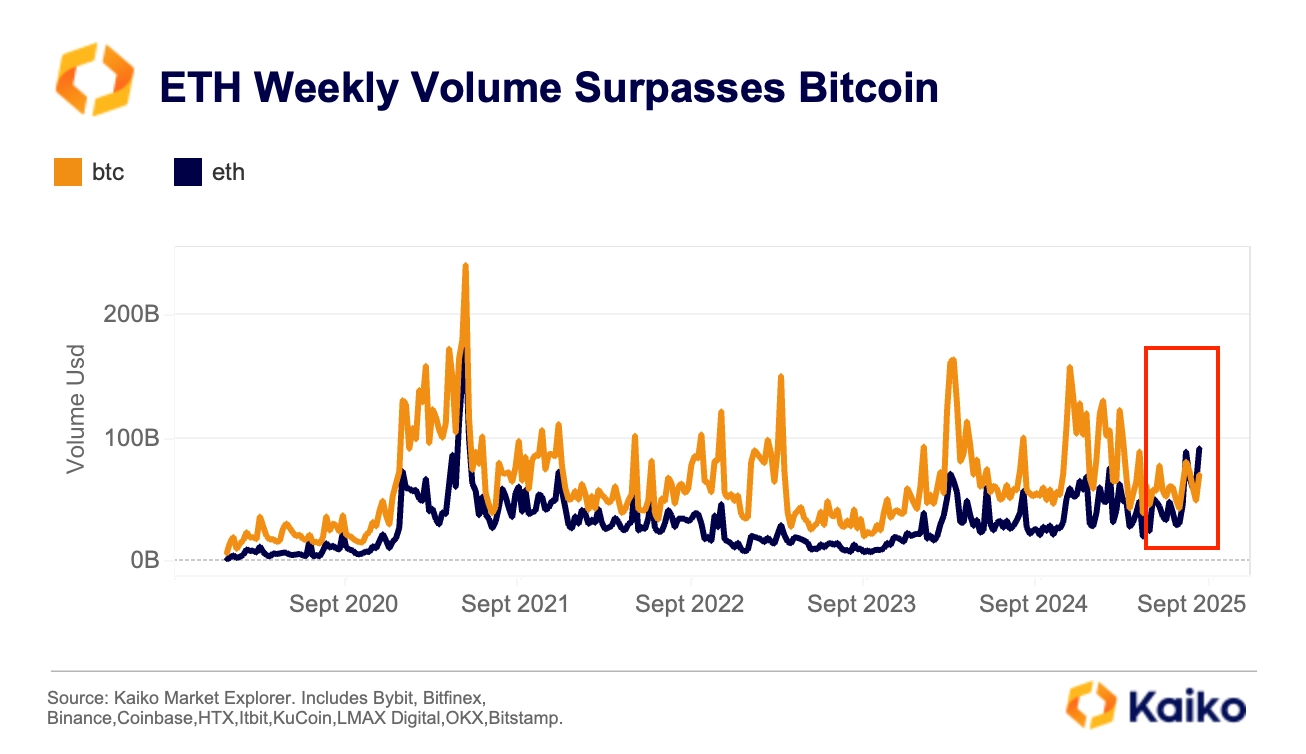
Trading volumes reflect the momentum. July posted a YTD high for ETH monthly volume, with several sessions where ETH turnover surpassed BTC on major centralized exchanges.
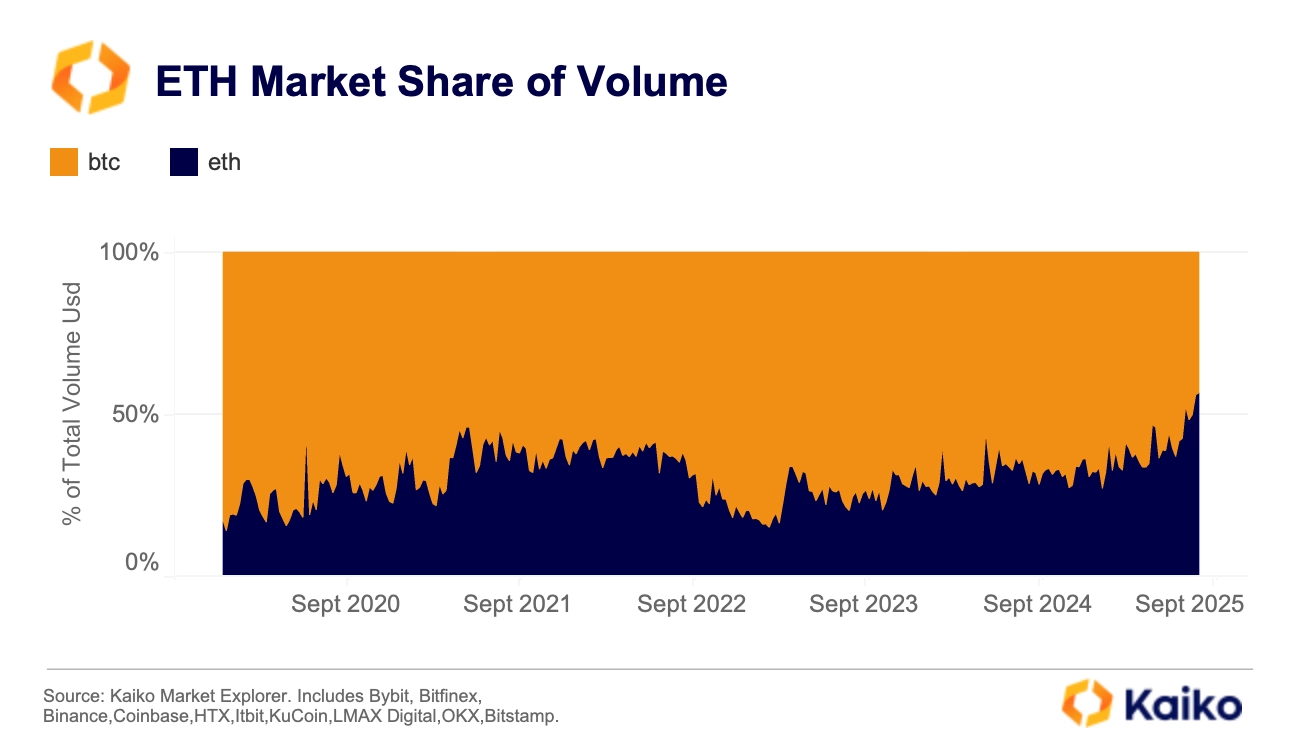
ETH’s share of combined BTC/ETH volume climbed to multi-year highs above 56%, indicating broader participation. Order-book depth has also increased and is nearing record levels. While asks currently outweigh bids—suggesting some near-term resistance—the thicker books overall point to healthier liquidity and better execution for ETH.
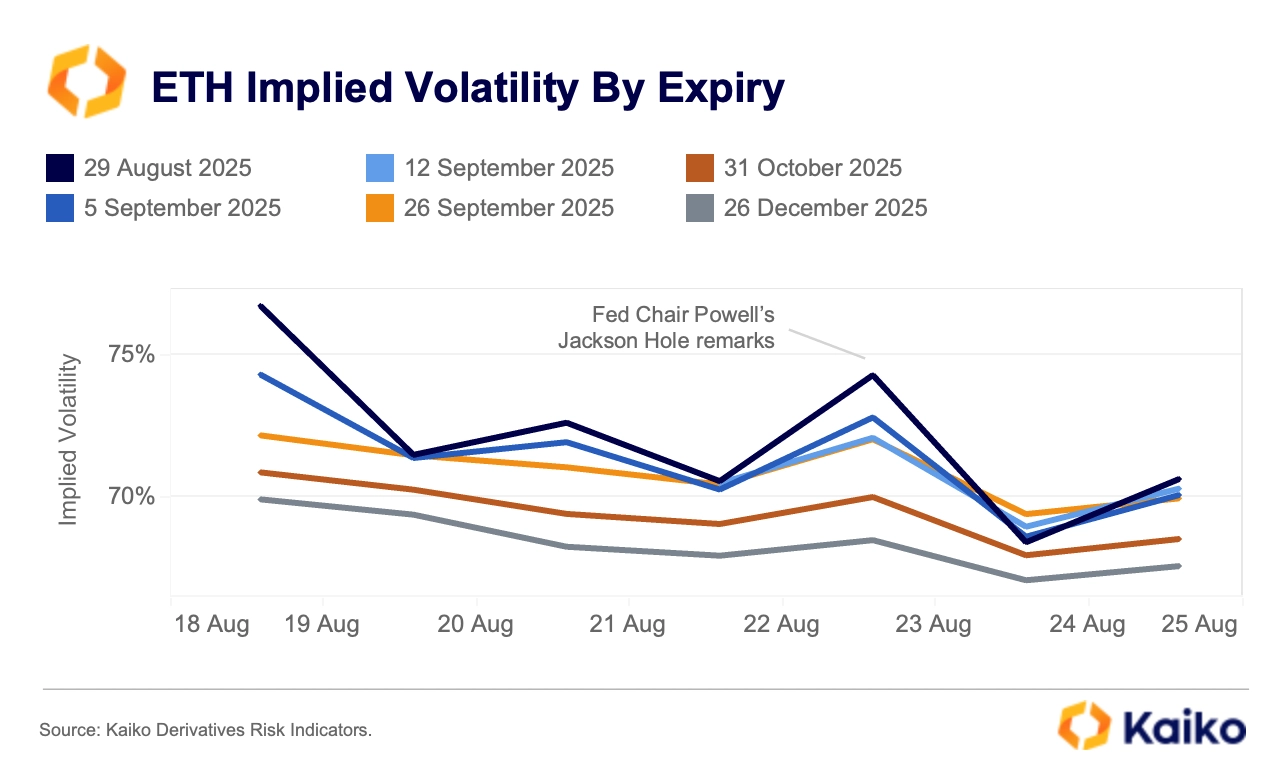
ETH implied volatility has trended lower since Aug 18 across all expiries. However, Jackson Hole on Aug 22 caused an uptick, especially in short-term expiries. The term structure remains inverted, with short-dated IV above longer-dated IV, so traders still expect more near-term noise than medium-term risk, but the front-to-back premium has narrowed. Net-net, the market appears to be moving from “brace for a big move” to “choppy but contained,” barring a fresh catalyst.
Is the U.S. gearing up for a stablecoin summer?
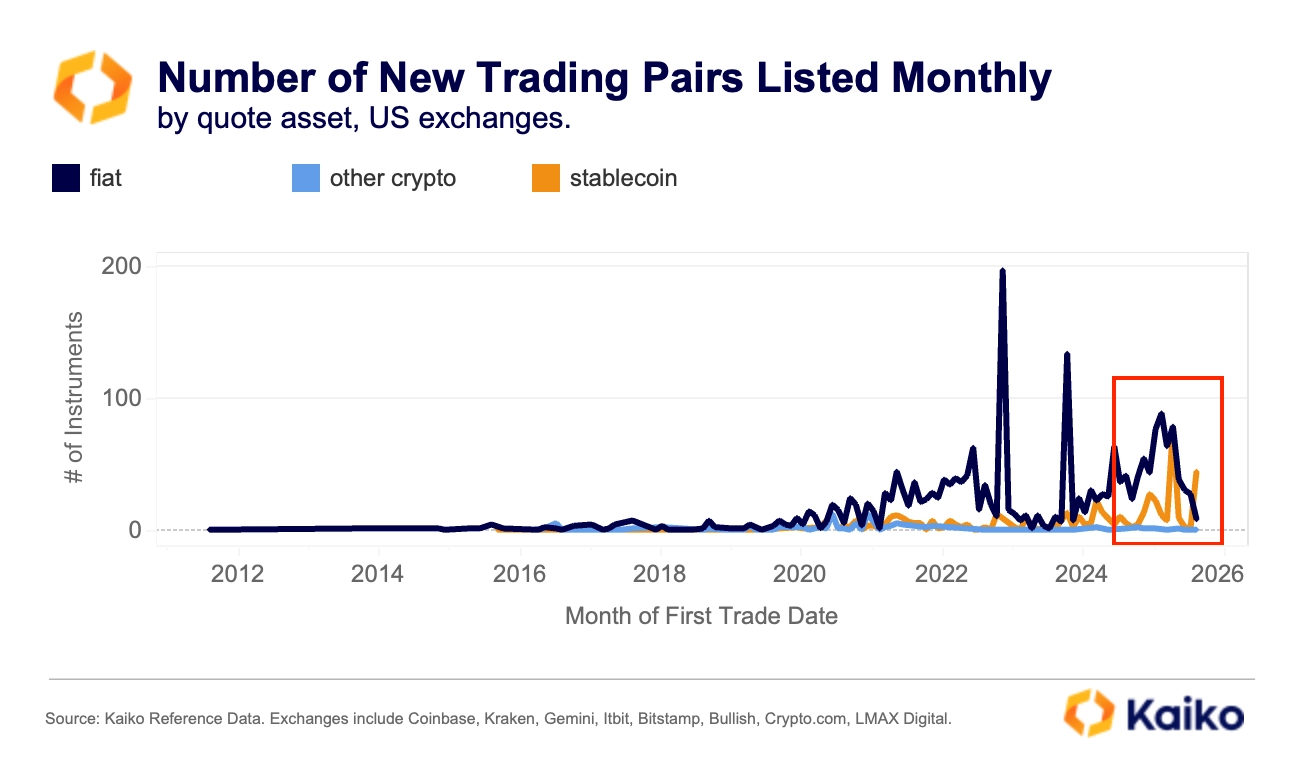
Since President Trump signed the Genius Act last month, establishing a bank‑like supervisory framework for stablecoins, U.S. exchanges have accelerated listings. In July, for the first time, newly listed stablecoin‑denominated pairs surpassed fiat pairs, marking a structural shift and signaling greater confidence in future adoption.
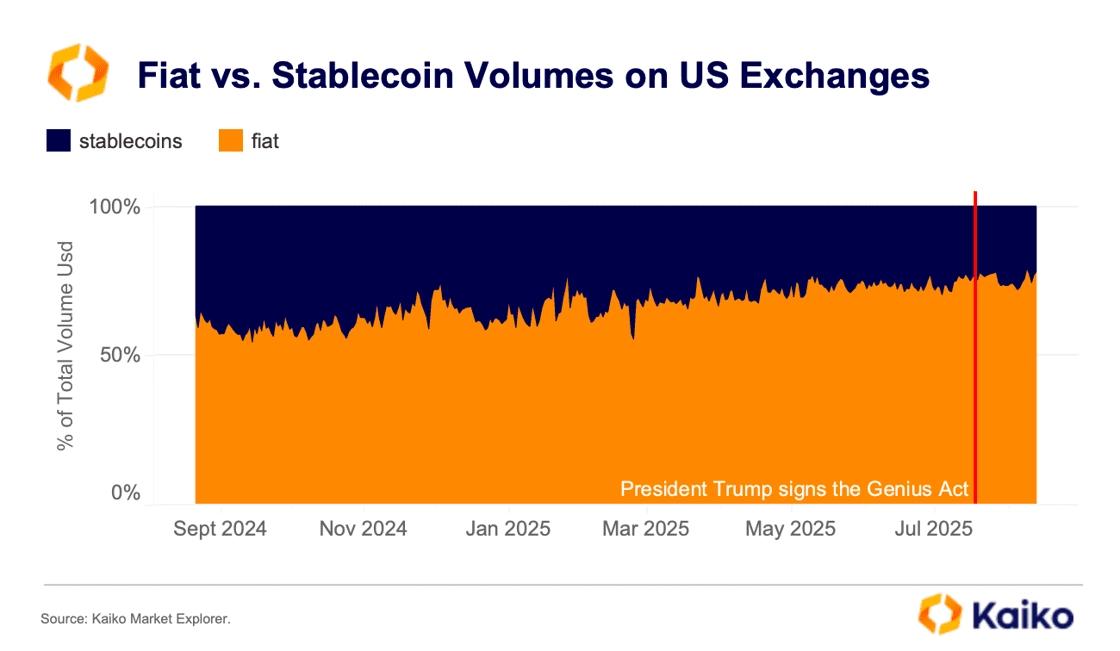
Still, trading activity looks less bullish. After peaking at a record $14 billion at the end of 2024, U.S. stablecoin volumes have stalled, averaging about $2 billion/daily in Q3. In contrast, fiat volumes have risen, indicating traders still favor crypto‑fiat over crypto‑stablecoin. Fiat’s share has grown over the past year, crowding out stablecoins and suggesting institutions continue to view fiat as safer and more liquid.
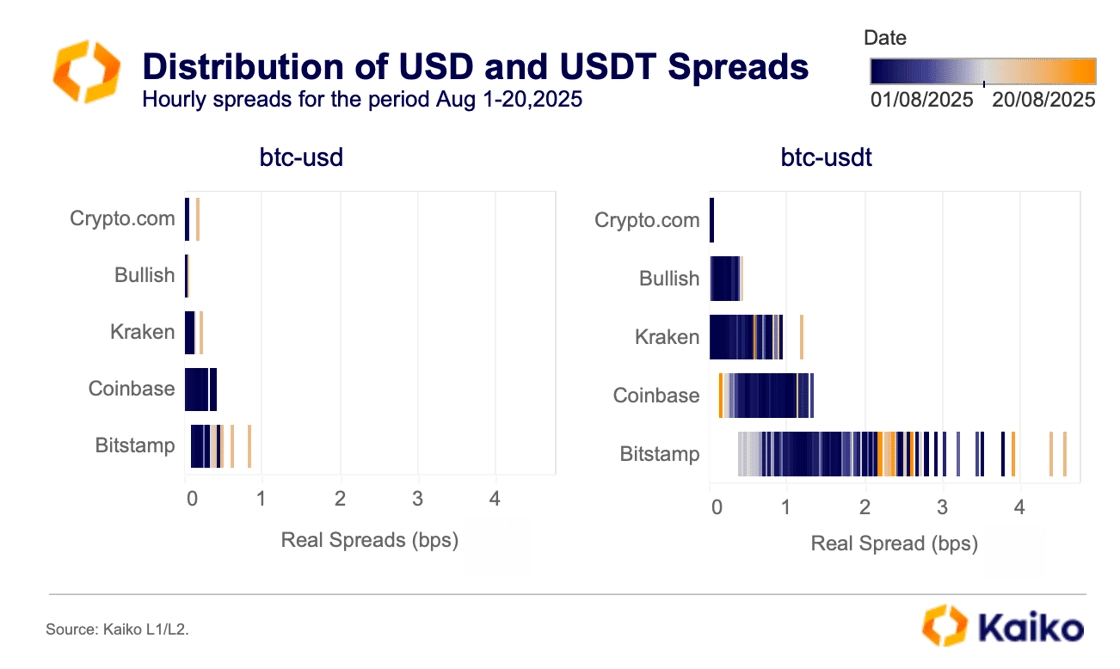
Despite regulatory progress favoring stablecoins, liquidity remains the bottleneck: stablecoin pairs are far less liquid than fiat pairs, limiting their appeal to large traders and institutions.
Outside the U.S., stablecoins continue to attract users by providing easy access to digital dollars, while governments test local-currency options to retain usage and monetary control. Japan’s JPYC recently won a license to launch the first yen-pegged token. South Korea and Brazil are also considering won- and real-backed versions. Scale remains the main hurdle, as Tether’s USDT and Circle’s USDC continue to dominate liquidity and integrations.
XRP leads the optimal large-cap altcoin portfolio in 2025.
In 2025, large‑cap altcoins have taken the spotlight, buoyed by rising volumes and renewed institutional interest. Recent rallies show investors seeking exposure beyond Bitcoin concentrating in ETH, XRP, and other large caps, ADA, DOGE, and SOL.
To assess portfolio dynamics, we ran a Monte Carlo simulation using data from Jan 1 to Aug 18, 2025. We drew 10,000 random portfolios across these five assets (weights summing to 100%) and evaluated them by Sharpe ratio. XRP and ETH emerged as clear leaders.
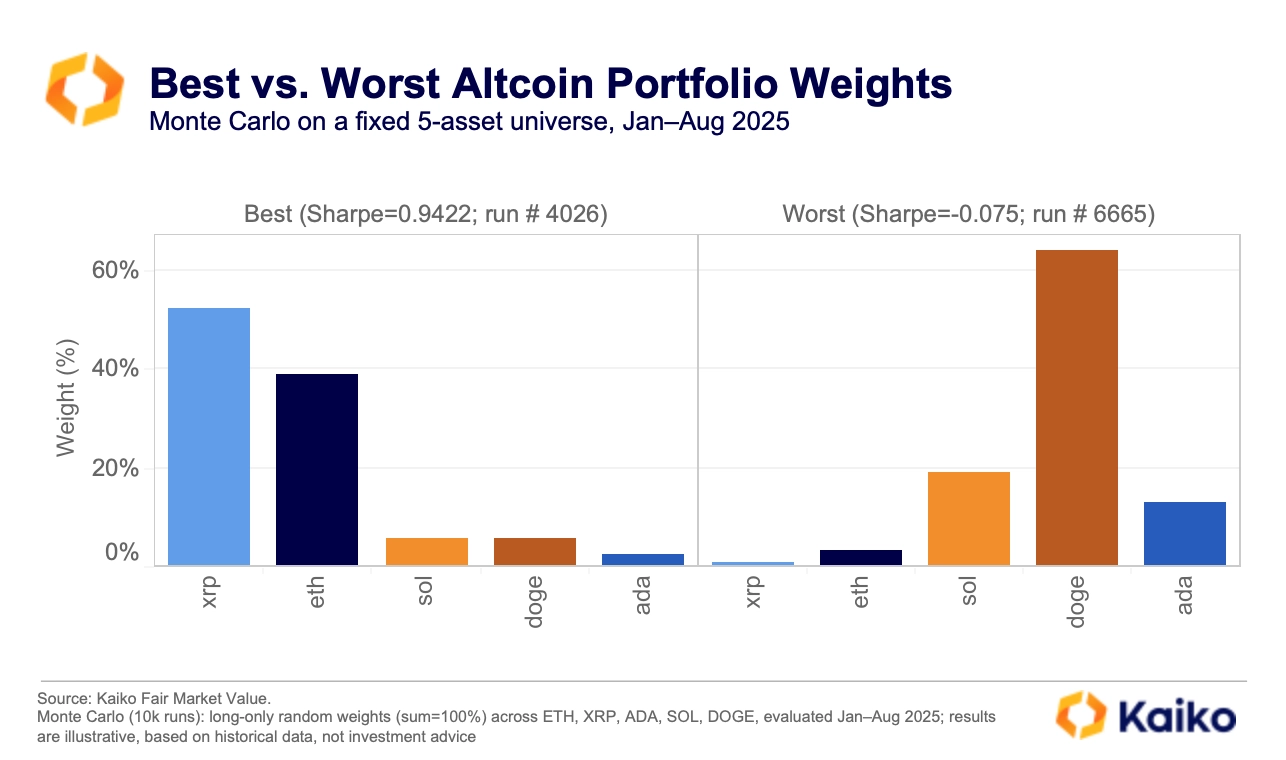
Results show that portfolios dominated by ETH and XRP consistently outperformed on a risk-adjusted basis. The single best portfolio, with a Sharpe ratio of 0.96, held approximately 50% ETH and 44% XRP, with only small allocations to ADA, SOL, and DOGE. By contrast, the weakest portfolios were heavily skewed toward DOGE, where allocations above 70% coincided with the lowest Sharpe ratios.
A new wrinkle for gold hedgers.
Despite recent volatility, the BTC‑to‑gold price ratio still favors Bitcoin, peaking near 36 in July and holding around 34 in August. The ratio rises when Bitcoin outperforms gold and falls when it lags. It has trended higher since April’s Liberation Day tariff announcement, which lifted volatility and demand for diversifiers.
Improving BTC spot‑market liquidity, a maturing ETF infrastructure with more efficient authorized participants, and steady spot ETF inflows suggest Bitcoin’s role as a portfolio diversifier is strengthening.
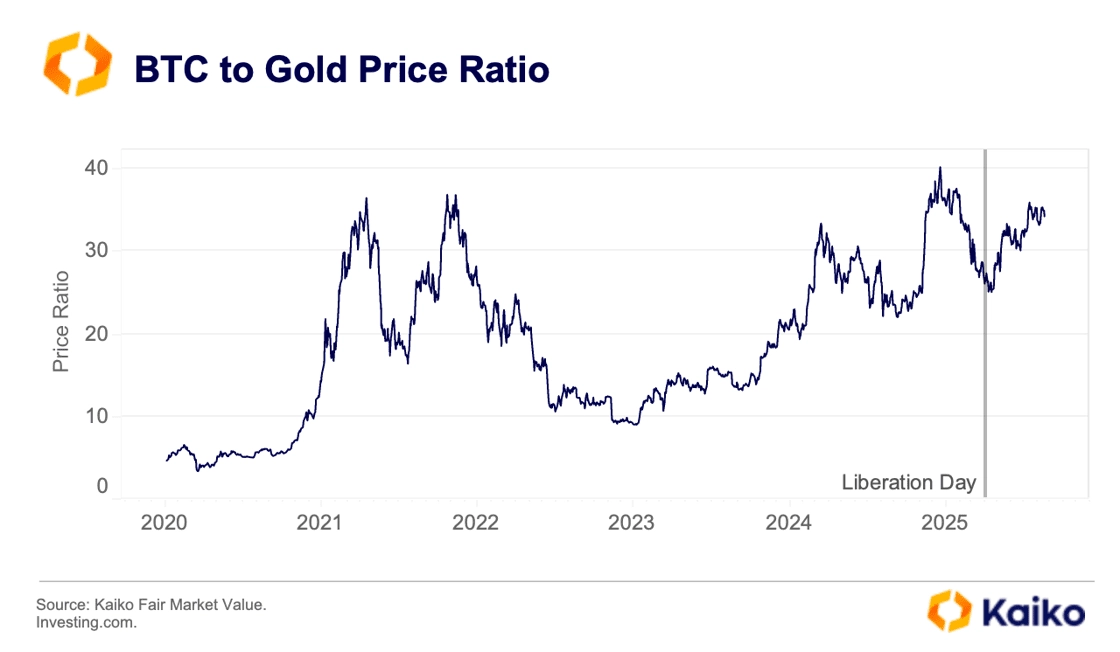
A fresh policy shift may extend that edge. U.S. Customs recently clarified that certain imported bullion formats (notably 1 kg and 100 oz bars common in Swiss exports) are subject to trade taxes, with possible retroactive liability. For U.S. investors hedging with imported bars, that adds cost and friction. If these trade‑tax headwinds persist, they may further tilt diversification demand toward Bitcoin’s natively digital, low‑friction cross‑border exposure.


![]()
![]()
![]()
![]()


