Kaiko's Q1 market report is now live!

Lifting the Veil on Centralized Exchanges

CEX

Liquidity

Written by Riyad Carey

13/04/2023

Welcome to Deep Dive!

This week we present a case study exploring how centralized exchange data can be used for powerful analysis, despite its anonymity.

  • Binance’s trading volume during U.S. hours has declined since the CFTC lawsuit

  • Tick trades reveal strange ARB trading activity

  • Large selling of cbETH ahead of regulatory action dropped its price

It’s a truism within the industry that crypto is not an effective tool for crime. Yes, it’s possible to send value without an intermediary, but all transactionsleave a permanent tracethat can become more visible over time as tracking tools improve. It’s even possible totrackfunds that move through Tornado Cash — a protocol built specifically to enhance privacy by obfuscating token flows.

The one glaring exception to the easy tracing of crypto has always been centralized exchanges (CEXs). It’s possible to track tokens moving in and out of a CEX, but what happens within can be extremely difficult to uncover. This is because all CEX market data is anonymous to everyone but the exchange. As a result, some exchanges with lax KYC requirements have developed reputations as mixers, essentially centralized and possibly more effective alternatives to Tornado Cash.

But just because CEX data is anonymous doesn’t mean it can’t be used for powerful analysis. Today, I’ll demonstrate how it’s possible to use CEX and DeFi data together to pull back the curtain on market events, investigating the Arbitrum Foundation controversy, strange cbETH activity, and Binance’s trading hours.

Never Miss a Deep Dive.

ARBITRUM FOUNDATION

Arbitrum, an Ethereum layer 2 network, landed in hot water shortly after its airdrop when on-chain sleuths noticed that 50mn ARB tokens that were supposed to be locked had been moved. Shortly after, the Arbitrum Foundation tweeted that 40mn ARB had been “been allocated as a loan to a sophisticated actor in the financial markets space. The remaining 10 million has been converted to fiat.” While this reveal may have come as a surprise given that the DAO was currently voting on whether to allocate the Foundation with funds at all, it was clear in the data that something unusual was happening.

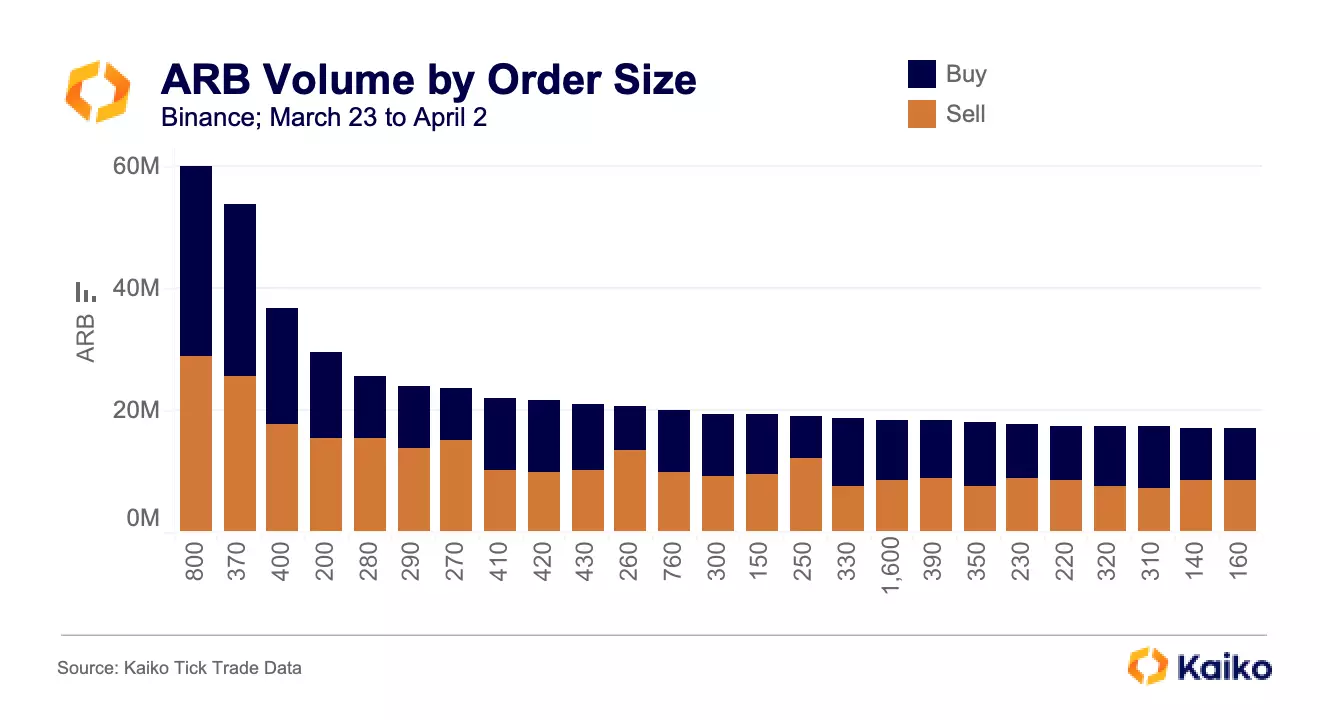
Below I’ve grouped by trade size every trade on Binance (where it appears most of the ARB was sent) before the Foundation posted the clarifying tweet (“800” includes every trade between 800 and 810 ARB). Only the top 25 groups are included. There are some interesting patterns here, but what I’m looking for is imbalances that signal an entity methodically selling a large holding.

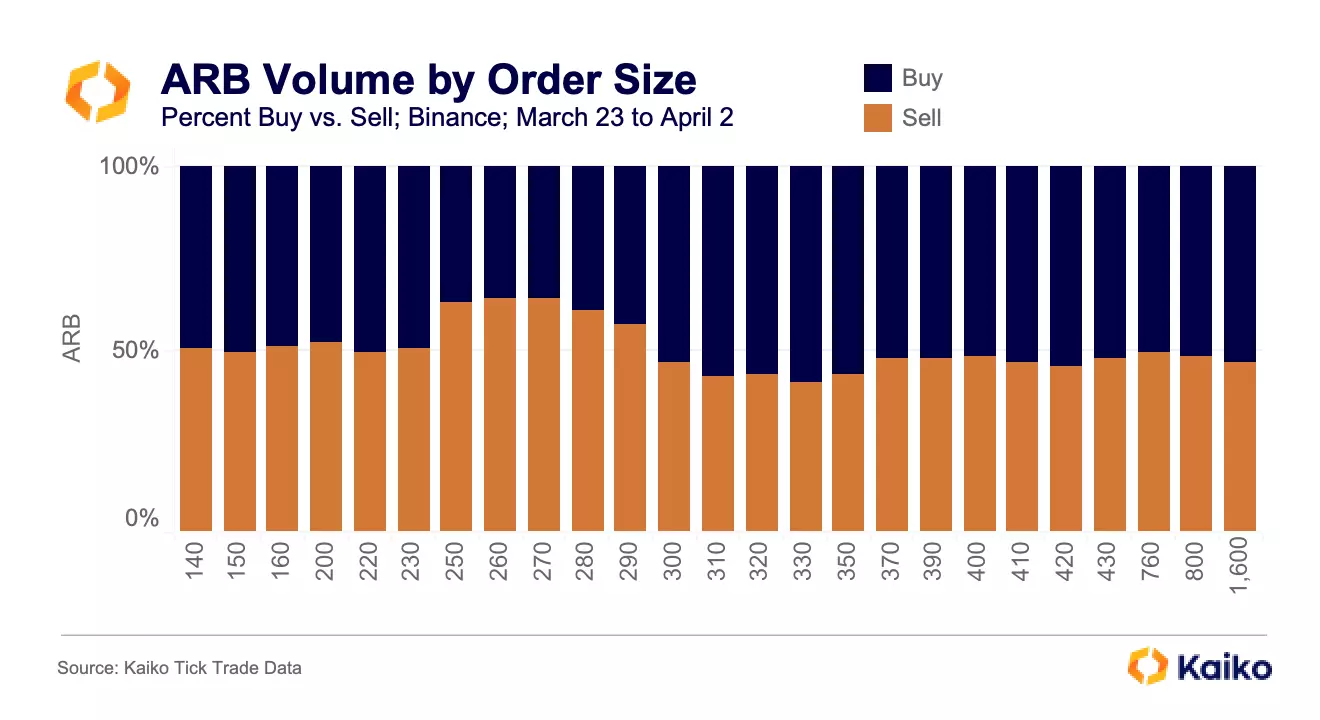
To better see this, I can chart the percentage of buys and sells in each group, which makes it instantly clear that there are some anomalies in the 200s.

Orders between 250–290 are all more than 60% sells and 250–280 is nearly 65% sells. On an exchange with as much volume as Binance, an imbalance like this persisting for days — especially in a high volume group — is a clear sign that someone is using a TWAP strategy to create or liquidate a large position without moving markets too much.

26mn more ARB was sold than bought in the 250–290 ARB trade size range during this time period, more than double the amount that Arbitrum said it had sold and more than half what Arbitrum loaned to the “sophisticated actor”.

An important follow up question here would be: is that just people dumping their airdrop? The answer to this is no, no recipient received fewer than 625 ARB and there is no reason to break up small positions into separate orders to minimize price impact.

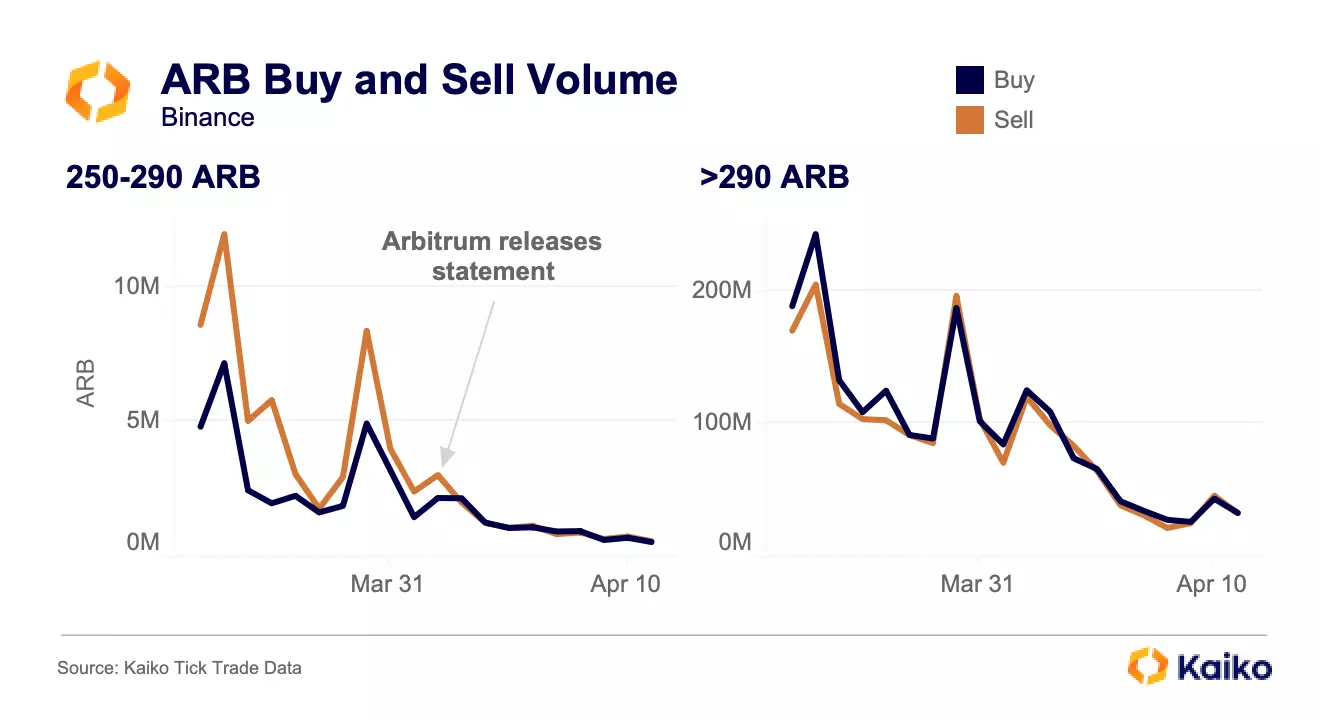
Shown another way, one can see that sells in the 250–290 ARB trade size range were significantly higher than buys until the day of the Twitter clarification. Meanwhile, buys and sells were essentially even for larger trades.

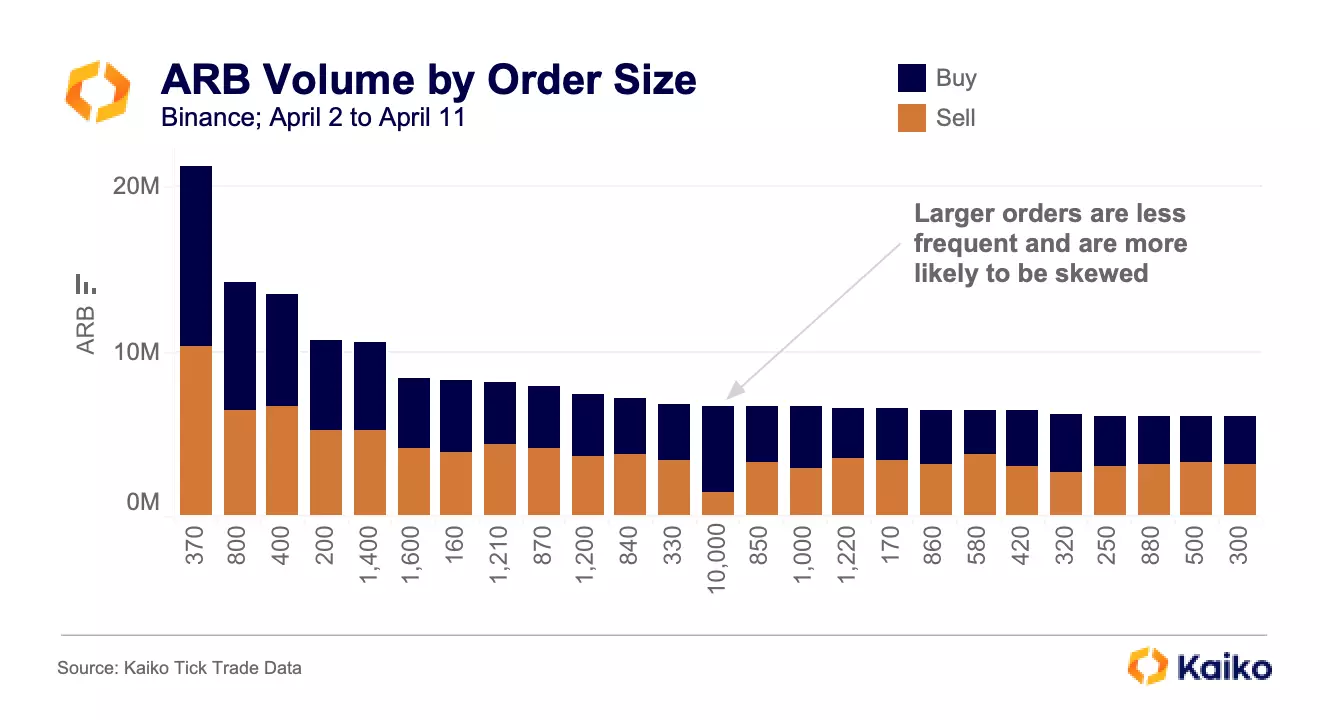
Finally, to wrap up this use case, since the tweet clarification the volume distribution has looked much more normal. Yes, the 800–810 group is still receiving an unusual amount of action, but the buy and sell ratio between the groups looks correct.

COINBASE WRAPPED STAKED ETH (CBETH)

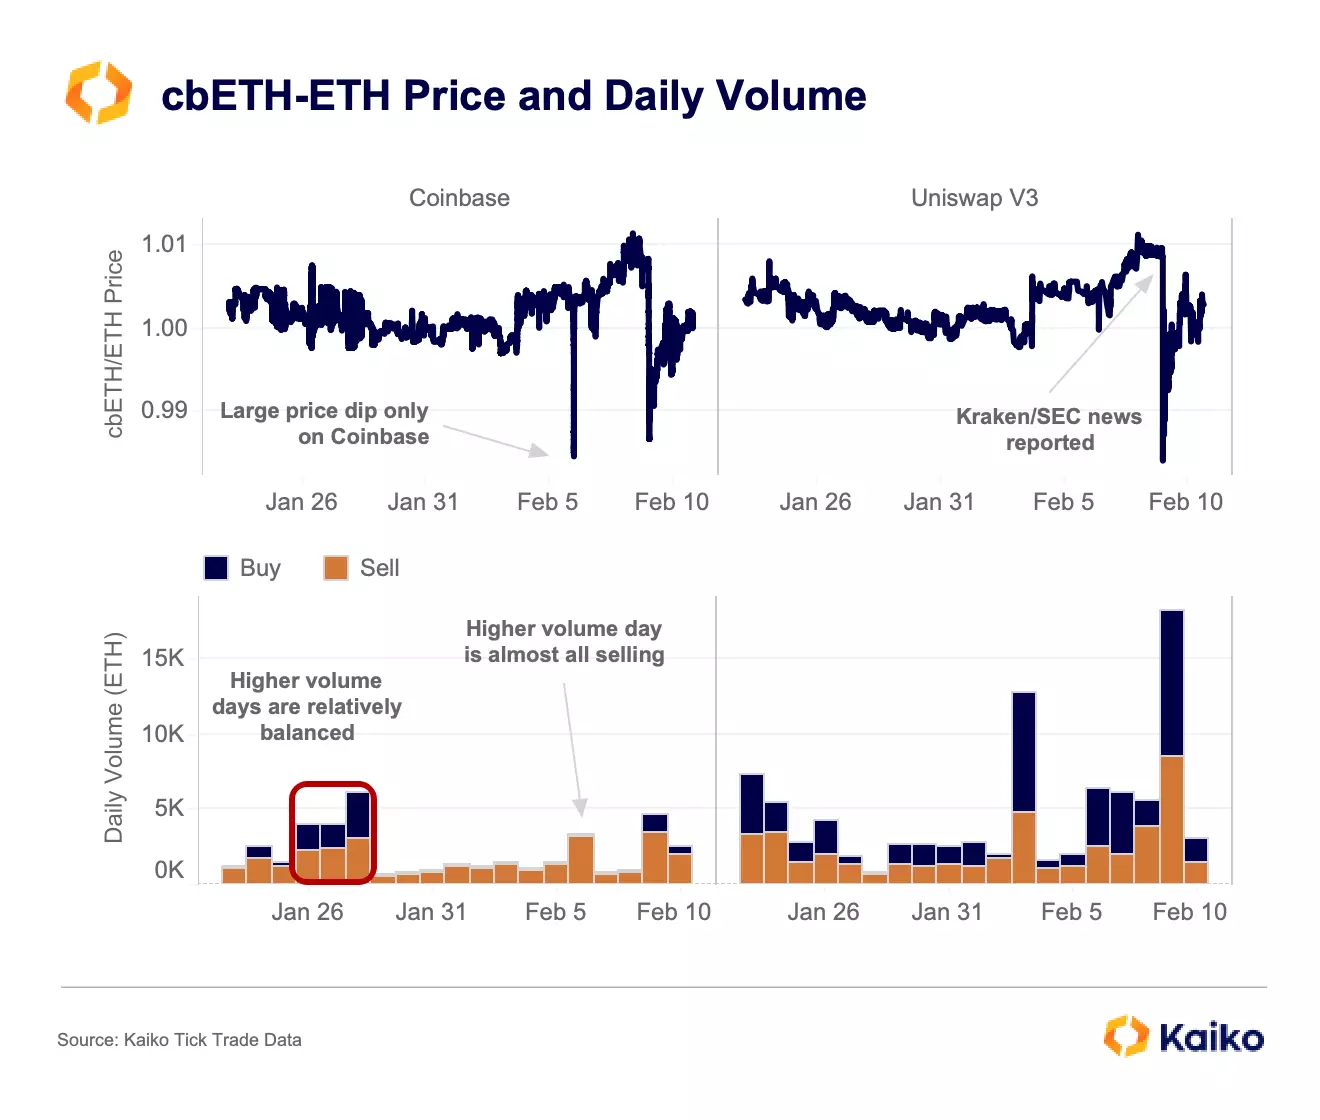
It was reported on February 8 that the SEC was investigating Kraken’s staking offering. This caused a temporary dip in cbETH’s price relative to ETH as investors speculated that Coinbase’s staking service could be in trouble. But, when using tick trade data to examine this more closely, I noticed that the price of the cbETH-ETH trading pair had actually dropped below its post-announcement low two days beforenews broke about the Kraken SEC investigation.What makes this especially interesting is that there was no corresponding drop on Uniswap V3, which had done double Coinbase’s volume for this pair over the previous two weeks.

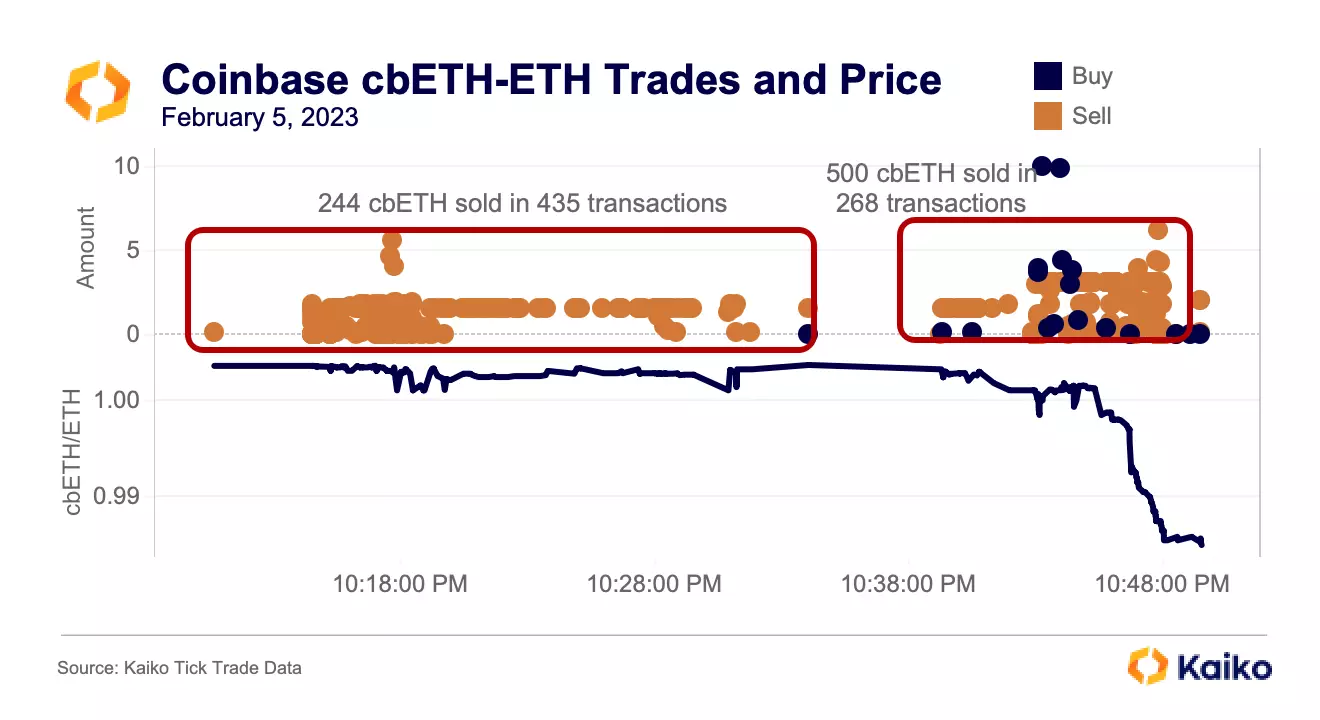
Zooming in, it appears that someone was selling off a large cbETH position. It started with selling 244 cbETH in 435 transactions in just over 20 minutes. It then escalated, with 500 cbETH sold in 268 transactions in just 8 minutes, which temporarily crashed cbETH’s price.

What is unclear is why someone would sell off their position in this manner. According to Kaiko’s DEX liquidity data, there was over 10k ETH worth of liquidity on Uniswap V3 within 20% of the current price and over 2k ETH worth of liquidity in the main cbETH Curve pool. Either option (or ideally split between CEX and DEX) would have allowed this user to liquidate their position, likely with better execution.

Instead, they liquidated a position through a CEX pair that was not liquid enough, taking a loss of about $100k because of price slippage. This suggests one or some combination of the following: 1) time was of the essence; 2) they didn’t want to be traced on-chain; or 3) they were trying to move cbETH’s price. Given the SEC/Kraken reporting just two days later, this raises red flags.

Without a view of DEXs, this event wouldn’t have immediately stuck out as anomalous; any view of crypto markets is incomplete without including DeFi.

BINANCE TRADING HOURS

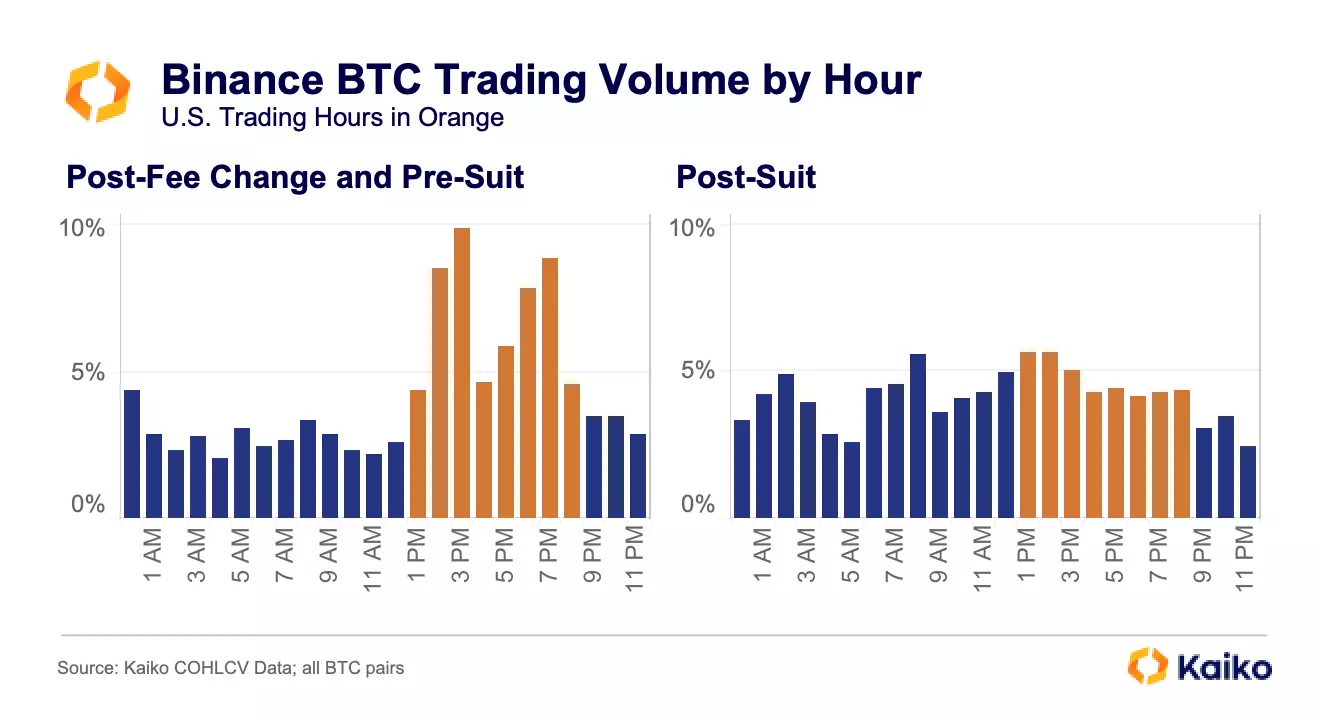
The CFTC has alleged that Binance was targeting and encouraging high volume U.S. traders to use its international exchange. As Iwrote two weeks ago, hourly volume distributions can be telling. Below I’ve charted the hourly distribution in the five days between Binance ending most zero-fee BTC trading (which caused volumes to fall 90%) and the CFTC suit next to the distribution since the CFTC lawsuit.

The results are clear: in the days before the suit, 55% of BTC volume on Binance came during U.S. hours. Since the suit, this has fallen to just 38%.

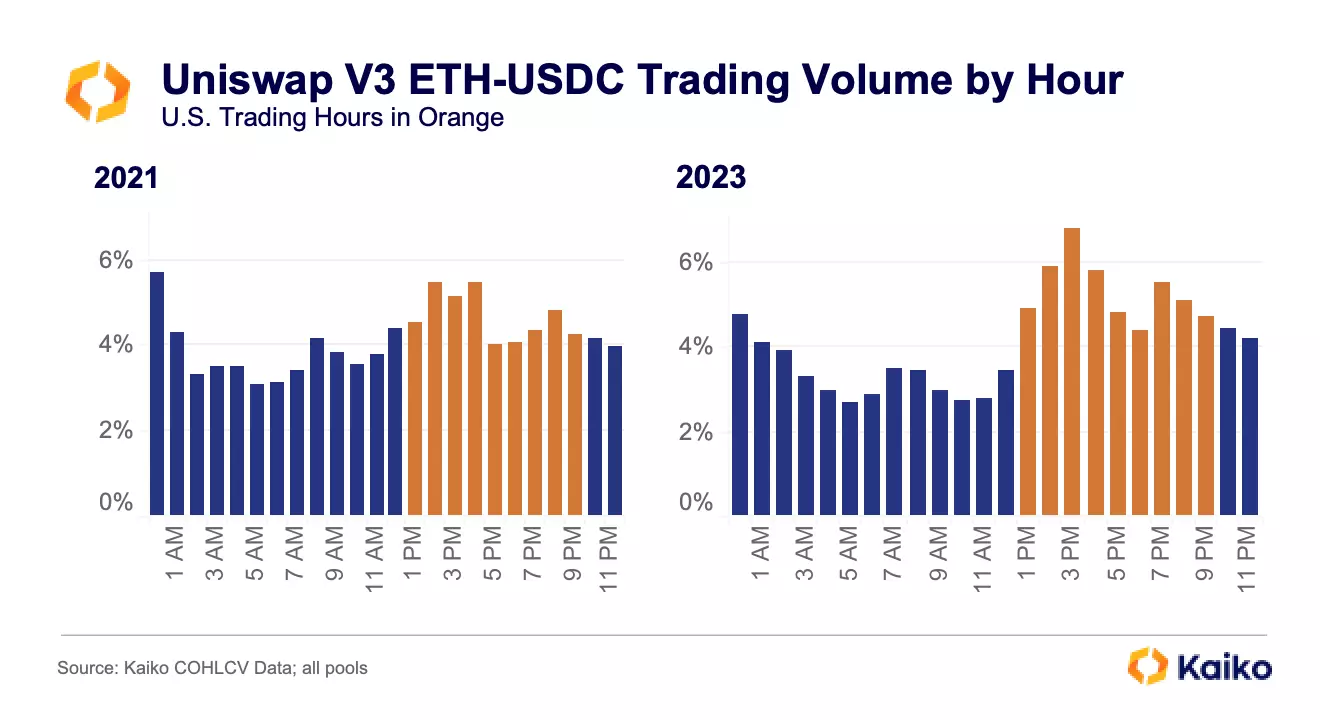
This type of analysis is possible for a variety of exchanges — including DEXs. The chart below shows that ETH-USDC trading on Uniswap V3 has become more concentrated during U.S. hours, jumping from 42% in 2021 to 48% in 2023.


Conclusion

These examples illustrate the wide range of analyses that are possible — from granular to broad — using a variety of data types. Centralized exchanges have long been opaque, especially relative to DEXs. But, by using a bit of creativity, it’s possible to reduce that opacity. While these analyses don’t showwhois trading, they make it clearwhatis happening. These methods aren’t perfect, but when combined with context like token/wallet tracking, DeFi data, and market events they can be illuminating.

Data Used In This Analysis

More From Kaiko Research